Epidemiology of fractures in the elderly
Epidemiology of different fracture types
Fractures in the elderly are increasing in incidence very rapidly and are becoming a major socio-economic problem in most countries. A rapid rise in life expectancy has meant that there are many more patients aged ≥65 years in the population than there were only two generations ago. It is forecast that this increase in the proportion of elderly in the population will continue to increase and there is no doubt that fractures in the elderly will become a more important health issue in the next 20–30 years.
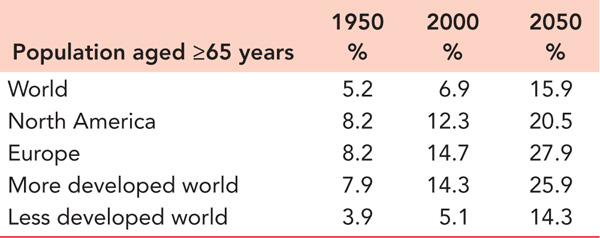
The scope of the problem is highlighted by reviewing life expectancy over the past century. In the United States, life expectancy in 1900 was 46.3 years for males and 48.3 years for females.1 In the United Kingdom, the equivalent figures in 1911 were 49.4 and 53.1 years, respectively.2 By 2010, the figures were 78.7 and 81.3, respectively, in the United States1 and 78.5 and 82.5, respectively, in the United Kingdom,2 and by 2030, it is projected that life expectancy in the United States will average 78.3 years in males and 84.2 years in females3 with the equivalent UK figures being 83.1 years and 86.4 years.4 It has been forecast that the population of the United States aged ≥65 years will rise from 35 million in 2000 to 71 million in 2030.5 In 2000, the population ≥65 years represented 12.4% of the whole population and this will rise to 19.6% by 2030.5 Table 1.1 gives figures for the proportion of the population aged ≥65 years in 1950 and 2000 in different parts of the world. It also shows projected figures for 2050.6 It can be seen that it is projected that there will be a significant rise in the elderly population throughout the world. The increase is projected to be highest in the less developed world. The analysis of the population aged ≥80 years in the United States shows an increase from 9.3 million in 2000 to 19.5 million in 2030. These figures emphasize the scope of the problem for the next 20–30 years.
HISTORY
The analysis of skeletons over the past seven millennia has shown signs of osteoporosis, particularly in females. Fractures which were possibly osteoporotic have been found in Egyptian mummies and in skeletons from the Middle Ages in England.7 These latter skeletons revealed healed rib and vertebral fractures, particularly in women with a lower femoral neck bone mineral density. There were no femoral neck fractures, probably due to the limited life expectancy in the Middle Ages.
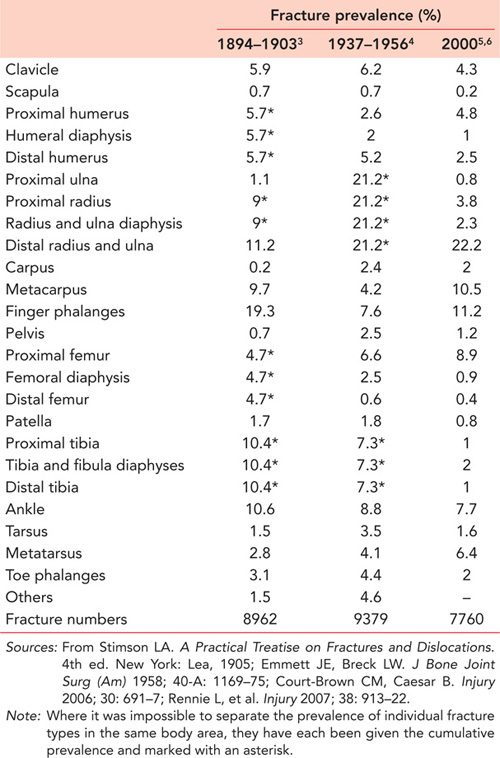
Malgaigne analysed 2377 fractures in the Hȏtel-Dieu, Paris, between 1806–1808 and 1830–1839.8 He found that fractures were commonly seen in patients between 25 and 60 years of age and recorded that there were very few fractures in patients >60 years of age, but he noted that there were very few people of that age in the population. He did observe that diaphyseal fractures tended to occur in adulthood, whereas intra-articular fractures occurred in the elderly. He also stated that fractures of the ‘cervix femoris’ and ‘cervix humeri’ tended to occur in old age and that women often sustained fractures of ‘the carpal extremity of the radius’. Stimson in New York9 and Emmet and Breck in El Paso, Texas,10 analysed very large numbers of fractures in 1894–1903 and 1937–1956, respectively. They looked at fractures in children and adults of all ages and a comparison of their results with the prevalence of fractures in adults and children in the United Kingdom in 200011,12 is shown in Table 1.2. Allowing for differences in data collection, it is clear that the prevalence of fragility fractures of the proximal femur and distal radius has risen, whereas the prevalence of higher energy injuries such as fractures of the finger phalanges or the tibial and fibular diaphyses has fallen.
Table 1.1 Estimates of the prevalence of the population aged ≥65 years in different parts of the world between 1950 and 2050
The changing epidemiology of fractures is highlighted by a review of a study of fractures in the elderly undertaken in Dundee, Scotland, and Oxford, England, under the auspices of the Medical Research Council.13 The Medical Research Council held a conference to discuss fractures in the elderly in 1956 and undertook a 5-year study. The medical and social changes between the 1950s and now are highlighted by the fact that they chose to study fractures in the elderly by analysing patients >35 years of age. The results of this study were compared with a prospective study of fractures in patients aged >35 years in Edinburgh, Scotland, in 2010/2011.14 Edinburgh and Dundee are only 60 miles apart and have a very similar racial and social structure. The results highlighted the considerable changes in fracture epidemiology over a 60-year period. The overall prevalence of fractures increased by 50%, but the prevalence in males only increased by 5% compared with 85% in females. The analysis of the classic fragility fractures shows a 209% increase in the prevalence of proximal humeral fractures. This was mirrored in humeral diaphyseal fractures (129% increase), distal humeral fractures (267% increase), proximal ulnar fractures (220% increase), distal radial and ulnar fractures (39% increase), pelvic fractures (240% increase), proximal femoral fractures (186% increase), femoral diaphyseal fractures (92% increase) and distal femoral fractures (400% increase). There was an increased rate of fall related fractures in all age groups in both males and females. The study highlighted the considerable increase in fragility fractures in the last 60 years and the effect of socio-economic change on the incidence of fractures.14
FRACTURE INCIDENCE
Accurate analyses of fracture incidence are surprisingly difficult to find in the literature for a number of reasons.15 In many parts of the world, there are no facilities to allow accurate analysis of what is a common medical condition. However, even in more affluent areas, little accurate information is available. In many countries, orthopaedic trauma is treated in different types of institutions, with severe trauma being treated in Level 1 trauma centres, or the equivalent, whereas less severe trauma is treated in community hospitals or by community surgeons in private practice. Thus very few large hospitals treat the whole range of orthopaedic trauma injuries and as there is very little communication between hospitals, accurate epidemiological information is hard to find. For this reason, a number of different methodologies have been used to try to assess fracture epidemiology. Not infrequently, information is gained from emergency department records. In many countries, emergency departments are mainly staffed by emergency doctors or surgeons in training who are very inexperienced in fracture diagnosis. This combined with the fact that information is not usually obtained from surgeons in private practice means that the epidemiological information is inaccurate. Surgeons have tried to obtain information by postal questionnaires asking patients if they have ever had a fracture. An analysis of the results of this method of obtaining fracture information has shown that reported fracture incidence is up to three times greater than the true incidence of fractures in the population.15 This is because many patients may be told by paramedical professionals or others that they may have had a fracture because they have unexplainable pain.
In countries with privatized medical systems, insurance records have been used to assess fracture incidence. Again this method relies not only on the accuracy of data input but also on the prevalence of insured people in the population. The same problem occurs if only inpatient information is used. This is easier to obtain, but the data tend to be inadequate and do not represent the whole population.
The epidemiology of fractures in the elderly has unfortunately been largely ignored by orthopaedic surgeons who have concentrated mainly on high energy injuries in younger patients. Thus much of the epidemiological information has been collected by rheumatologists and other physicians whose main interest is in the diagnosis and management of osteoporosis or in the other comorbidities associated with fractures in elderly patients. Much excellent research has been done,16,17 but understandably little information about many different types of fracture has been obtained. This problem has been complicated by the assumption that is often made that fragility fractures are simply those of the thoracolumbar spine, proximal humerus, distal radius, proximal femur and pelvis. Some comparative epidemiological data are available for these fractures, but there are many other fragility fractures in the elderly that we have very little information about. In a number of studies, fractures of the lower limb and upper limb are simply combined together and therefore little useful information is provided about many fragility fractures.
In this chapter, information about fractures in the older population has been mainly derived from two 1-year prospective studies of fracture incidence carried out in the Royal Infirmary of Edinburgh 2 years apart.18 This is the only hospital treating a defined adult population of about 520,000. There is no private orthopaedic trauma clinic in the area. In the two 1-year studies, 13,507 consecutive non-spinal fractures were analysed in patients ≥16 years of age. Of these 4786 occurred in patients ≥65 years of age and these have been analysed to give information about the epidemiology of fractures in the elderly. Spinal fractures were not included in the analysis because comparatively few low energy spinal fractures in the elderly are actually reviewed by doctors and the epidemiology of these fractures is very difficult to determine.
Table 1.2 A comparison of fracture incidence in New York (1894–1903), El Paso, Texas (1937–1956) and Edinburgh, Scotland (2000)
For the purposes of defining fracture epidemiology in older patients, data about patients aged ≥65 and ≥80 years will be presented. It is accepted that age and gender have a significant effect on fracture epidemiology, and the fracture distribution curves of the adult population ≥16 years of age show that males have a bimodal distribution with an increased incidence of fractures in young and older males, and females have a unimodal distribution with a significant increase in fracture incidence in the post-menopausal years.15
Analysis of fracture incidence in the 65+ population shows that the incidence of fractures rises with increasing age in both males and females. In females, there is a steady rise from 65 years of age, which accelerates in the late 70s. In males, the increased incidence of fractures occurs about one decade later (Figure 1.1).
Overall, 34.6% of all adult fractures occur in patients ≥65 years of age.18 The analysis shows that 77% occur in females and 23% occur in males (Table 1.3). A review of the group aged ≥80 years shows that 17.4% of all adult fractures occur in this group with 80% occurring in females and 20% occurring in males. Table 1.3 shows the overall basic epidemiology of fractures in patients aged 65+ and 80+. It can be seen that fractures of the proximal humerus, distal radius and ulna and proximal femur comprise about 65% of all fractures in patients aged 65+ and about 75% in patients aged 80+. However, it is important to observe that more fractures of the proximal humerus, distal humerus, pelvis, proximal femur, femoral diaphysis, distal femur and patella occur in patients aged ≥65 years than in younger patients. More than 50% of all pelvic and proximal femoral fractures occur in patients aged ≥80 years. In the 65+ group, only fractures of the tibia and fibula, talus and toes occur as commonly in males as in females. In the 80+ group, all fractures are more commonly seen in females.
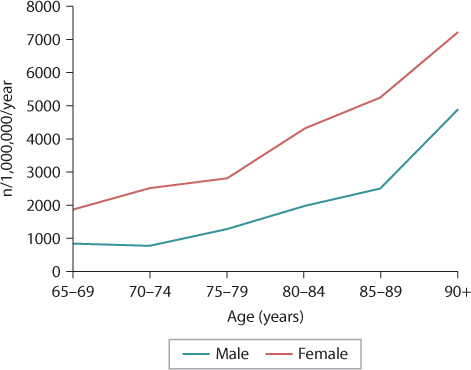
Figure 1.1 The age distribution curve for fractures in the 65+ population. (From Court-Brown CM, et al. Bone Joint J 2014; 96-B: 366–72.)
Tables 1.4 and 1.5 show similar epidemiological data for both males and females, but they also show the incidence of each fracture type. In males, it can be seen that only fractures of the proximal femur and femoral diaphysis are seen predominantly in patients ≥65 years of age and that overall 16.9% of male fractures occur in this age group. The data show that 7.1% of fractures in males occur in patients ≥80 years of age. In this group, 56.4% of all fractures involve the proximal humerus, distal radius or proximal femur. Only proximal femoral fractures show a predominance in patients aged ≥80 years compared with younger patients.
Table 1.3 The epidemiology of fractures in a 2-year period in patients 65+ years and 80+ years
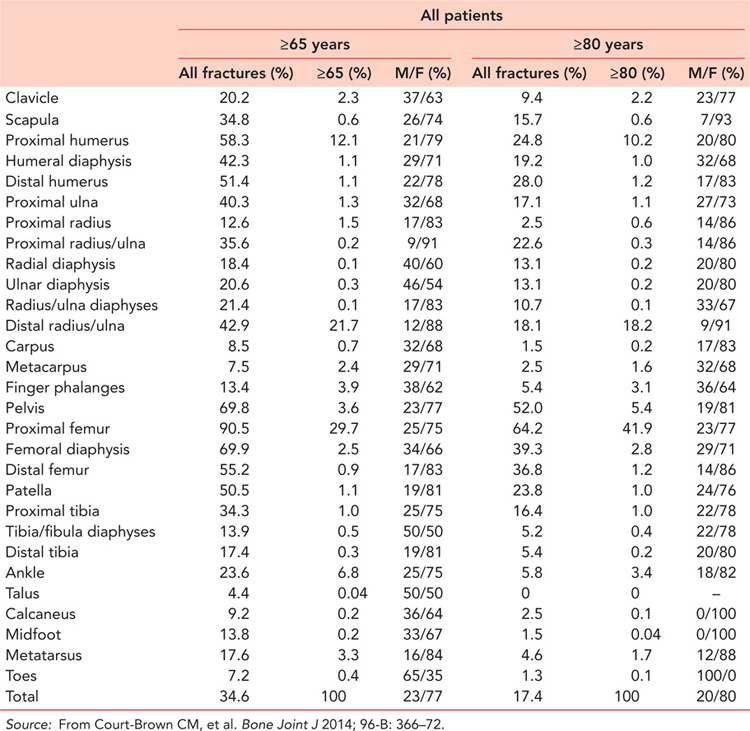
Table 1.4 The epidemiology of male fractures in a 2-year period in patients 65+ years and 80+ years
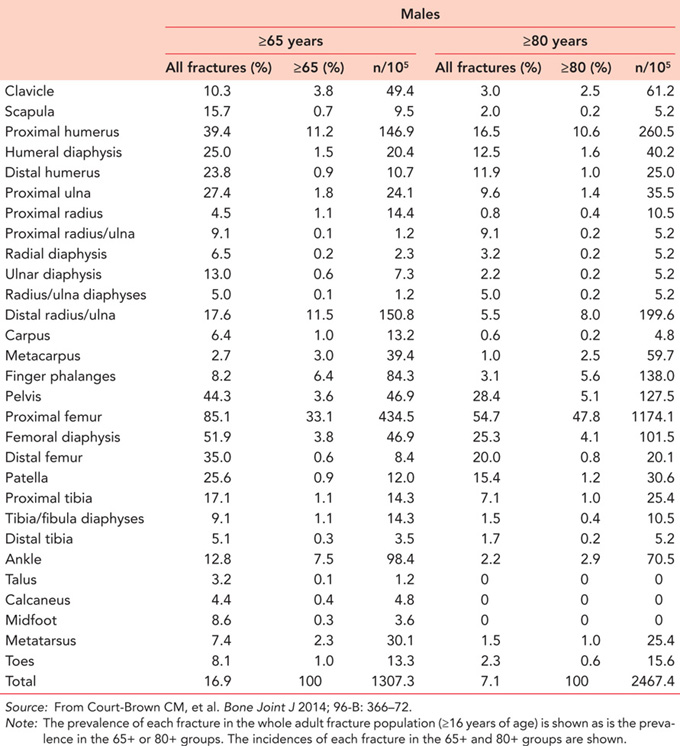
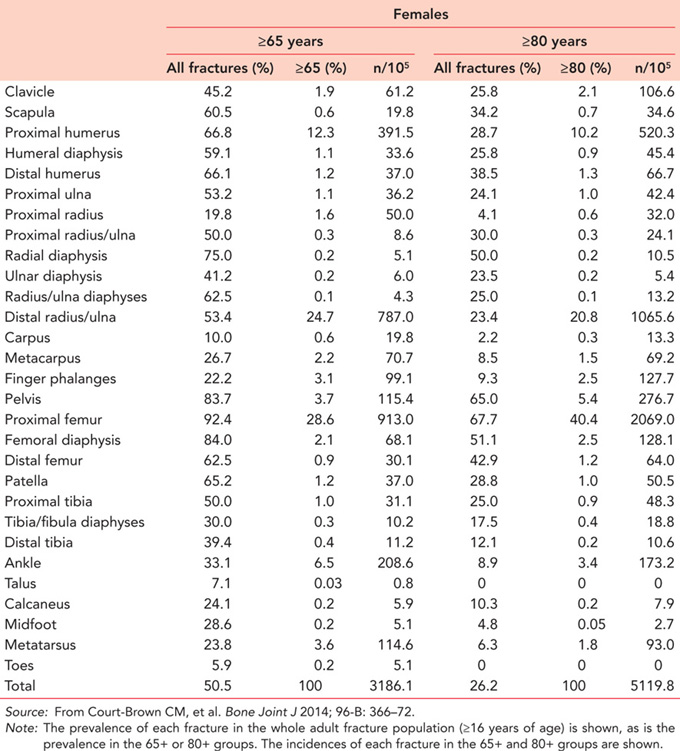
Table 1.5 shows that in females the situation is somewhat different. In females, 50.5% of all fractures occur in patients aged ≥65 years and 26.2% occur in patients ≥80 years of age. In 15 of the different fracture types listed in Table 1.5, there was a higher prevalence in patients aged ≥65 years compared with younger patients, and in patients aged ≥65 years proximal humeral, distal radial and proximal femoral fractures accounted for 66.6% of all fractures. Analysis of the 80+ group shows that 26.2% of fractures occurred in this group and in four fracture types at least 50% of the fractures occurred in patients aged 80+ years. These are fractures of the radial diaphysis, pelvis, proximal femur and femoral diaphysis.
Analysis of the incidence of fractures in 5-year intervals from 65 to 89 years and in those aged 90+ years shows that there are six patterns of fracture incidence in the older population (Figure 1.2).18 In Type I fractures, there is a statistical correlation between increasing age and increasing fracture incidence in both males and females between 65–90 years of age. This occurs in fractures of the proximal humerus, distal radius and ulna, pelvis, proximal femur and femoral diaphysis. Type II fractures show an increasing incidence in females only. This is seen in fractures of the clavicle, distal humerus, radial diaphysis, ulnar diaphysis, distal femur and proximal tibia. In Type III fractures, there is an increased incidence in males, but not in females. This is seen in metacarpal fractures. In Type IV fractures, there is a decreasing incidence in males with increasing age. This is seen in fractures of the ankle and calcaneus. In Type V fractures, it is females who show evidence of a decreasing incidence with increasing age. This is seen in fractures of the midfoot and toes. All other fracture types have a Type VI pattern with no correlation between fracture incidence and increasing age. However, four of the fractures that showed a Type VI pattern showed evidence of increasing or decreasing incidence which failed to reach statistical significance. With an increasing population and increasing number of fractures in the elderly population, it is likely that these four fractures will need to be reclassified. Humeral diaphyseal fractures would be classified as a Type II fracture, proximal ulnar fractures would be reclassified as a Type III fracture, proximal radial fractures would become a Type IV fracture and carpal fractures would show a Type V pattern.
Table 1.5 The epidemiology of female fractures in a 2-year period in patients 65+ years and 80+ years
Surgeons will not be surprised by the Type I fractures, but when considering the Type II and III patterns, they may be surprised at the increasing incidence of clavicular, radial diaphyseal, ulnar diaphyseal and proximal tibial fractures in females and metacarpal fractures in males. Further analysis of clavicular fractures shows that both distal and diaphyseal clavicular fractures increase in incidence in females with increasing age and distal clavicle fractures increase in incidence in males, giving distal clavicle fractures a Type I pattern.
Some fractures continue to increase in incidence up to the mid-70s, but then decrease in incidence, particularly in males. This is seen in ankle and calcaneal fractures. In a previous study,11 it was stated that bimalleolar and trimalleolar ankle fractures should be considered as fragility fractures as the patients’ average age was the same as that of patients presenting with distal radial fractures. Whereas the incidence of distal radial fractures increases after 80 years, the incidence of ankle fractures decreases, particularly in males. This is also seen in calcaneal fractures and presumably relates to increasing male frailty with increasing age when compared with females.
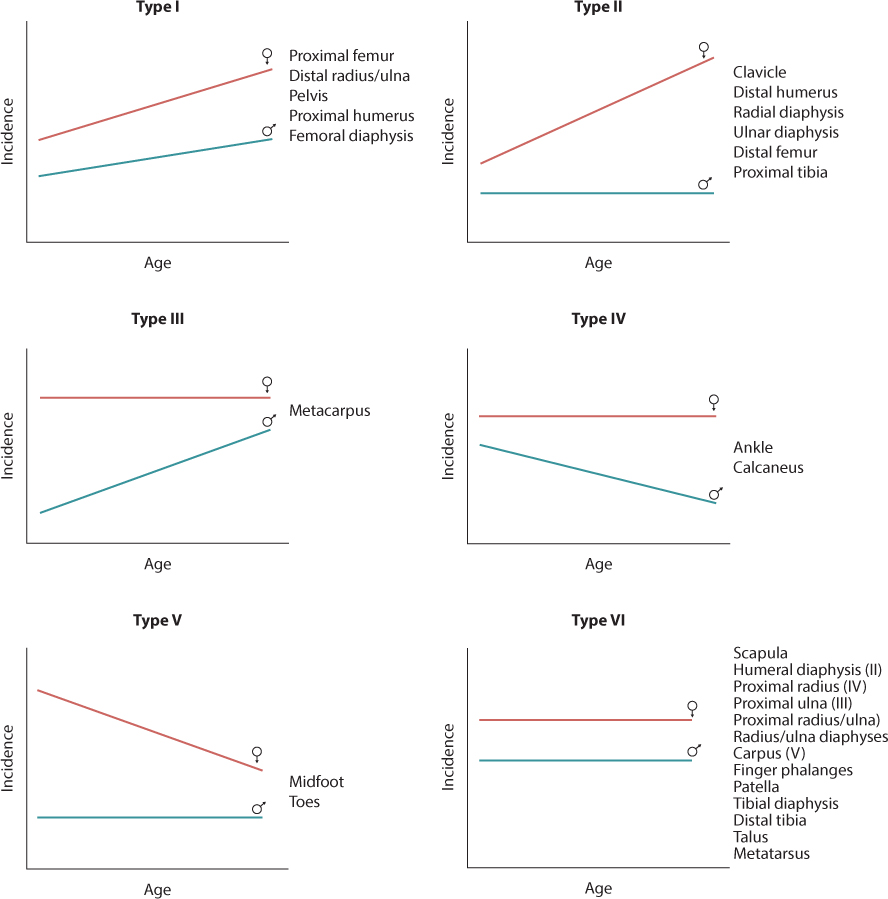
Figure 1.2 Six fracture patterns that are seen in patients aged ≥65 years. In the Type VI fractures four fracture patterns will probably change in the future. (From Court-Brown CM, et al. Bone Joint J 2014; 96-B: 366–72.)
CAUSES OF FRACTURE
Review of different modes of injury that cause fractures in the elderly shows that falls from a standing height have a Type I pattern18 with increasing fracture incidence in both males and females. Falls from a low height (<6 feet) or downstairs are unusual, in that there is a positive correlation with age in males, but not in females. This again may reflect male frailty. Falls from a height, direct blows or assaults, road traffic accidents and sports related fractures showed a Type VI pattern18 with no correlation between increasing age and fracture incidence. However, spontaneous fractures showed a Type III pattern18 with increasing fracture incidence in males.
Falls from a standing height
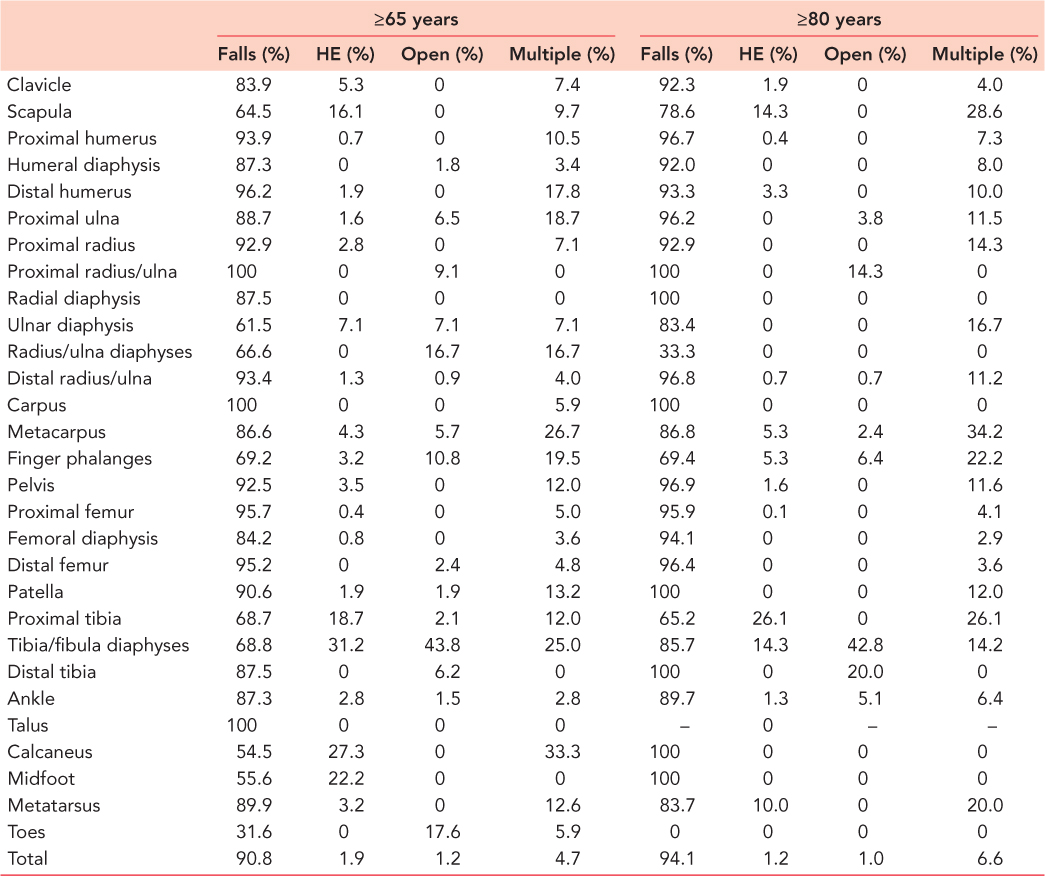
It is widely accepted that falls from a standing height cause most fractures in elderly patients. Table 1.6 presents an analysis of the prevalence of falls in each fracture type and it can be seen that overall 90.8% of fractures in patients ≥65 years of age are caused by falls from a standing height. Falls cause 82.5% of fractures in males and 93.2% of fractures in females aged ≥65 years. In the 80+ group, 94.1% of fractures were caused by falls. In males, 89.5% of fractures were caused by falls and in females this rose to 95.3%. Table 1.6 shows that in 10 fracture types, at least 90% of all fractures were caused by falls in the 65+ group. This rose to 17 fracture types in the 80+ group emphasizing the importance of falls in the very elderly. The only fracture where less than 50% of fractures in the 65+ group were caused by falls was the toe fracture, where most were caused by direct blows. However, it should be noted that the prevalence of fall related fractures is less in the scapula and in the proximal tibia, tibial diaphysis, calcaneus and midfoot, than it is in other fractures. These fractures are more commonly seen in younger patients, particularly in males. Falls are discussed in detail in Chapter 12.
Table 1.6 The prevalence of fractures caused by falls from a standing height and high energy (HE) injuries is shown, as is the prevalence of open and multiple fractures
High energy fractures
In recent years, there has been considerable interest in high energy fractures19 but virtually all studies have concentrated on younger patients. Table 1.6 shows that 1.9% of fractures in the 65+ group and 1.2% of fractures in the 80+ group were caused by high energy injuries, these being defined as road traffic accidents or falls from a height. Table 1.6 shows that in the 65+ group the fractures most likely to be caused by a high energy injury are those of the scapula, proximal tibia, tibial diaphysis, calcaneus and midfoot. In the 80+ group, fractures of the scapula, proximal tibia and tibial diaphysis had the highest likelihood of being caused by high energy injuries. In the 65+ group, 84.6% of high energy fractures were caused by a road traffic accident and 15.4% were caused by a fall from a height (>6 feet). In the 80+ group, the figures were 76.7% and 23.3%, respectively.
Analysis of the patients injured in road traffic accidents in the 65+ group showed that 57.5% of the fractures occurred in pedestrians, 18.2% in cyclists, 16.7% in vehicle occupants and 7.6% in motorcyclists. Further analysis showed that 31.8% presented with multiple fractures and 9.1% of the fractures were open. In the 80+ group, 73.9% of the fractures were in pedestrians, 17.4% in vehicle occupants and 8.7% occurred in motorcyclists. This older group were more severely injured with 76.9% of patients having multiple fractures and 15% presenting with open fractures. High energy fractures in the elderly are discussed in detail in Chapter 14.
MULTIPLE FRACTURES
Table 1.6 shows that the prevalence of multiple fractures in older patients20 increases with age and analysis of the incidence of multiple fractures in 5-year age ranges shows that multiple fractures have a Type I pattern,18 with increasing incidence in both males and females with increasing age. In younger patients, multiple fractures tend to occur as a result of high energy injuries, but in older patients increasing frailty means that multiple fractures can occur as a result of low energy trauma. This is the cause of the increased prevalence of multiple fractures in the group aged 80+ years. Multiple injuries are discussed in detail in Chapter 15.
OPEN FRACTURES
Table 1.6 shows that open fractures are uncommon in the elderly, but analysis of the prevalence of open fractures in the younger patients (<65 years) during a 2-year study showed that 3.2% of fractures in males were open, compared with 1.2% of fractures in females. Thus the proportion of fractures in the elderly that are open is not actually dissimilar to that in younger patients. The analysis shows that open fractures in the elderly have a Type VI distribution18 with no correlation between increasing age and fracture incidence in patients ≥65 years of age.
Because of the rarity of open fractures in the elderly, a study was undertaken to examine the epidemiology of open fractures in the elderly over a 15-year period between 1995 and 2009.21 During this period there were 484 open fractures in the elderly. The incidence of open fractures increased with age. In patients <65 years of age the incidence was 29.74/105/year. This increased to 33.2/105/year in the 65+ group and to 44.7/105/year in the 80+ group. Thus despite the fact that Table 1.6 indicates that there is a low prevalence of open fractures in older patients, the incidence rises with age. The fracture distribution curves for open fractures are very different to those for closed fractures. Figure 1.3 shows the fracture distribution curves for open fractures in all age groups in males and females. It can be seen that in males the highest incidence is in the 15- to 19-year-old group where it was 53.7/105/year. In males, the incidence of open fractures declines in an almost linear fashion with age, so that in males aged ≥90 years the incidence is 23.2/105/year. In females, the 15- to 19-year-old group has a very low incidence of open fractures at 9.3/105/year. This gradually increases until the seventh decade of life when the incidence accelerates rising to 52.6/105/year in the ≥90-year-old group.
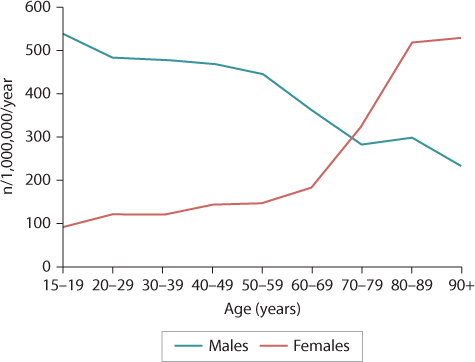
Figure 1.3 The fracture distribution curves for open fractures. (From Court-Brown CM, et al. Injury 2015; 46:189–94.)
Related posts:

Stay updated, free articles. Join our Telegram channel

Full access? Get Clinical Tree


