Magnetic Resonance Imaging of Foot and Ankle Pathology
ADNAN SHEIKH, MARCOS LORETO SAMPAIO AND MARK E. SCHWEITZER
The complex anatomy of the foot and ankle makes imaging of this region challenging. Magnetic resonance imaging (MRI), with its multiplanar capabilities, superior soft tissue contrast, excellent spatial resolution, ability to image bone marrow, noninvasiveness, and lack of ionizing radiation, has become a valuable tool in evaluating patients with foot and ankle problems.1,2 MRI allows a global evaluation of the bones, tendons, ligaments, and other structures with a single examination that exceeds the capabilities of all other available techniques.
IMAGING TECHNIQUES
After a careful and detailed clinical history and physical examination, imaging studies play a vital role in the diagnosis and management of patients with ankle and foot pathology. Initial evaluation should begin with radiographs, which usually provide adequate screening for most skeletal abnormalities. Computed tomography (CT) displays bony and soft tissue detail and is helpful in the assessment of trauma as well as arthritis and tarsal coalition. Bone scintigraphy can be utilized to detect subtle bone lesions like stress fracture. Ultrasonography has both a diagnostic and therapeutic guiding role. Recently, ultrasound has been widely used in the assessment of tendon pathology, especially the Achilles tendon. It also has a role in the diagnosis of superficial soft tissue masses.
MRI is the best diagnostic imaging modality for nonbony abnormalities and has become the ancillary method most used in evaluating musculoskeletal disorders of the foot and ankle. Osteoarthritis (OA) and fractures, for example, are visible on MRI and CT, but the capability to evaluate soft tissue change associated with bone pathology makes MRI superior to CT.3
High-resolution images of the ankle are obtained utilizing a quadrature and/or phased array extremity coil.2,4 MRI should be performed on a 3 T scanner when available. Routinely utilized pulse sequences are listed in Box 25-1.1,5,6
BOX 25-1 Routinely Used Pulse Sequences for Foot and Ankle MRI
Conventional T1- or PD-weighted spin echo T2- or PD-weighted FSE with fat suppression STIR (short-tau inversion recovery)
Images may be acquired using a matrix of 192 × 256 to 256 × 256, and in some cases a matrix of 256 × 512 or even 512 × 512 can be used. For the typical ankle or midfoot study, a 12- to 14-cm field of view with a 192 × 256 or 256 × 256 matrix is employed. Slice thickness is 3 mm or less throughout. T1-weighted spin echo pulse sequences using TE = 20 ms, TR = 600 ms, and conventional T2-weighted spin echo pulse sequences of TE = 30 to 80 ms and TR = 2000 ms are typically employed. Typically, fast spin echo (FSE) techniques include TE = 40/100 ms and TR = 4000 ms.7
Pedal images are obtained in axial, sagittal, and coronal planes with the foot in neutral position (10°–20° of plantar flexion). However, the forefoot is imaged with the patient lying prone so as to orient the long axis of the foot to the long axis of the imaging plane.
MRI is indicated in the evaluation of trauma, acute and chronic ligamentous injury, tendon injury, osteochondral defect, ischemia, infection, and bone and soft tissue tumors. In the forefoot, it is commonly utilized to assess Morton neuroma. The presence of orthopedic hardware can significantly compromise image quality by producing artifacts secondary to magnetic susceptibility. Techniques can be employed to reduce these artifacts (Box 25-2).8,9
BOX 25-2 Methods Used to Reduce Orthopedic Hardware Artifacts
Using a higher bandwidth
Using FSE instead of spin echo sequences
Avoiding gradient echo sequence
Using STIR (short-tau inversion recovery) instead of T2-fat-saturated sequence
Lowering echo time
Using large frequency encoding matrix
Orienting frequency encoding direction along the longitudinal axis of the implant
In general, axial images are best for assessing ligaments and tendons. Sagittal images demonstrate the talar dome, sinus tarsi, and provide a second look at the tendons. Coronal FSE T2-weighted images best assess the ankle mortise and articular cartilage.
TENDONS
Tendons are cord- or strap-like, relatively avascular, structures that attach muscle to bone. They contain fascicles of type 1 collagen that are mainly oriented parallel to the long axis, but also to some extent interwoven. The tendons traversing the ankle are listed in Box 25-3. A sheath encloses all the ankle tendons except the Achilles and peroneus tertius tendons.
BOX 25-3 Tendons Surrounding the Ankle
Position Relative to Ankle | Tendons |
Lateral | Peroneus brevis and peroneus longus |
Medial | Tibialis posterior, flexor digitorum brevis, and flexor hallucis longus |
Anterior | Tibialis anterior, extensor hallucis longus, and extensor digitorum |
Posterior | Achilles |
A normal tendon appears round, oval, or flat with sharp margins when imaged transversely. A very small amount of fluid may be seen within the tendon sheath; except for the flexor hallucis longus (FHL), this should not be circumferential. In MR, the tendons are best evaluated with T1/proton density (PD) and FSE T2-weighted sequences in axial and sagittal planes. Normal tendon demonstrates low-signal intensity on all MR sequences. A dedicated extremity coil is necessary, and the foot should be slightly flexed to minimize the magic angle artifact.
Common ankle tendon pathologies include tendon degeneration and partial or complete tear secondary to degeneration, trauma, steroid therapy, or chronic inflammatory diseases, such as rheumatoid arthritis (RA).
Posterior Tibialis Tendon
The posterior tibialis muscle originates from the interosseous membrane and adjacent proximal third of the posterior tibial surface. It forms a tendon in the distal third of the leg and lies closely apposed to the tibia posteromedially, in a sulcus. The tendon then courses directly posterior and inferior to the medial malleolus. It has attachments to the medial pole of the navicular (navicular tubercle), the plantar surfaces of the three cuneiforms, the sustentaculum talus, the cuboid, and the second through fourth metatarsal bases.10 The posterior tibialis tendon (PTT) supports the medial longitudinal foot arch and leads to arch failure and pes planus or planovalgus when torn. At the level of the medial malleolus, the tendon lays beneath the flexor retinaculum; together with the sulcus they form a fibro-osseous tunnel that prevents the flexor tendons from bowstringing as they curve around the malleolus.10–12
On transverse MR images at the level of the distal tibia, the normal tendon appears to be twice the cross-sectional area of the adjacent flexor digitorum longus (FDL) tendon (Figure 25-1).13,14 The PTT should be slightly smaller than the anterior tibialis tendon. Additionally, the PTT should be slightly smaller than the summated thickness of the peroneus brevis and peroneus longus tendons.14
On sagittal images, the PTT should have a smooth curve around the medial malleolus with only a small amount of fluid in its synovial sheath, measuring no more than 1 to 2 mm. This should almost never be circumferential, and notably there is no normal sheath around the distal 2 cm of the PTT.12,13
The signal intensity of the PTT is normally uniformly low along most of its course (on images obtained with all pulse sequences). However, it often demonstrates increased T1- and T2-weighted signal intensity with a thickened appearance at its attachment to the medial navicular, making it more difficult to accurately diagnose tears in this area when relative size and signal intensity criteria are used.5,12 Fortunately tears are rare in this region.
Three distinct accessory navicular entities have been described in the literature (Box 25-4).3 When an accessory navicular type II is present, the accessory navicular acts as if it were a native navicular with the bulk of the PTT inserting onto the ossicle. The presence of an accessory navicular type II or III increases the risk factor for PTT tears.1,2,4
BOX 25-4 Types of Accessory Navicular
Type I | Small round ossicle distinct from the PTT sheath |
Type II | A large triangular ossification center adjacent to the navicular bone |
Type III | Enlarged medial horn of the navicular, cornuate navicular |
The most common location of PTT disorders is the perimalleolar region (Figures 25-2 and 25-3). The second commonest location is near its distal attachment to the navicular.1,12 Distal tears are a typical location for injury in young athletic individuals and in patients with inflammatory arthropathy.
PTT dysfunction is a continuum that includes tendinosis, partial and full-thickness tears (Figure 25-4). Tendinosis results from chronic wear and tear. The tendon appears thickened with increased intermediate-signal intensity on T1- and T2-weighted MR images. PTT tears have been associated with sinus tarsi syndrome, OA of the posterior subtalar joint, and late development of secondary lateral impingement and pain,6,15 all likely sequellae rather than causative. Rosenberg et al.6 have classified PTT tears into three types (Box 25-5).
BOX 25-5 Classification of PTT Tears
Type I | Incomplete tear with tendon thickening and vertical slits within the tendon |
Type II | Partial tear with focal areas of tendon thinning |
Type III | Completely torn tendon, with gaps seen within the tendon on axial and sagittal images |
The technical aspects of performing MRI of the PTT are controversial. The axial plane is optimal; however, some institutions prefer oblique axial imaging perpendicular to the long axis of the PTT. Sagittal imaging is the secondary plane, with coronal used only as a supplement. Two sets of axial images are ideal. One set of images should be morphology weighted to optimize the signal-to-noise ratio (FSE; TR/TE, 4000/38; echo train length, four; field of view, 14; matrix, 256 × 256), and one set of images should be T2-weighted using fat suppression and FSE. Sagittal images should be T1-weighted and either T2-weighted with fat suppression or short-tau inversion recovery. The sagittal images depict the distal PTT and its malleolar curve, and the axial images depict perimalleolar abnormalities. A dedicated extremity coil is necessary, and some institutions slightly plantarflex the foot to minimize the “magic angle” artifact.
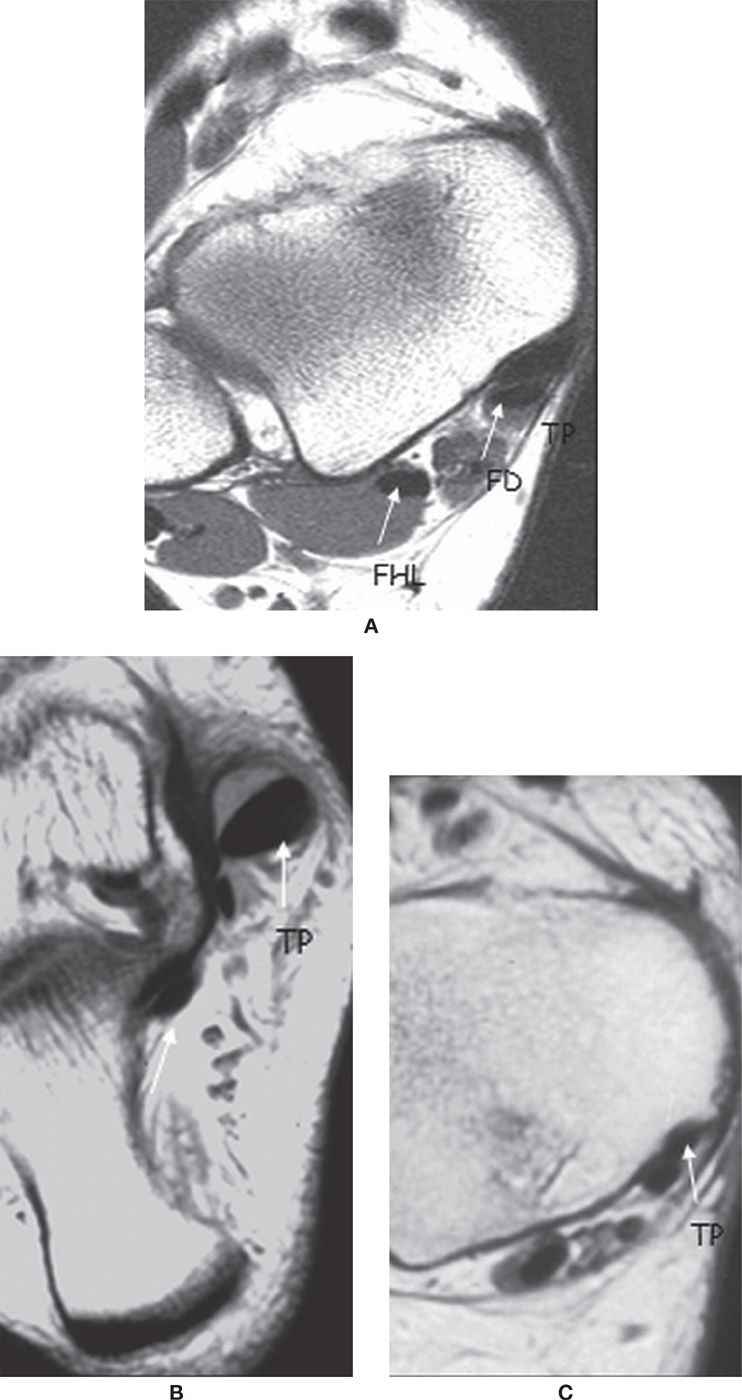
FIGURE 25-1. Medial ankle tendons; axial PD-weighted sequences. A: The normal PTT is twice the size of the FDL tendon. B: Thickened PTT in relation to the FDL. C: The PTT is thin.
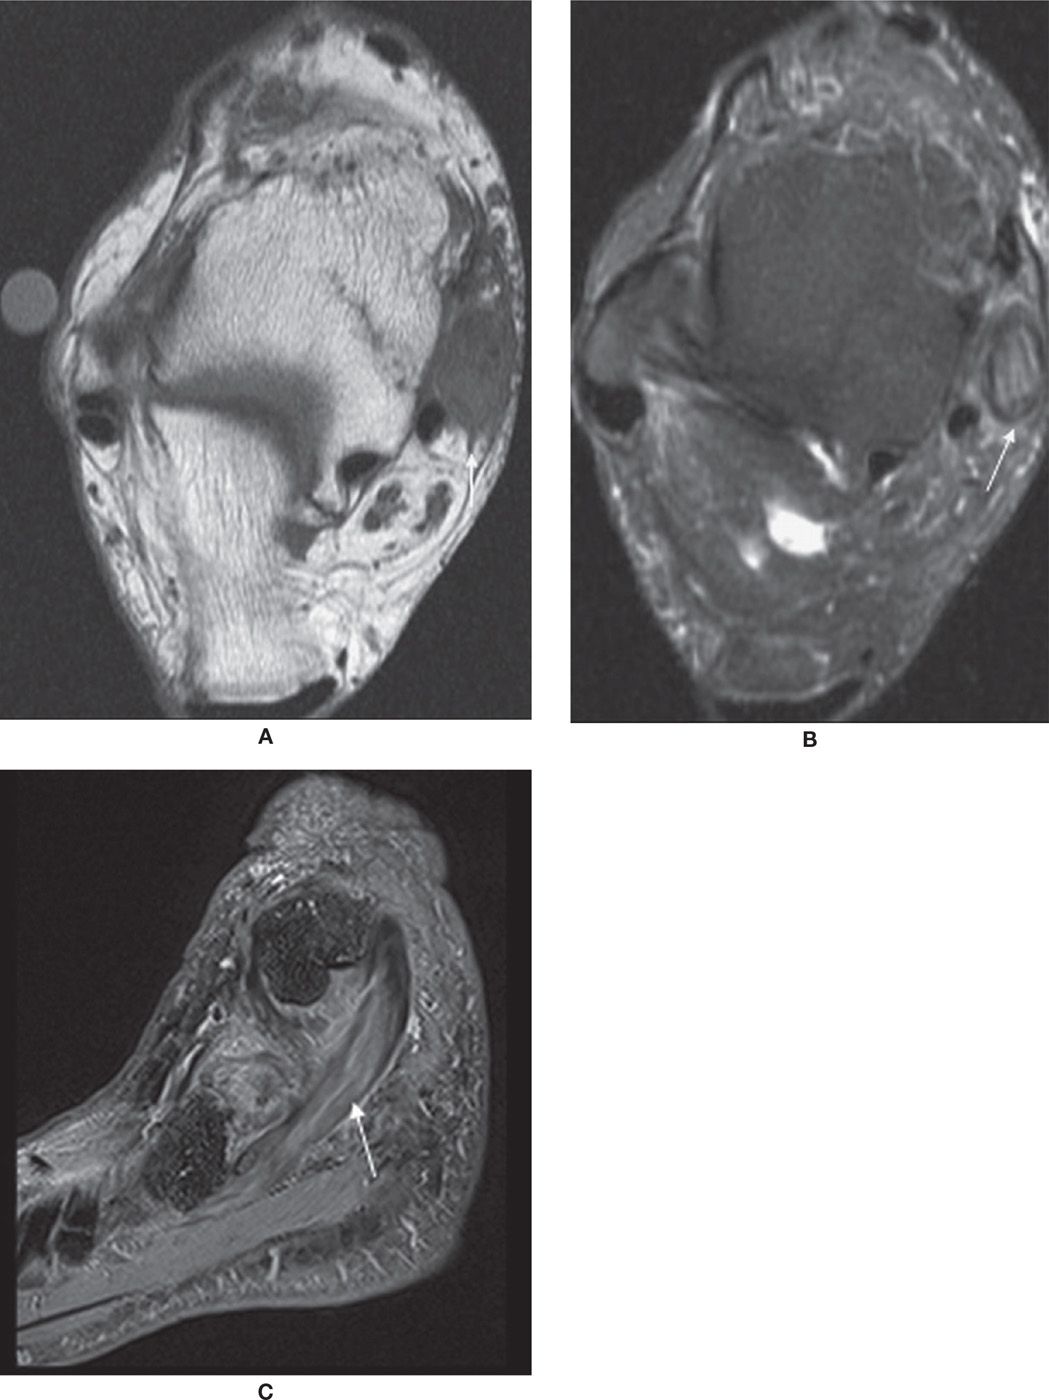
FIGURE 25-2. Thickened PTT with intrasubstance signal and surrounding edema in keeping with partial tear. Axial T1- (A), axial T2-fat-saturation- (B), and sagittal T2-fat-saturation- (C) weighted sequences.
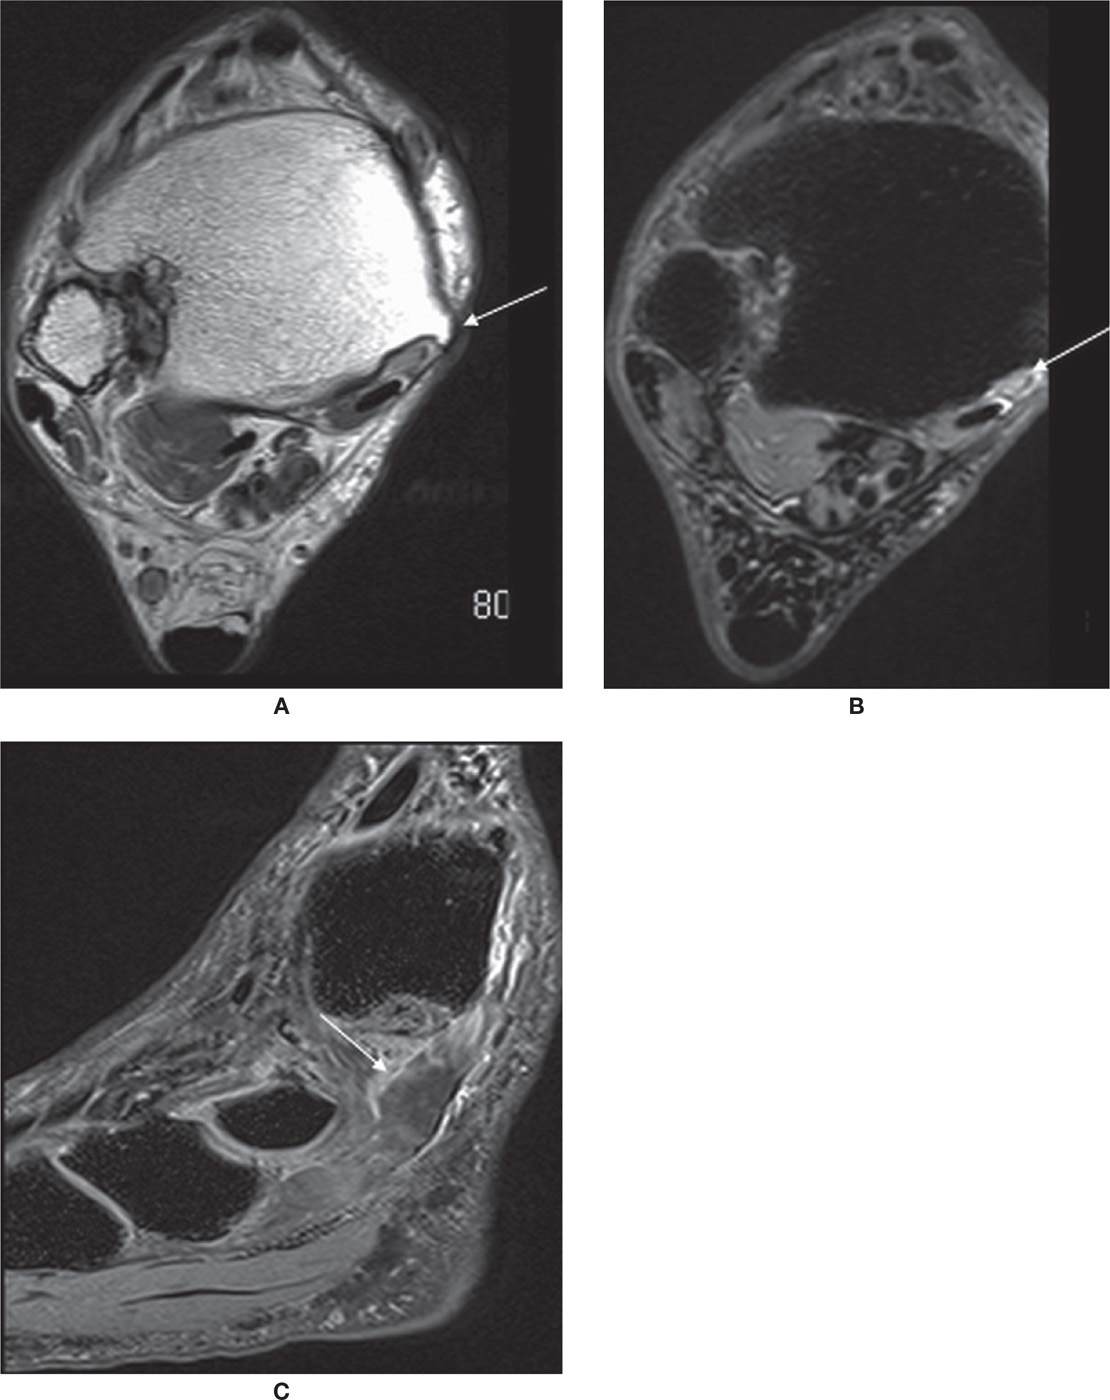
FIGURE 25-3. PTT rupture. Axial PD- (A) and axial T2-fat-saturation- (B) weighted sequences. Torn PTT, replaced by fluid (arrow). Sagittal T2-fat-saturation- (C) weighted sequence. Free end of the tendon is distal to the rupture (arrow).
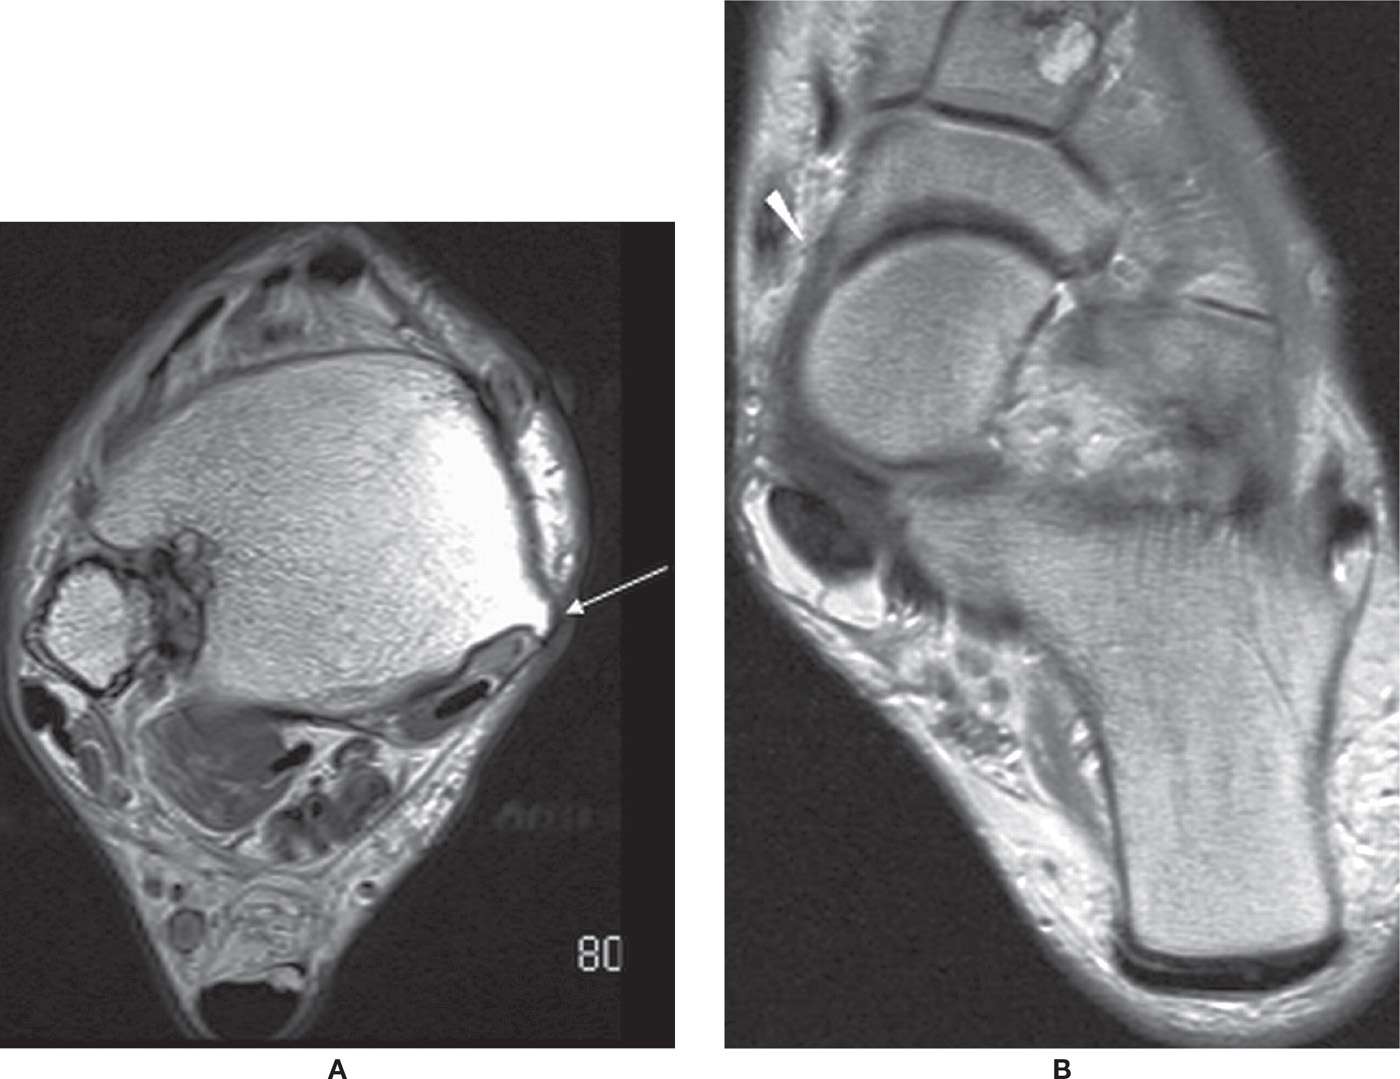
FIGURE 25-4. PTT dysfunction; axial PD-weighted sequences. A: Atrophic tendon and tibial spur. The PTT is thinned adjacent to spur (arrow) characteristic of PTT dysfunction. B: Unroofing of upper aspect of talus with navicular subluxated laterally exposing medial talonavicular head (arrowhead), a secondary sign of PTT insufficiency. Patient also had interstitial tear of PTT.
The PTT can tear secondary to longitudinal splitting related to longitudinally directed stresses.4,12 The appearance of two separate PTTs, when grouped with the two other medial ankle tendons, produces the four-tendon sign.8
Various secondary signs of PTT dysfunction have been described.2,4 Talonavicular fault is the result of excessive plantar flexion of the talus on the lateral radiograph and sagittal MR images. On the sagittal image where the base of the first metatarsal is visible, a long axis is drawn on the talus and is extended into the navicular. Failure of this line to divide a navicular into equal superoinferior parts, with the line positioned inferiorly, is a manifestation of the talonavicular fault and a dysfunctional PTT; this indicates failure to support the longitudinal arch of the foot. A focal spur in the distal tibia is common and may be a manifestation of the biomechanical adaptive deepening of the tibial sulcus.
Unopposed pull of the peroneus brevis tendon can shift the entire mid- and forefoot laterally, and subluxation of the navicular in relationship to the talus may be evident. This is the MR analogue of the clinical “too many toes sign.”
Heel valgus may be evident on coronal images. The normal tibiocalcaneal alignment is 0° to 6° valgus. When this is longstanding, it may result in sinus tarsi syndrome (77%), fibula impaction, and rarely peroneal dislocation.
Patients with PTT dysfunction may have associated spring ligament abnormality (97%) and plantar fasciitis (37%).1 Anterior and medial dislocation of the PTT is rare.16
Flexor Digitorum Longus and Flexor Hallucis Longus Tendons
Disorders to the FDL and FHL tendons are less common when compared to the PTT. The FDL passes lateral to the PTT and divides to insert to the plantar aspect of the distal phalanges of the second to fifth toes. The FHL is the medial of the three medial tendons; it passes beneath the sustentaculum tali and then along the plantar aspect of the foot between the hallux sesamoids to attach to the base of the distal phalanx of the first toe.8 The tendon sheath of the FHL communicates with the ankle joint in 20% of the population. Therefore, fluid within the tendon sheath may be common and will be of no significance if ankle effusion is present.17 This is similar to an occurrence of a Baker cyst in the knee.
Full-thickness tear of the FDL and FHL is rare. FHL tenosynovitis is more common and is seen after repetitive plantar flexion, usually in ballet dancers and soccer players, or rarely in American football kickers. T2-weighted images show significant fluid within the tendon sheath. FHL tenosynovitis may also be associated with os trigonum syndrome and with a FDL accessory muscle.17–20 In the former, it will show compartmentalized fluid; the os trigonum forms a mechanical dam to tendon sheath flow (Figure 25-5).
The Anterior Tendons
The tibialis anterior (TA), extensor hallucis longus, and extensor digitorum longus tendons form the anterior tendons. Injury to the extensor hallucis longus and extensor digitorum longus tendons is rare. Tenosynovitis of the TA tendon may be seen in rheumatoid arthritis or downhill runners.21 Complete or partial tear of the TA is uncommon (Figure 25-6). TA tears occur with forced plantarflexion in the middle aged and elderly. These tears often present as a mass on the anterior aspect of the foot; the clinical and imaging differential diagnosis is a ganglion. T2-weighted sagittal and axial MR images are the best to assess these tendons, which can show tendon retraction and thickening.1,22 These patients usually present with a mass in the anterior ankle, which may be suspected to a tumor rather than tendon abnormality.
Achilles Tendon
The Achilles tendon is the strongest tendon in the foot and ankle and is formed by the confluence of gastrocnemius and soleus muscles; it inserts on to the posterior calcaneus. Achilles tendon injury may be related to trauma or secondary to overuse.23–26
On MR, the Achilles tendon has a uniform low signal with parallel anterior and posterior margins. It has a concave margin on axial images (except where the soleus inserts); on coronal images, both sides of the Achilles are straight and relatively parallel. However, the tendon widens as it extends near its insertion.1,12
The Achilles tendon has no tendon sheath. There is a paratenon that extends into the substance of the tendon. Inflammation of the paratenon results in edema in the pre-Achilles Kager fat triangle and linear, slightly increased signal intensity about the tendon.25
The Achilles enthesis at the calcaneus is intimately related to the only true anatomic bursa in the ankle, the retrocalcaneal bursa, which is filled with synovial fluid and surrounded by the Kager fat pad anteriorly.12,25 The normal retrocalcaneal bursa on MRI measures 6 mm from superior to inferior, 3 mm from medial to lateral, and 2 mm from anterior to posterior.12,27
The Achilles tendon, although is one of the strongest tendons in the body, is, somewhat surprisingly, commonly torn. The pathologic findings can be acute or chronic and range from mild peritenonitis to full-thickness tendon rupture (Figure 25-7). Achilles tendon tears likely represent a spectrum of disease, with tendinosis predisposing to partial tearing and, barring effective treatment, ultimately to complete tendon rupture. The tear usually occurs at the myotendinous junction, which 2 to 6 cm superior to its calcaneal insertion. Distal tears may occur as a result of Haglund syndrome or severe insertional tendonitis.1,12,28 Proximal tears are not uncommon, and, in reality, they are myotendinous tears of the medial head of the gastrocnemius. On axial MR images, myotendinous junction tears are manifested as focal fluid, which follows the distal margins of the muscle belly. On coronal images, tears have a U-shaped appearance because the fluid dissects down along the fascial plane of the distal muscle belly of the gastrocnemius. The tear may be complete, with focal absence of the tendon at a specific level; more commonly, the tear is partial. Incomplete tear or edema from muscle strain occurs focally in the center of the muscle.1,12,28
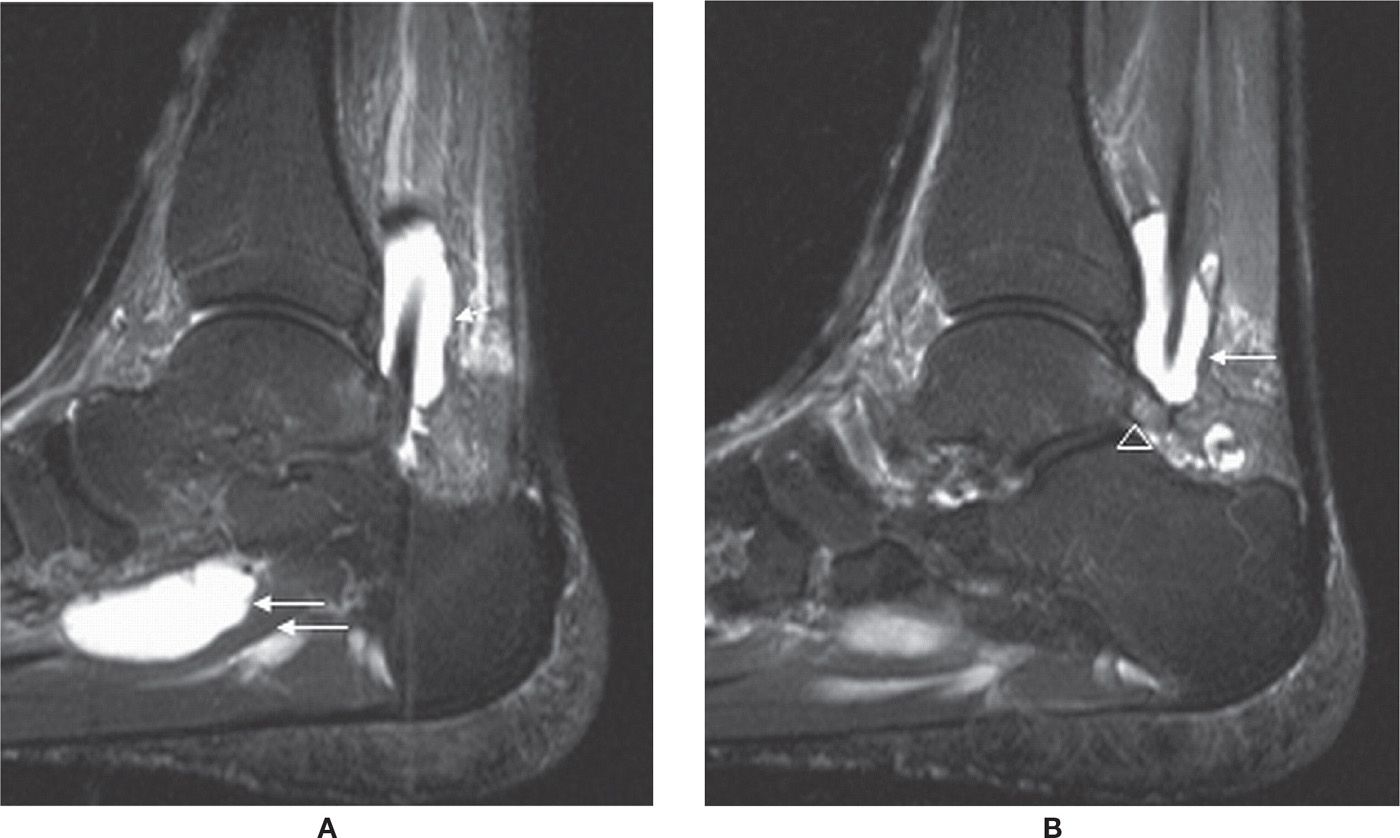
FIGURE 25-5. Stenosing tenosynovitis; sagittal PD-fat-saturation-weighted sequence (A and B). Stenosing tenosynovitis of the FHL tendon (arrows) secondary to os trigonum syndrome (arrowhead in B).
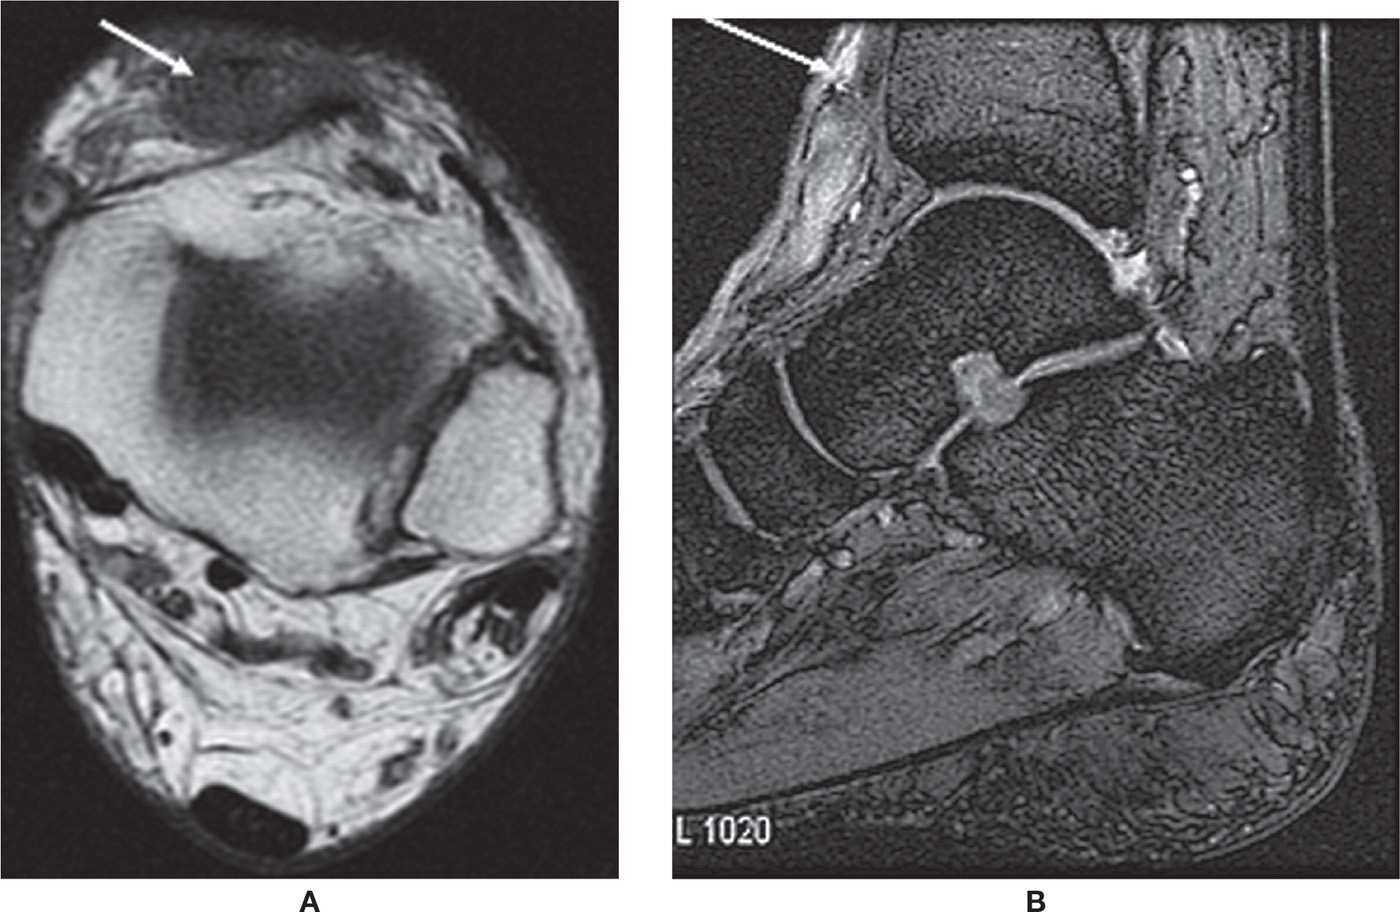
FIGURE 25-6. Ruptured TA. Axial T1-weighted sequence (A). Absence of a normal anterior tibial tendon replaced with oval-shaped mass. Sagittal MPGR-fat-saturation-weighted sequence (B). Proximal tendon retraction and fluid located in the intervening gap.
Recently, ultrasound is often used to diagnose Achilles tears. A study by Hartgerink et al.29 showed that ultrasound has a specificity of 92% in detecting full-thickness Achilles tears.
Almost all tears, interstitial, partial, or complete, show high signal on T2-weighted imaging.30
Tendon-end retraction may be seen with acute tears.12,31 Baseline MR may be important for follow-up. The torn Achilles tendon fragment ends should approximate; therefore, sagittal images should be obtained after casting. If the tendon edges are not opposed in this position, the treatment will often fail.12,32 With healing, the signal intensity returns to normal, though the thickening still persists.
Haglund disease is frequently associated with “pump” style shoes. More important than the shoe style is the presence of a stiff-heel counter, which compresses the retro-Achilles bursa against the posterior lateral calcaneal prominence.12,33 The calcaneal tuberosity may focally enlarge in response to chronic irritation.12,34 This enlargement further irritates the retro-Achilles bursa and the Achilles tendon, which increases the irritation that causes further enlargement of the tuberosity. This results in a cycle of injury, response to injury, and reinjury.12,35 MR images reveal excessive fluid in the retrocalcaneal bursa and the retro-Achilles bursa, an enlarged and possibly edematous calcaneal tuberosity, and a thickened distal Achilles tendon (Figure 25-8).
Peroneal Tendons
The peroneal brevis (PB) and peroneus longus (PL) tendons are positioned posterolaterally and function as evertors and plantar flexors as well as dynamic stabilizers of the foot and ankle. The peroneus longus muscle originates from the upper fibula and courses along the lateral aspect of the ankle before turning medially beneath the cuboid. It courses through the deep plantar aspect of the midfoot, supporting the transverse arch, before inserting onto the medial cuneiform and the base of the first metatarsal. Similar to the PTT, it lies in a fibro-osseous tunnel. The peroneus brevis originates from the lower fibular shaft and inserts onto the base of the fifth metatarsal. The tendons share a common tendon sheath and pass posterior and inferior to the lateral malleolus, where they are held in place by the superior and inferior peroneal retinacula. The tendons have a common tendon sheath proximally but have separate sheaths more distally. At the level of the lateral malleolus, the peroneus brevis lies anterior to the longus. The tendons are separated by the peroneal tubercle on the lateral aspect of the calcaneus. Normal anatomic variants may include a peroneus quartus muscle, a low-lying peroneus brevis muscle belly, or an os peroneum.
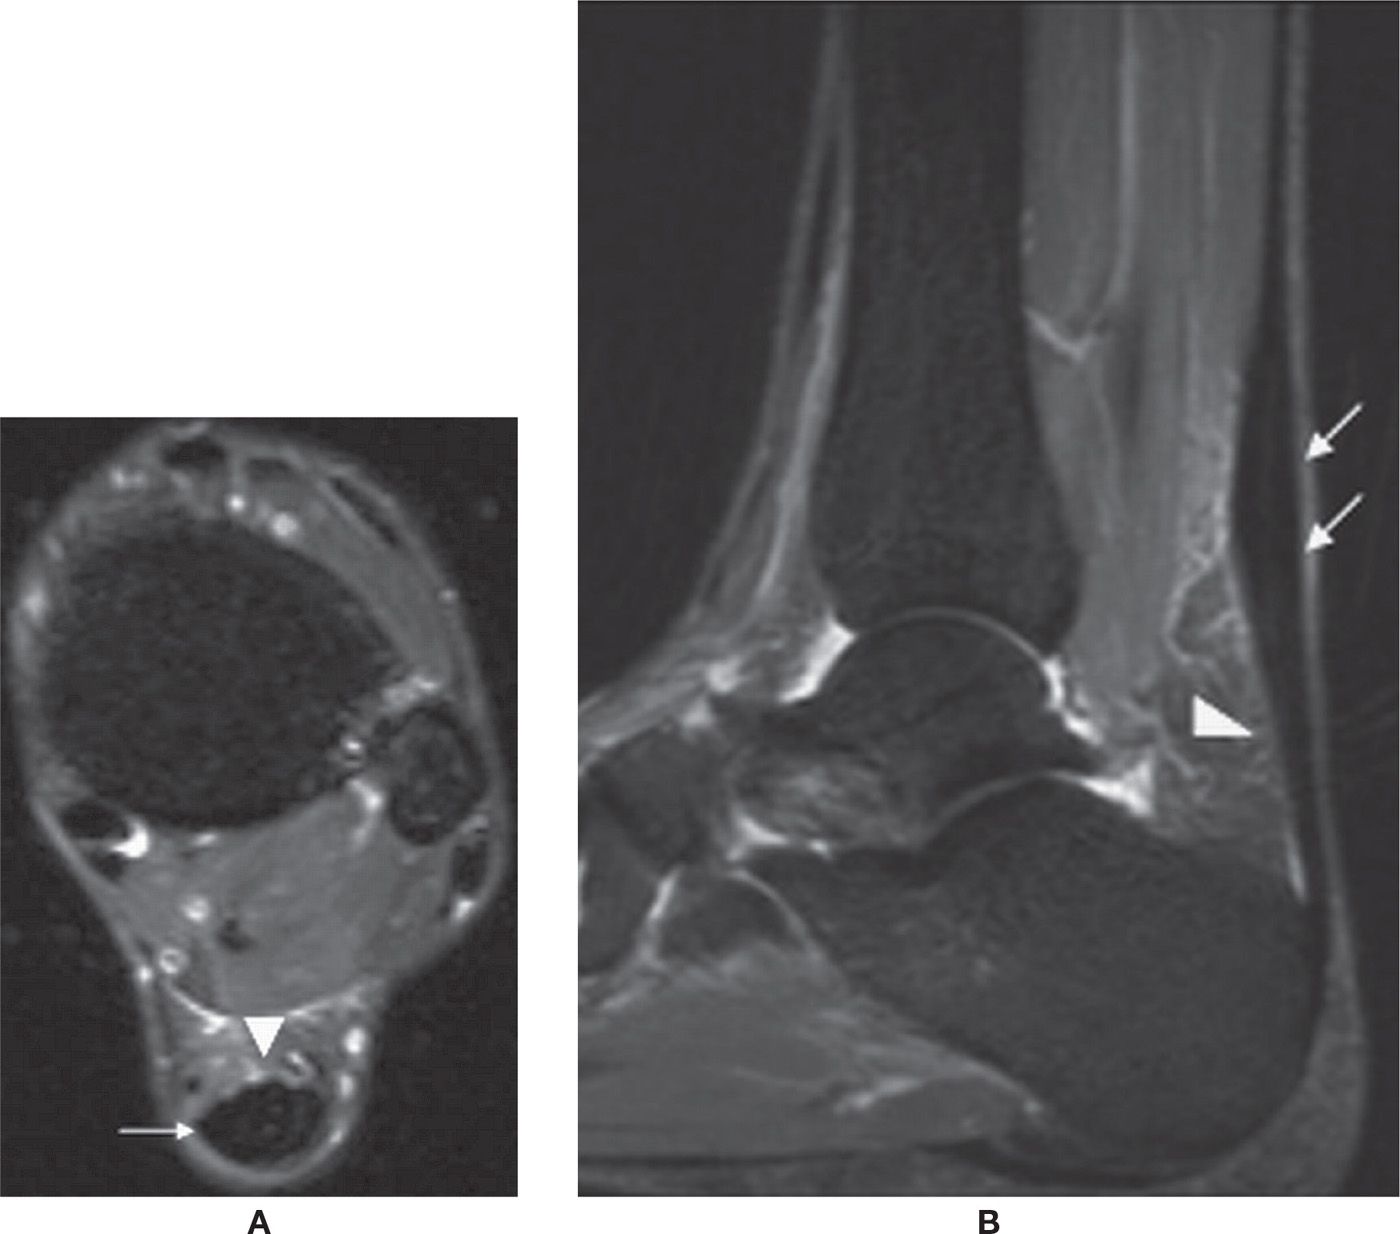
FIGURE 25-7. Achilles tendon rupture. Sagittal PD-fat-saturation-weighted sequence image shows a full-thickness tear of the Achilles tendon with a fluid-filled gap (arrows).
On MR, the peroneal tendons appear dark on all sequences. The peroneus brevis is flat and broader than the peroneus longus, which appears rounder. A C-shaped configuration of the brevis tendon is considered abnormal.
Peroneal tendon pathology can be classified as tendon degeneration and partial and full-thickness tears. They often result from overuse in athletic individuals. The peroneus brevis is more commonly affected as it passes under the lateral malleolus. Longitudinal tearing, or splitting, of the peroneus brevis tendon can be diagnosed as alteration of the peroneus brevis morphology (Figure 25-9). The tear usually starts at the tip of the lateral malleolus and can extend to variable distances proximally and distally. The partially torn peroneus brevis split appears as an inverted U shape. The partial tear can progress to a complete tear, in which case three tendinous structures would be seen posterior to the lateral malleolus, the peroneus longus tendon interposed between the split portions of the peroneus brevis tendon. A posterolateral fibular spur may be seen with peroneus brevis split. Marrow edema in the distal fibula has also been described.
Complete tear can be identified when high-signal fluid replaces the normal black tendon. Thickening and retraction of the tendon ends can be identified. Incomplete tears show thickening and variable degrees of increased signal intensity on T2-weighted images.36–40
Peroneal tenosynovitis is not uncommon. On MR, there is fluid seen within the peroneal tendon sheath with or without signal changes in the tendon.37,41 This is often the result of communication with the ankle joint following somewhat severe ankle sprains accompanied by tearing of the calcaneofibular ligament (CFL).
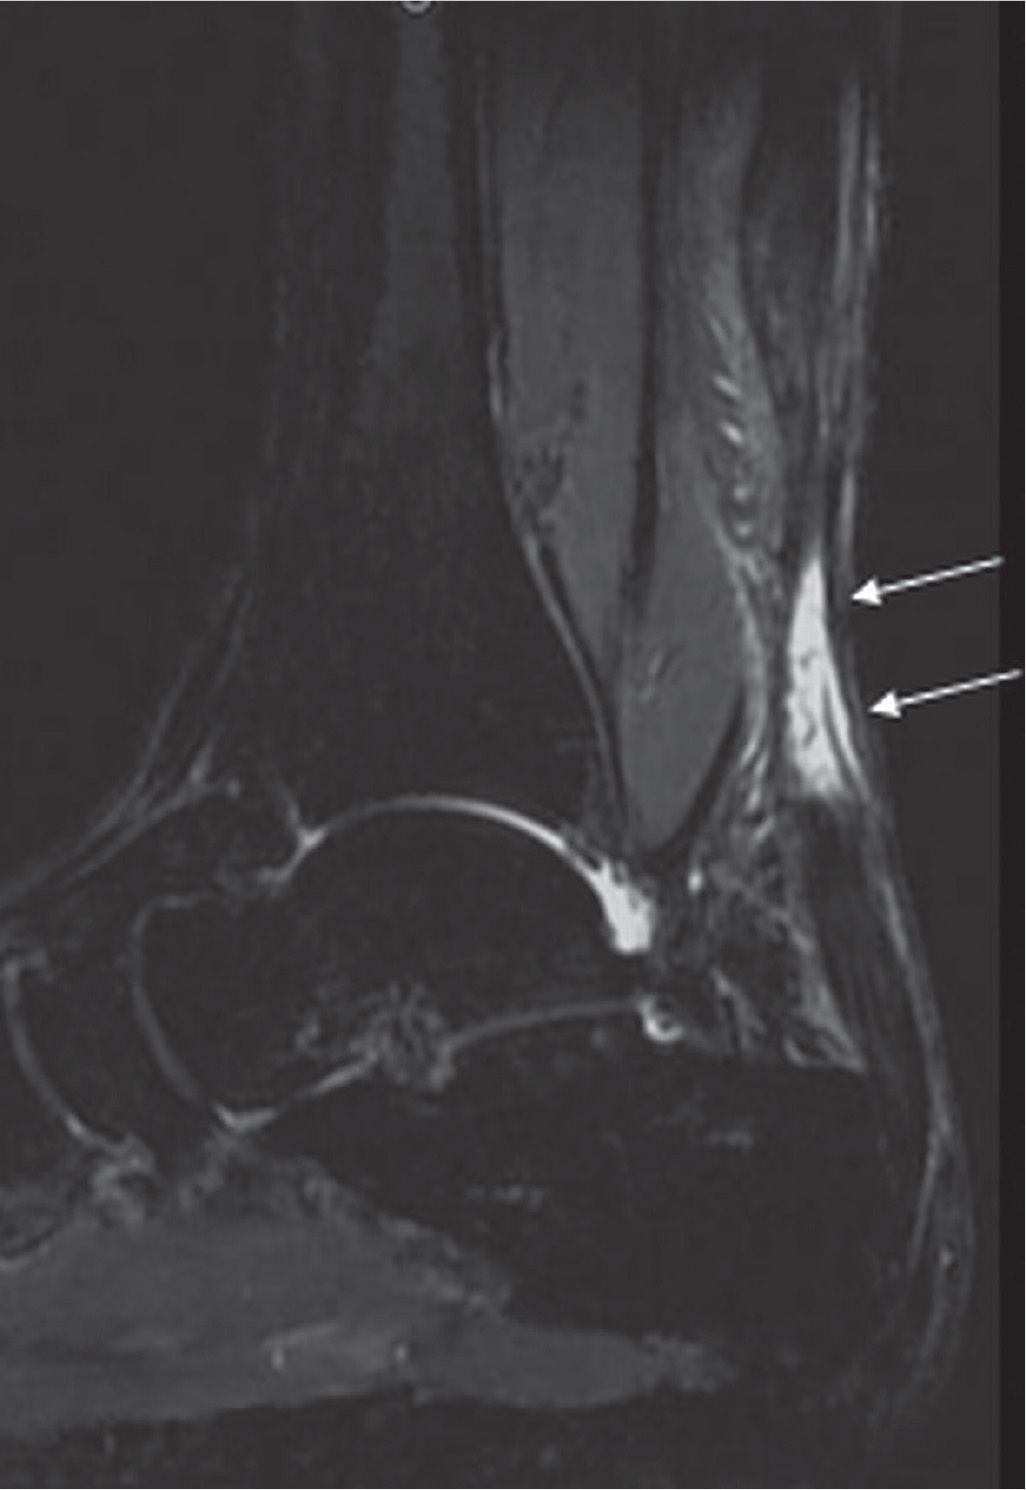
FIGURE 25-8. Achilles tendinosis. Axial (A) and sagittal (B) T2-fat-saturation-weighted sequence images show fusiform thickening of the Achilles tendon (arrows) with edema in the Kager fat pad (arrowheads) in keeping with tendinosis and paratenonitis.
The peroneal tendons may subluxate or dislocate secondary to superior retinaculum injury (Figure 25-10). Subluxation is common in basketball and soccer players, skiers, and skaters. This disorder can also occur following severe ankle sprain and in association with complex calcaneal fracture. The retinaculum injury occurs from a forced inversion injury with plantar flexion. This is best assessed on T2-weighted axial images, which show the tendons lateral to the lateral malleolus.36,41–45
Ultrasound can also be utilized to demonstrate peroneal tendon pathology as well as subluxation/dislocation.46
LIGAMENTS
Ligaments connect bone structures with characteristic low-signal intensity on MRI sequences. They are variably shaped, from flat to more cord-like (calcaneofibular ligament) or even “fan shaped” (Figure 25-11). When fat is interposed between the fibers they may have intermediate or heterogeneous signal intensity (e.g., the anterior tibiofibular, posterior talofibular, and deep tibiotalar ligaments).9
Injury may lead to ligament elongation without macroscopic tear, provoke a partial tear (which is characterized as rupture of a fraction of the ligament section), or cause a complete tear. Alternatively, the ligament may resist mechanical stress but result in avulsion of the bone insertion. Clinically, tears are frequently divided by grades: grade I tears are mild strains without mechanical instability; grade II tears are partial sprains with mild-to-moderate instability; and, grade III tears are full-thickness tears with instability, the inability to bear weight, and severe pain.47
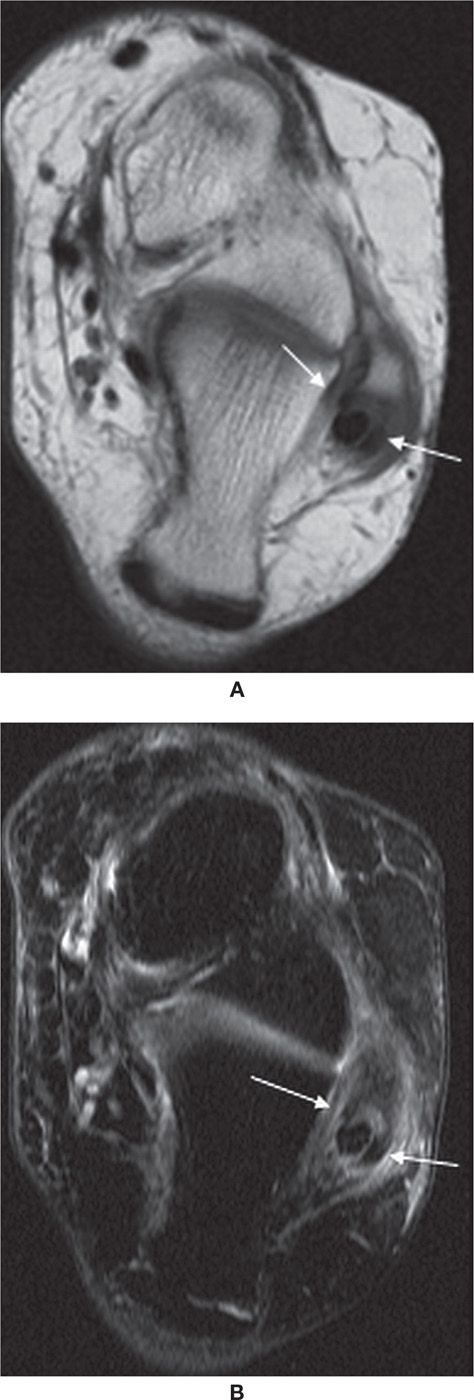
FIGURE 25-9. Split peroneus brevis tendon. Axial T1- (A) and axial T2-fat-saturation- (B) weighted sequences. Peroneus longus lies between the two components of the split peroneus brevis tendon (arrows).
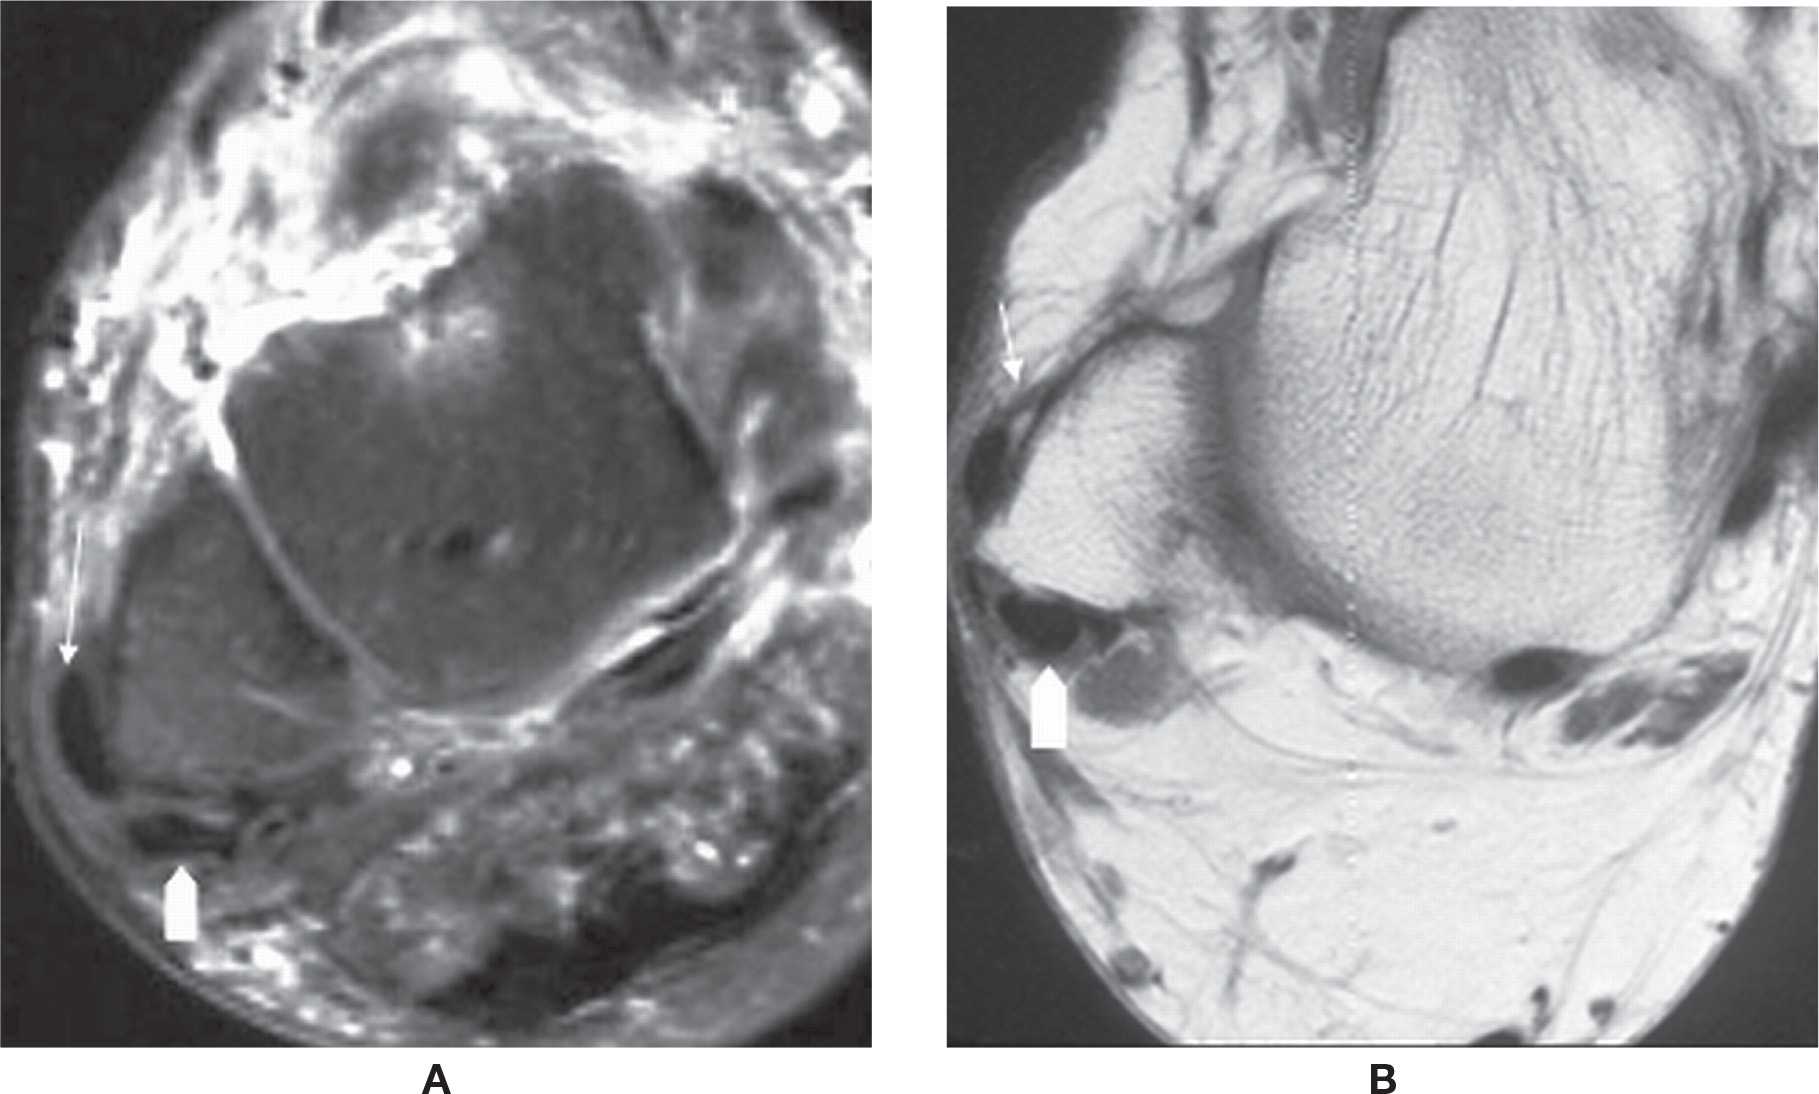
FIGURE 25-10. Peroneus brevis tendon dislocation. Axial T2-fat-saturation- (A) and T1- (B) weighted sequence images show dislocation of peroneus brevis tendon (straight arrow). The peroneus longus tendon remained in groove (arrowhead).
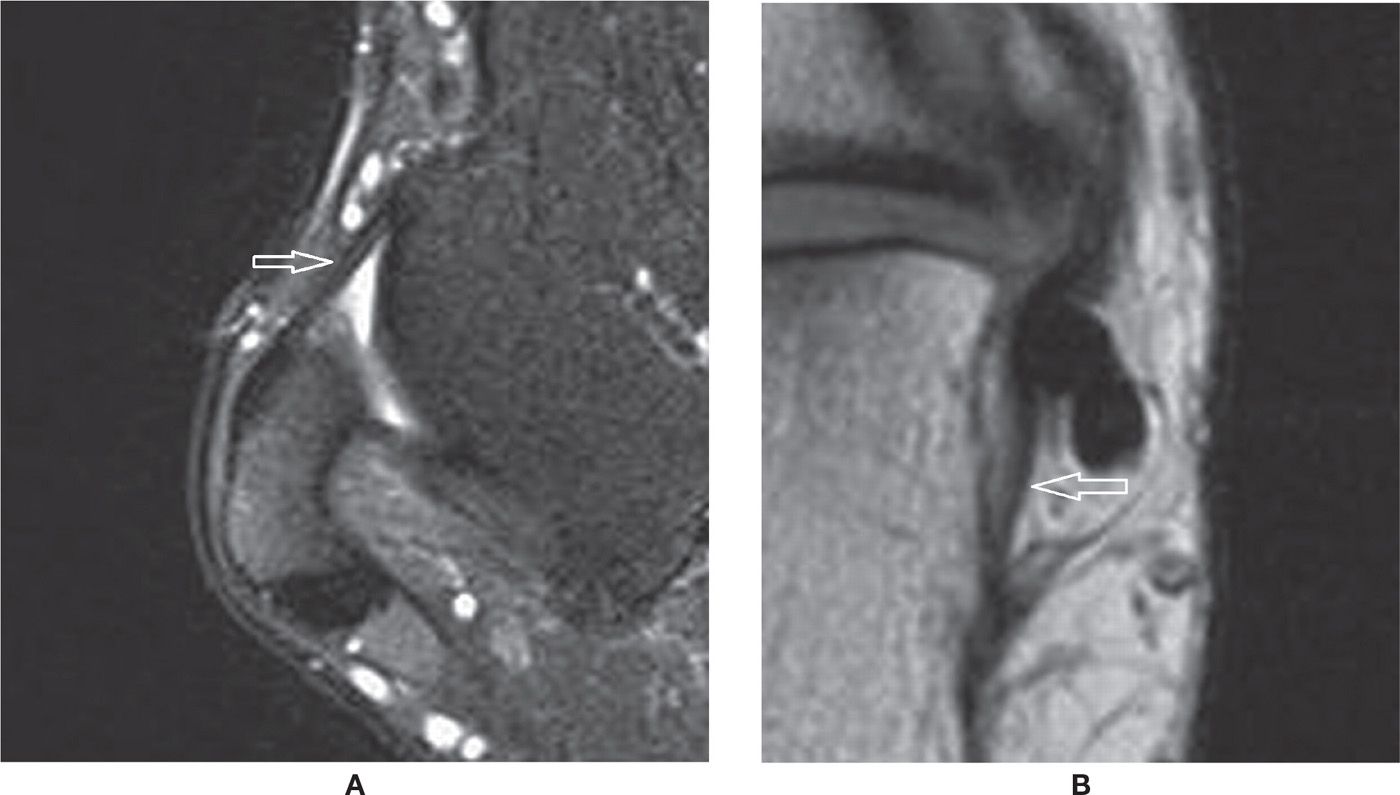
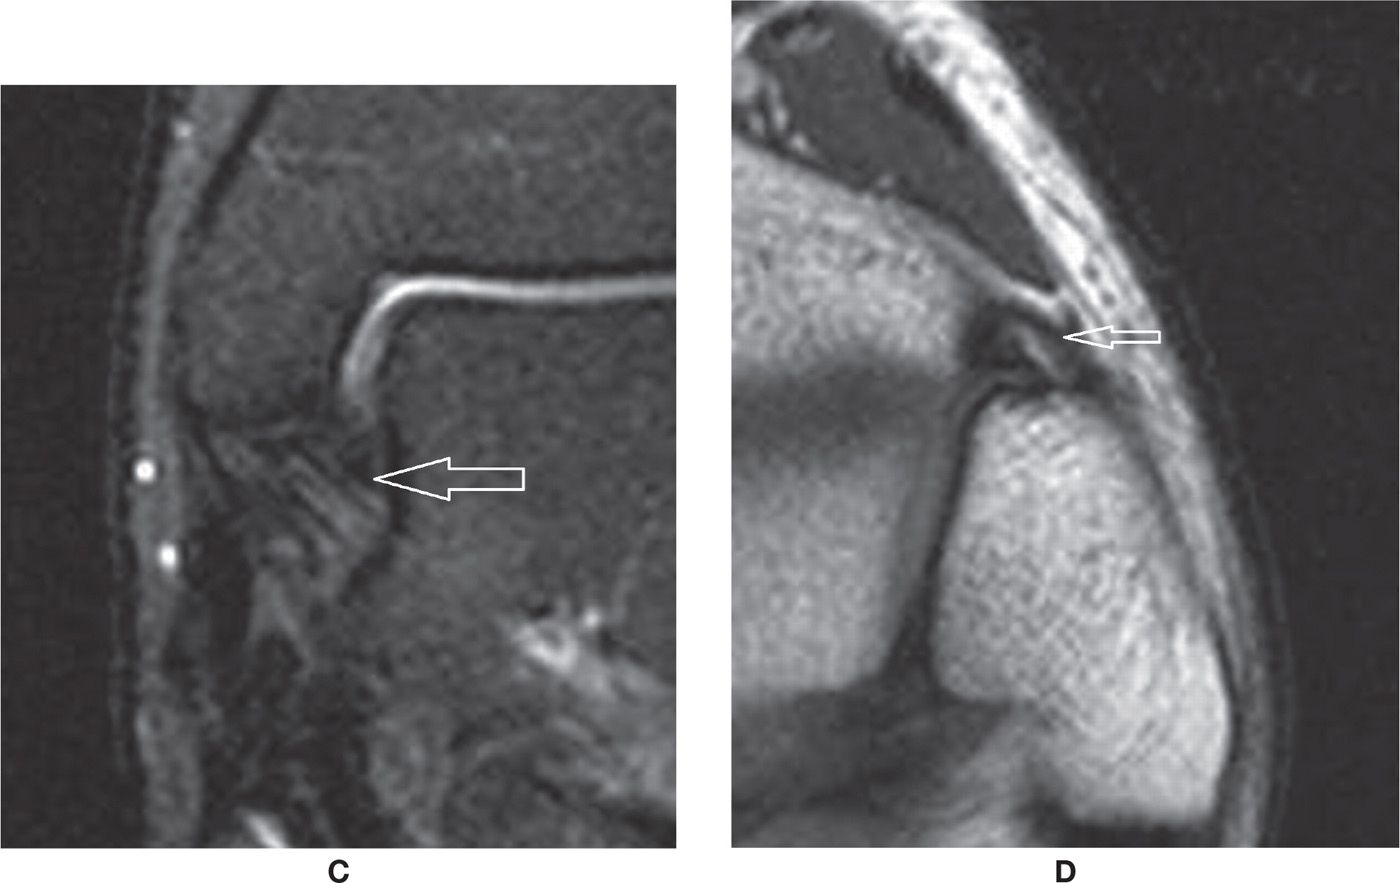
FIGURE 25-11. Normal characteristics of ankle ligaments. A: Anterior and posterior talofibular ligaments (axial T2-fat-saturation-weighted sequence)—note the “fan-shaped” aspect of the posterior talofibular ligament. B: Calcaneofibular ligament (axial oblique PD-weighted sequence). C: Deep tibiotalar ligament (coronal T2-fat-saturation-weighted sequence)—note the normal “fan-shaped” aspect. D: Anterior tibiofibular ligament (axial oblique PD-weighted sequence). This ligament may also present with a “fan-shaped” aspect.
In the acute injury, surrounding edema and mild signal change may represent mild sprain; moderate sprain demonstrates additional thickening or thinning, indicating partial disruption (Figure 25-12A); and there is visible discontinuity of fibers in the severe sprain (Figure 25-12B). Joint fluid may extend through the gap of a completely torn ligament. After the injury scar tissue develops, but unfortunately it does not properly reconstitute the original tissue, resulting in a less mechanically effective tissue.9 As a consequence, the new tissue will be more prone to reinjury, and its mechanical sufficiency will be only partial, which may also lead to chronic instability of the joint.
The chronically injured ligament may differ from the original with or without surrounding soft tissues signal changes. It may become thickened, undulated, uneven, thinned, or even absent. The changes may also be represented by abnormal signal within a given ligament. The correlation with clinical evidence of insufficiency is relevant to determine if the observed ligamentous/scar tissue is mechanically effective. Other times, surrounding scar tissue or synovial proliferation may result in bulky tissue that becomes interposed in a joint and limit its range of motion, causing local impingement syndrome (e.g., anterolateral impingement related to scarring of the anterior talofibular ligament [ATFL]) (Figure 25-12C).9
CT images, particularly thin acquisitions with multiplanar reformats ranging from 0.5 to 2 mm, may eventually demonstrate a normal ligament as a thin moderate-to-high density structure. Thickening and obliteration of surrounding fat planes can suggest ligament injury, although these findings are not specific.
Lateral Complex Ligaments
The anterior talofibular ligament, calcaneofibular ligament, and posterior talofibular ligament (PTFL) comprise the lateral ligamentous complex; the frequency of injury respects the same order. The anterior talofibular ligament has two bundles with low signal measuring 2 to 3 mm in width, seen in axial MRI images. It is classically the first ligament to be injured by the ankle inversion mechanism9,47,48 (Figures 25-11A and 25-12B). The calcaneofibular ligament is the next ligament involved, and, as consequence of injury, may lose its oval shape and low signal characteristic. It is better characterized in both axial and coronal MRI images, or particularly well on axial oblique acquisitions (Figure 25-11B). Fluid in the sheath of the peroneal tendons and obliteration of the surrounding fat may help to detect a tear (Figure 25-12A). The PTFL is less frequently injured and it is well seen in axial MRI images. Its usual fascicular appearance with fan shaped insertion in the fibula should not be mistaken for injury9 (Figures 25-11A and 25-12B).
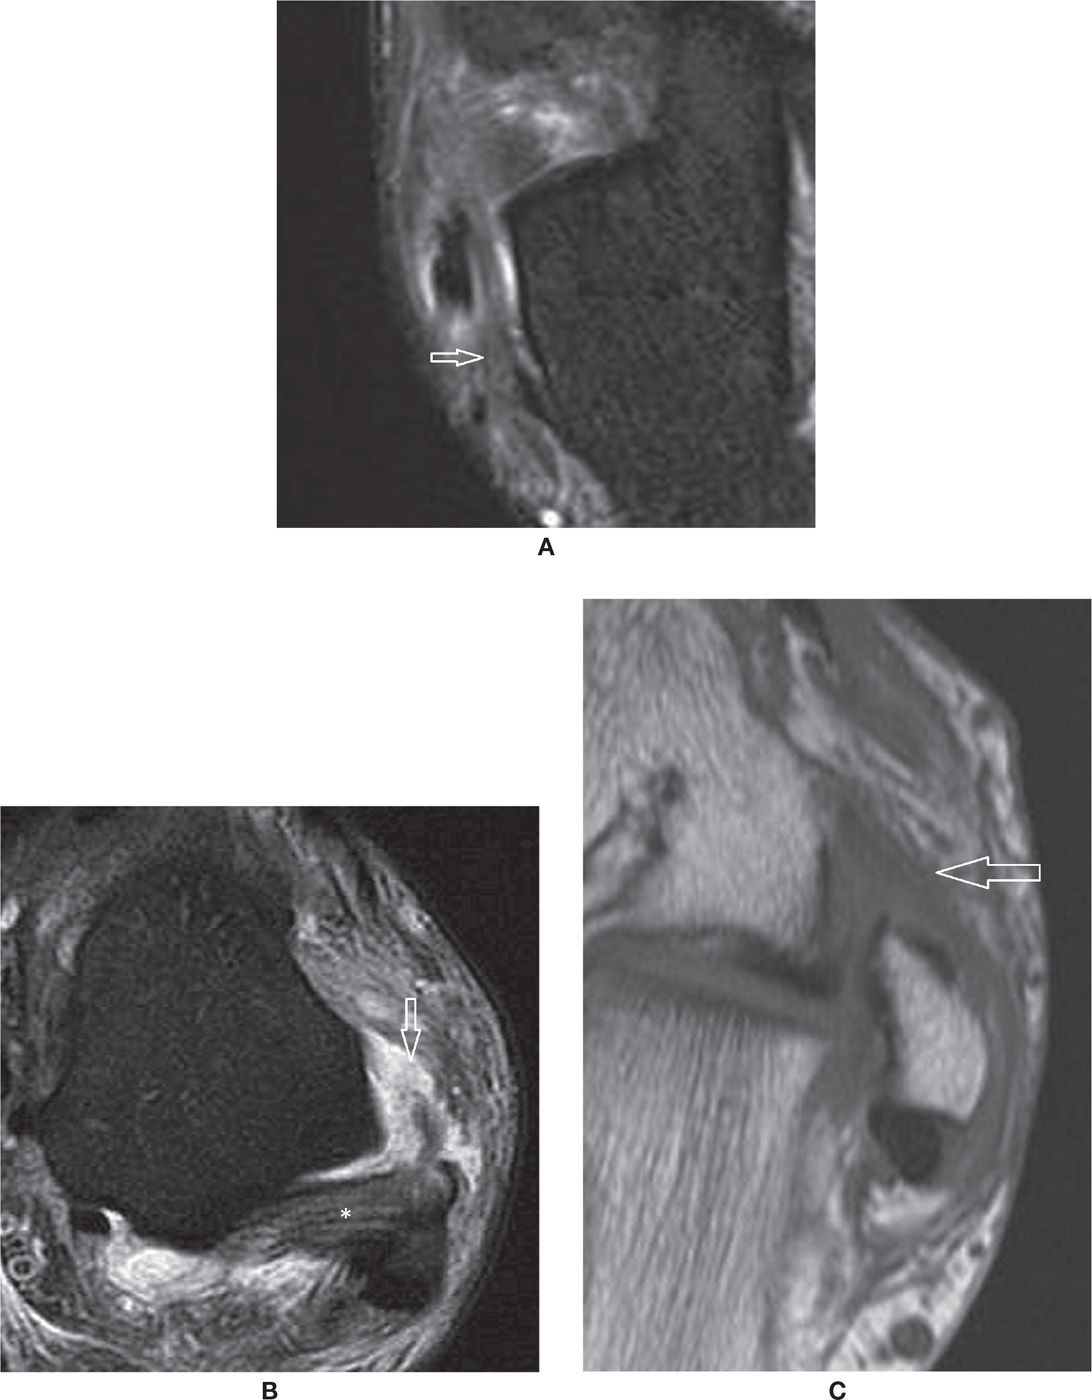
FIGURE 25-12. Ligament injuries – (A) Acute sprain of the calcaneofibular ligament with thickening, intrinsic and surrounding signal changes (Axial PD fat sat weighted sequence); (B) Full thickness tear of the anterior talofibular ligament. Note the joint fluid extending through the ruptured fibers. The posterior talofibular ligament (*) is preserved (Axial PD fat sat weighted sequence); (C) Chronic scar changes within the anterior talofibular ligament in a patient with antero-lateral impingement syndrome (Axial T1 weighted sequence).
Tibiofibular Ligaments
The distal tibiofibular syndesmosis is composed of the interosseous membrane and the anterior and posterior tibiofibular ligaments. These ligaments are striated, and there is fat interposed between the fascicles. The anterior tibiofibular ligament extends from the anterior distal margin of the tibia to the fibula in a downward oblique fashion as it goes from the tibial to the fibular insertion (Figures 25-11D and 25-13). Scar changes after a tear of the anterior talofibular ligament may also result in anterolateral impingement.9
Medial Complex Ligaments
The deep tibiotalar ligaments, with anterior and posterior bundles, have a fan shape and striated appearance with interposed fat, better seen in the axial and coronal images (Figure 25-11C). It may be amenable to disruption in ankle eversion mechanisms of injury or to contusion in foot inversions.9,47 In both situations, acute increased intraligamentous and surrounding edema and then chronically diffuse signal changes, sometimes with loss of the characteristic intrinsic fat and eventual thickening, can be observed (Figure 25-14).
The superficial tibiotalar ligament components are named accordingly to its distal insertion: tibionavicular (the more anterior fibers), tibiospring (the intermediate fibers, insert at the medial margin of the spring ligament), and tibiocalcaneal (the more vertical and posterior fibers) insert on the sustentaculum tali. These components have a laminar aspect of low signal when preserved (Figure 25-15).
Spring Ligament
The plantar calcaneonavicular, spring or glenoid ligament has three bundles that are inconsistently visualized by MRI. The most important is the superomedial component, extending from the sustentaculum tali to a fanlike insertion at the inferomedial margin of the navicular. There are also the medioplantar and the inferolongitudinal components.48,49 The spring ligament is an important stabilizer of the talus and may be torn or insufficient in association with flatfoot deformity, medial subluxation, and verticalization of the talus. Fluid extending through the superomedial component has been found to be the most specific finding of a tear. The conjunction of the following findings—thickening or thinning, signal changes, fluid about the PTT, waviness and, if present, a visible tear of the ligament—have been found to be the more frequent findings in surgically proven tears (Figure 25-16).48 The injuries are usually due to chronic microtrauma/stress rather than an acute mechanism. Note that the fibers of the tibiospring component of the medial ligament complex are indistinct individually from the spring ligament. It should also be noted that the vast majority of spring ligament tears are seen with the later stages of PTT insufficiency.
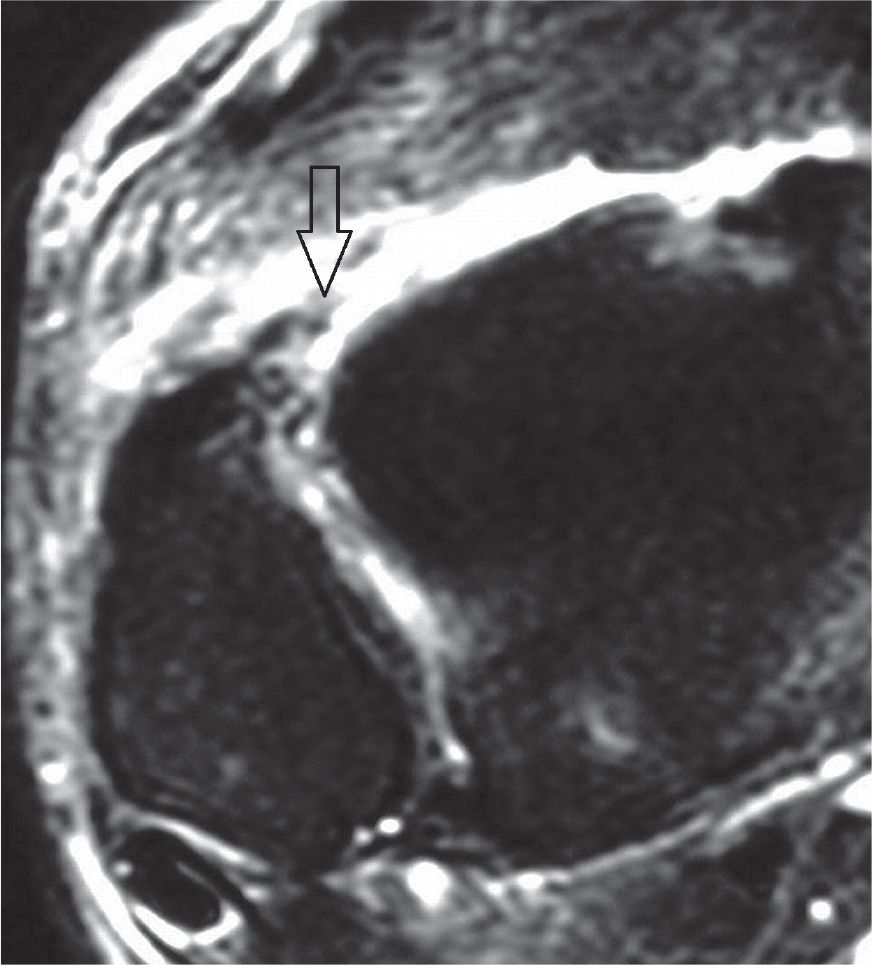
FIGURE 25-13. Acute full-thickness tear of the anterior tibiofibular ligament (T2-fat-saturation-weighted sequence).
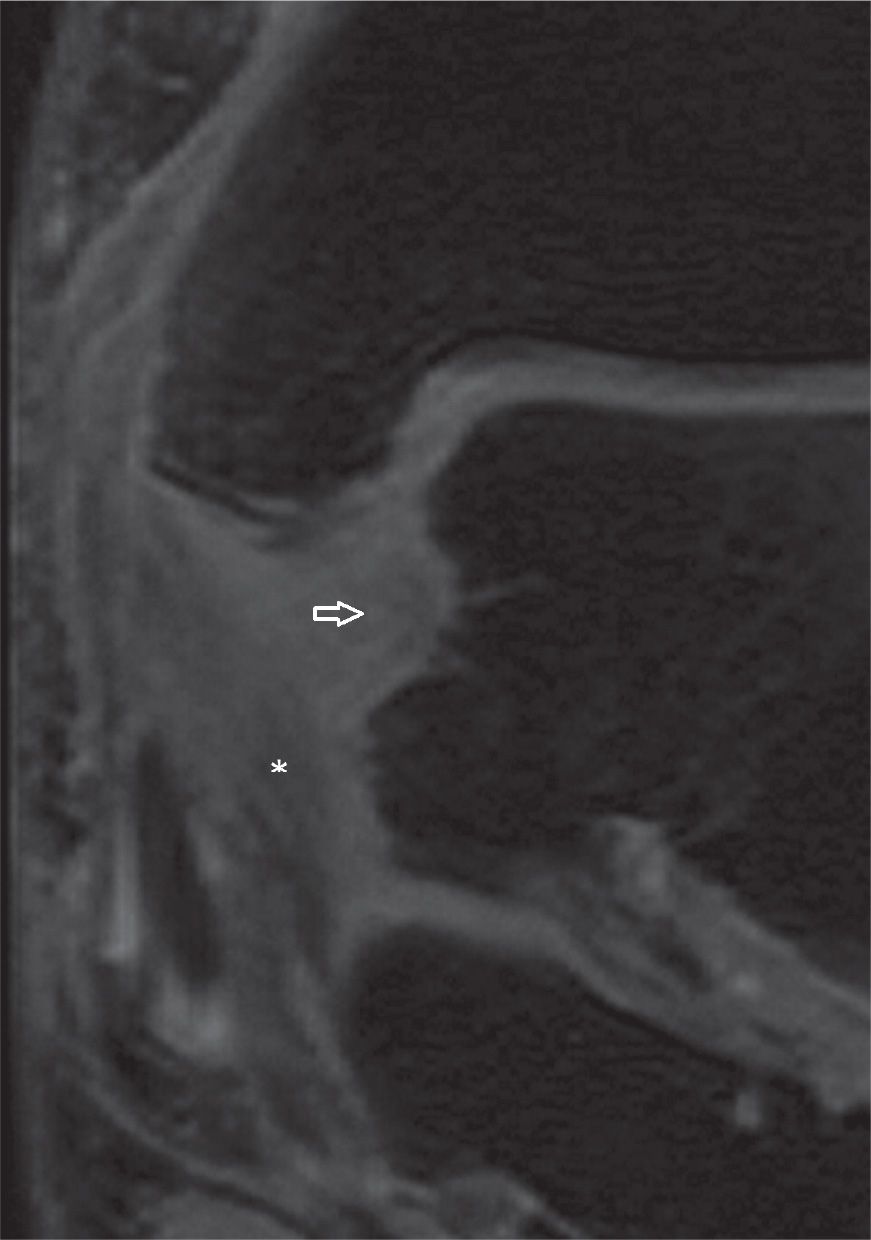
FIGURE 25-14. Injuries of the deep tibiotalar (arrow) and tibiocalcaneal (*) components of the medial collateral ligament complex with thickening, increased signal and loss of “fan shaped” pattern of the deep component (Coronal T2 weighted sequence with fat saturation).
Lisfranc Ligament
This is the most important ligament of the midfoot, extending from the lateral aspect of the medial cuneiform to the lateral base of the second metatarsal. Sprain, tear, or avulsion may be observed associated with or without micro or major instability of the Lisfranc joint. The ligament is well characterized in MRI, particularly well in double oblique coronal acquisitions, parallel to the metatarsals (Figure 25-17).50 Specific note should be made of this ligament in all diabetic patients.
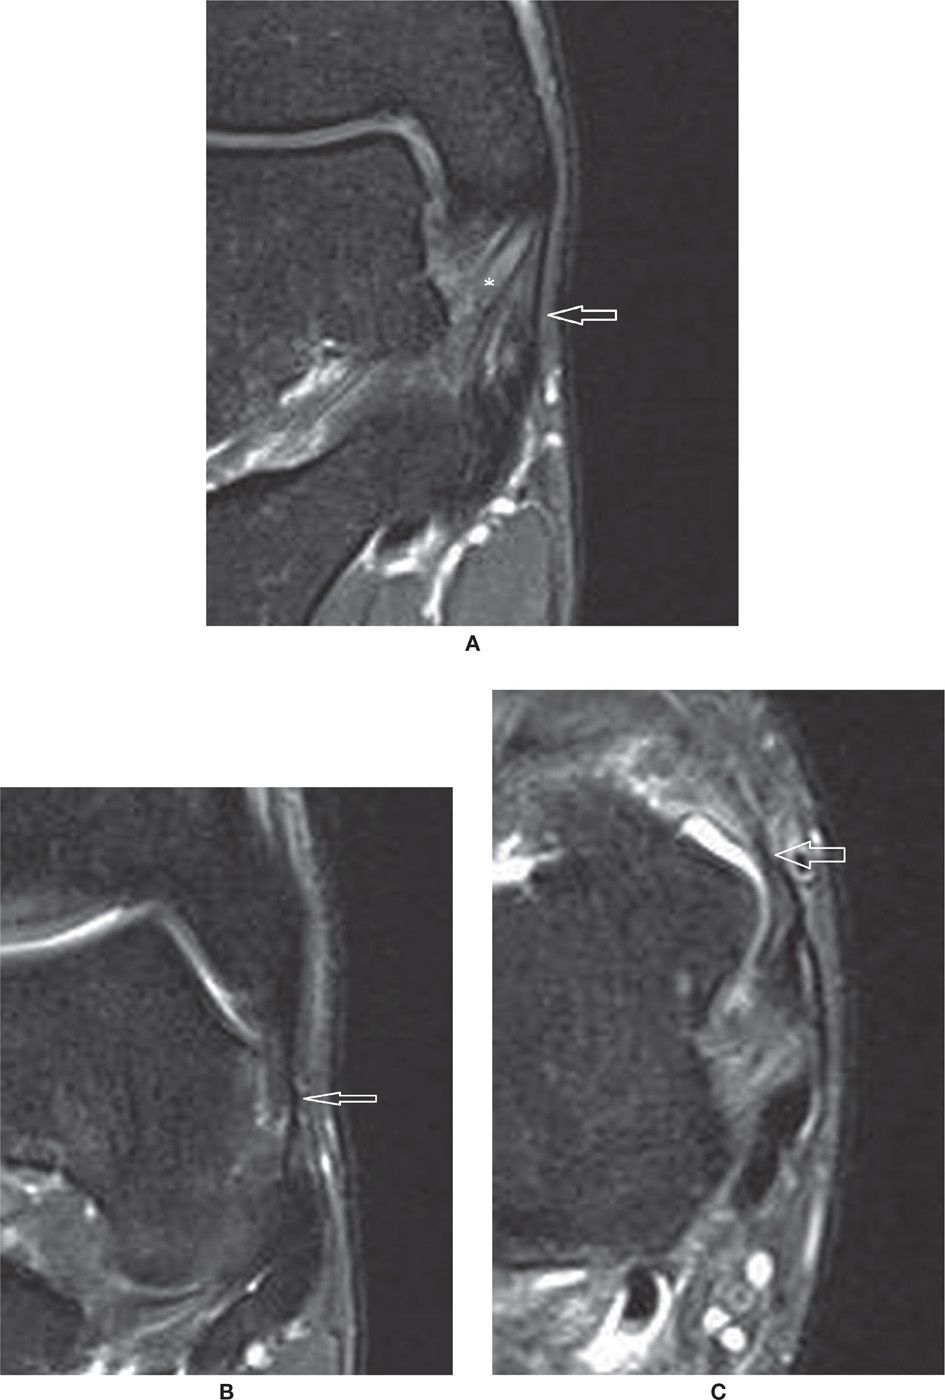
FIGURE 25-15. Normal superficial components of the medial collateral ligament complex. (A) Tibiocalcaneal component (arrow). Also note the deep tibiotalar component (*) with characteristic pattern (Coronal PD weighted sequence with fat saturation). (B and C) Anterior components of the superficial layer of the deltoid ligament – tibionavicular and tibiospring components (in B Coronal PD weighted sequence with fat saturation and in (C) Axial PD weighted sequence with fat saturation).
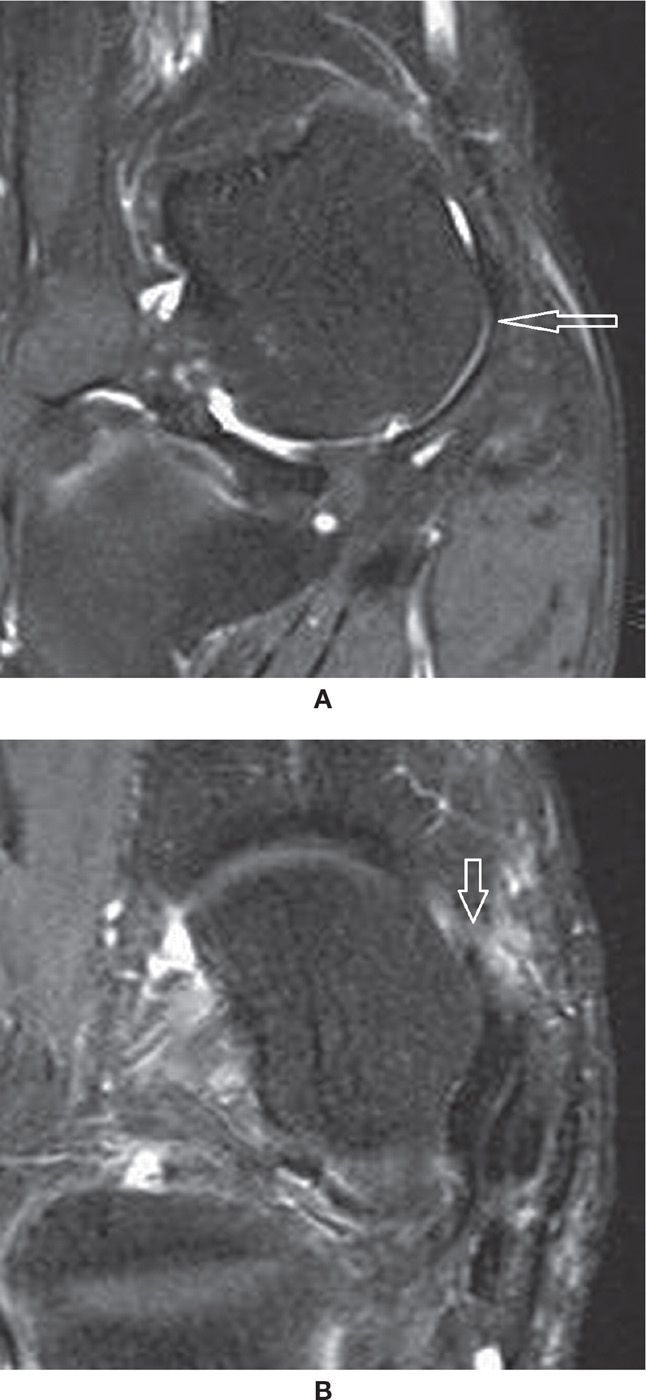
FIGURE 25-16. (A) Normal superomedial component of the spring ligament (arrow) articulating with the talar head. Note the small deep chondral defect (Coronal PD fat sat weighted sequence); (B) – Tear of the superomedial component of the spring ligament (Axial PD fat sat weighted sequence). There are post-operative changes after posterior tibialis tendon repair. There is a small perforation at the anterosuperior margin of the ligament (arrow) adjacent to the navicular.
Bifurcate Ligament
The medial calcaneocuboid bundle and the lateral inferior calcaneonavicular bundle comprise this ligament, with a common origin at the anterior process of the calcaneus. Tear or bone avulsion may be observed with lateral pain after inversion injury. Sometimes nonunion of the avulsed fragment can be identified in a remote imaging study, often in association with calcaneonavicular coalition or with severe ankle sprain (Figure 25-18).51
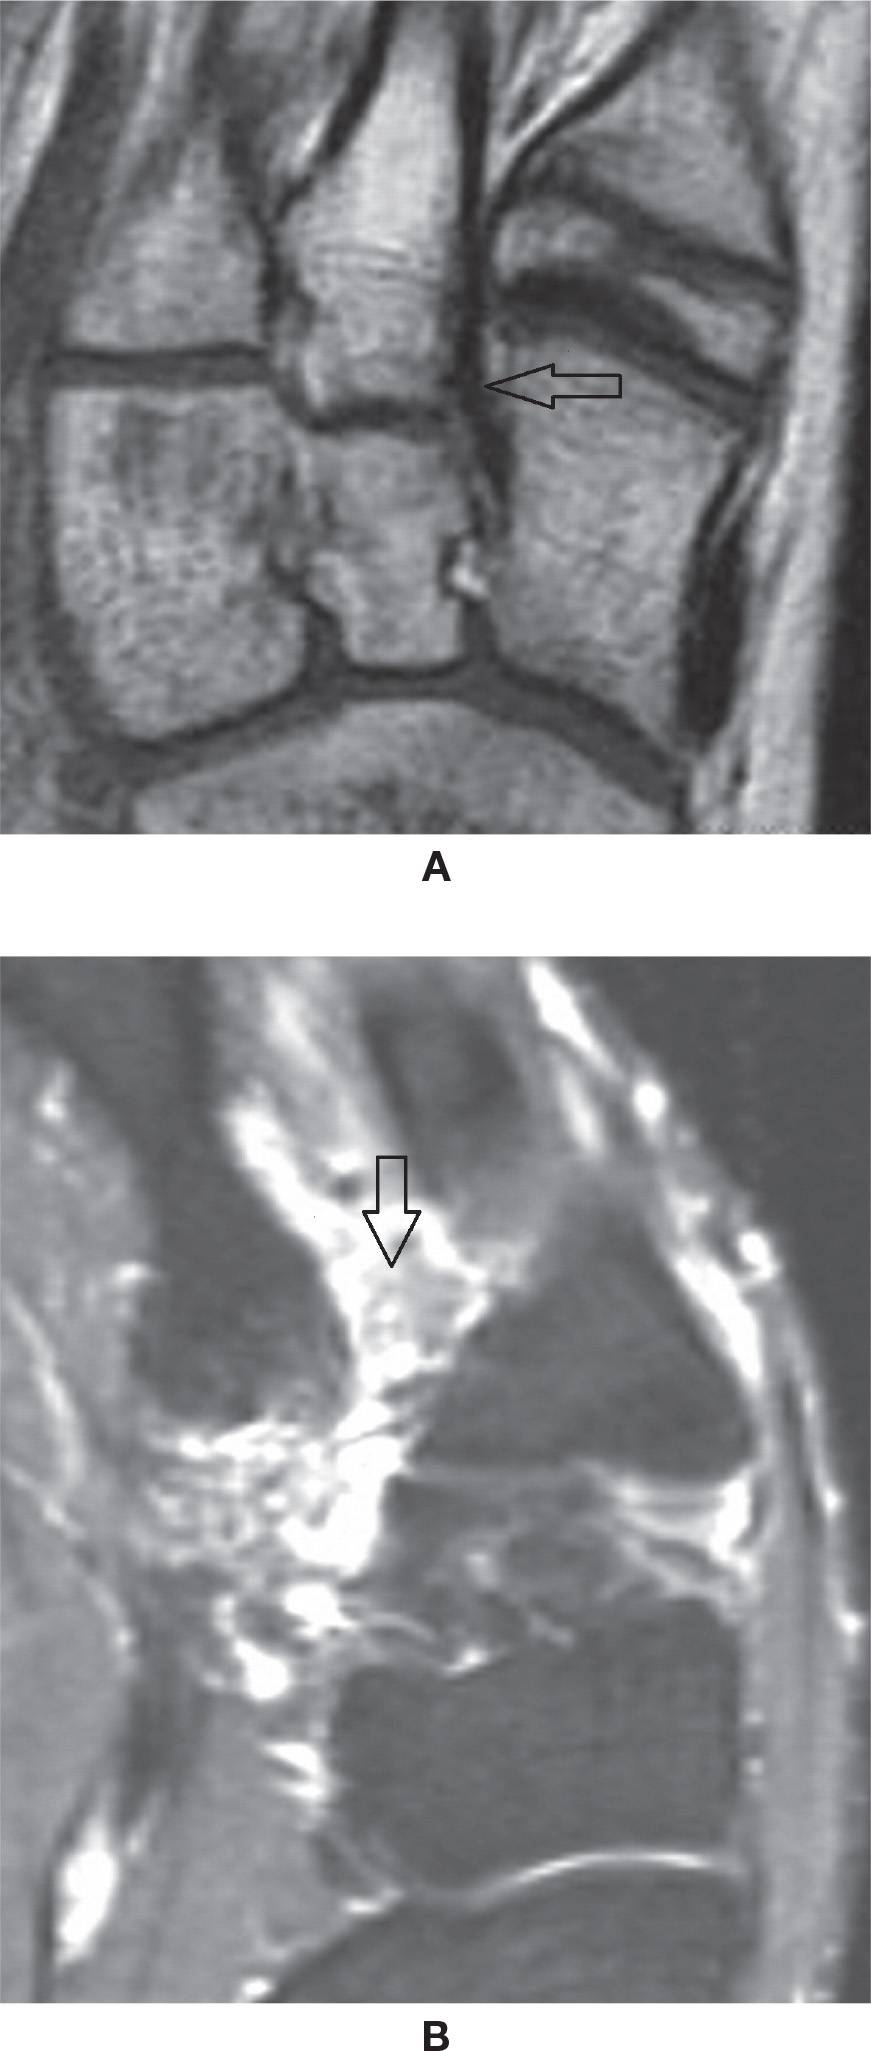
FIGURE 25-17. Lisfranc ligament. A: Normal aspect (axial oblique T1-weighted sequence). B: Full-thickness tear (axial oblique T2-weighted sequence with fat saturation).
PLANTAR FASCIA
The plantar fascia or aponeurosis is divided into three main bands, lateral, central, and medial, with origin at the plantar aspect of the calcaneus tuberosity. The central portion origin is superficial and posterior to the origin of the flexor digitorum brevis muscle at the medial process of the calcaneal tuberosity, with 3 to 4 mm of thickness; distally it extends to approximately the level of the metatarsophalangeal joints, blending with the skin and also with the sheaths of the flexor tendons and transverse metatarsal ligaments. The lateral band extends to the base of the fifth metatarsal, superficial to the abductor digiti quinti muscle; the medial band is thinner, extending through the superficial aspect of the abductor hallux muscle. The plantar fat pad is superficial to the plantar fascia; the deep margin is in contact with the superficial layer of intrinsic muscles of the foot. Like all fascia, the plantar fascia is of low signal in all sequences52,53 (Figure 25-19).
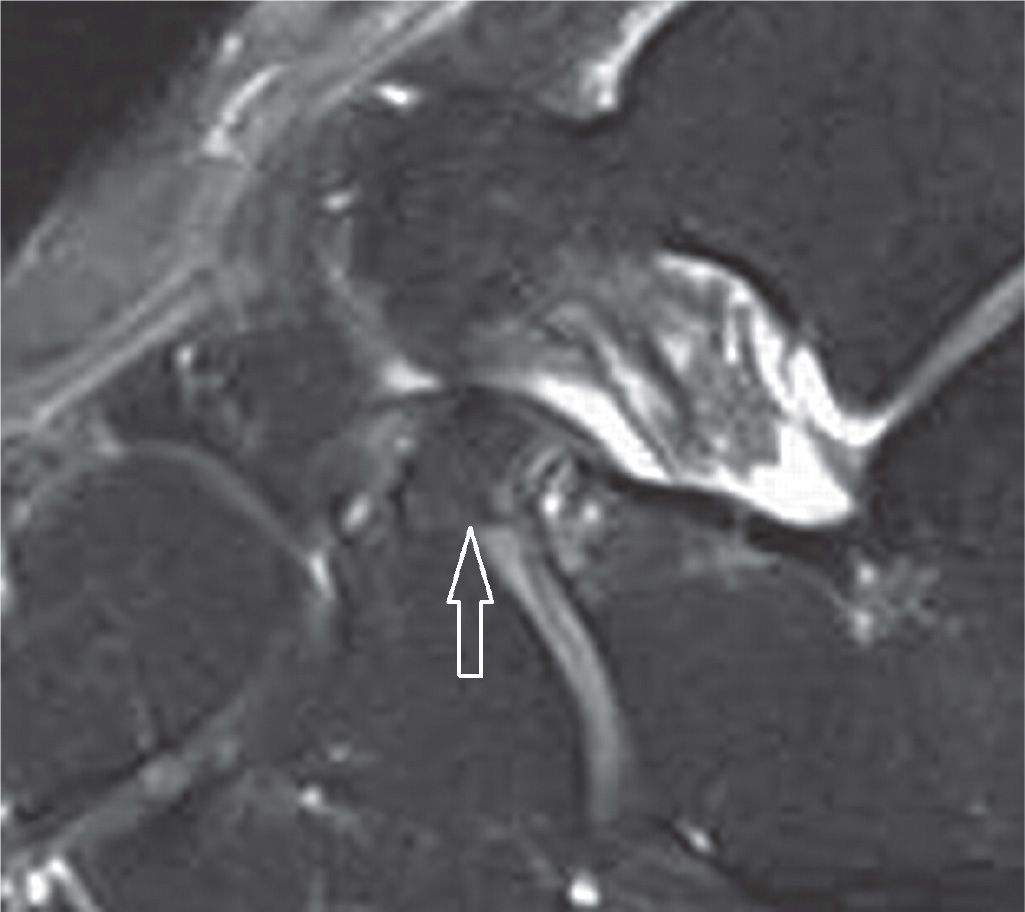
FIGURE 25-18. Bone fragment of the anterior process of the calcaneus secondary to avulsion by the bifurcate ligament insertion. The navicular and cuboid components are observed (sagittal PD-weighted sequence with fat saturation).
Plantar Fasciitis
Increased biomechanical overload can lead to microtear of the plantar fascia, resulting in thickening and variable increased signal intensity on several MRI sequences. This thickening is fusiform and usually observed at the proximal aspect adjacent to its origin; it typically involves the central band. Associated perifascial edema and calcaneal bone marrow edema can also be observed (Figure 25-20A); the latter has been associated with night pain. Thickening is prominent with chronic fasciitis, with or without intrinsic or surrounding edema (Figure 25-20B).52,53
A plantar calcaneal bony excrescence (enthesophyte or spur) is frequently associated with plantar fasciitis. This is mostly observed above the insertion of the fascia, closer to where the long plantar ligament originates, rather than in the insertion of the fascia itself. Pain should not be attributed to this bony protuberance but to the associated plantar fasciitis (Figures 25-21 and 25-22A).54
Possible complications may be associated with plantar fasciitis, including rupture of the fascia. This occurs often after an episode of traumatic stretching, such as a sudden dorsiflexion of the foot, stepping on a convex surface, or continued overuse. The rupture may be partial, not involving the full thickness of the fascia, or it may involve its full thickness with a visible gap53,55 (Figure 25-22). Partial loss of the arch of the foot may result from these fascial tears.
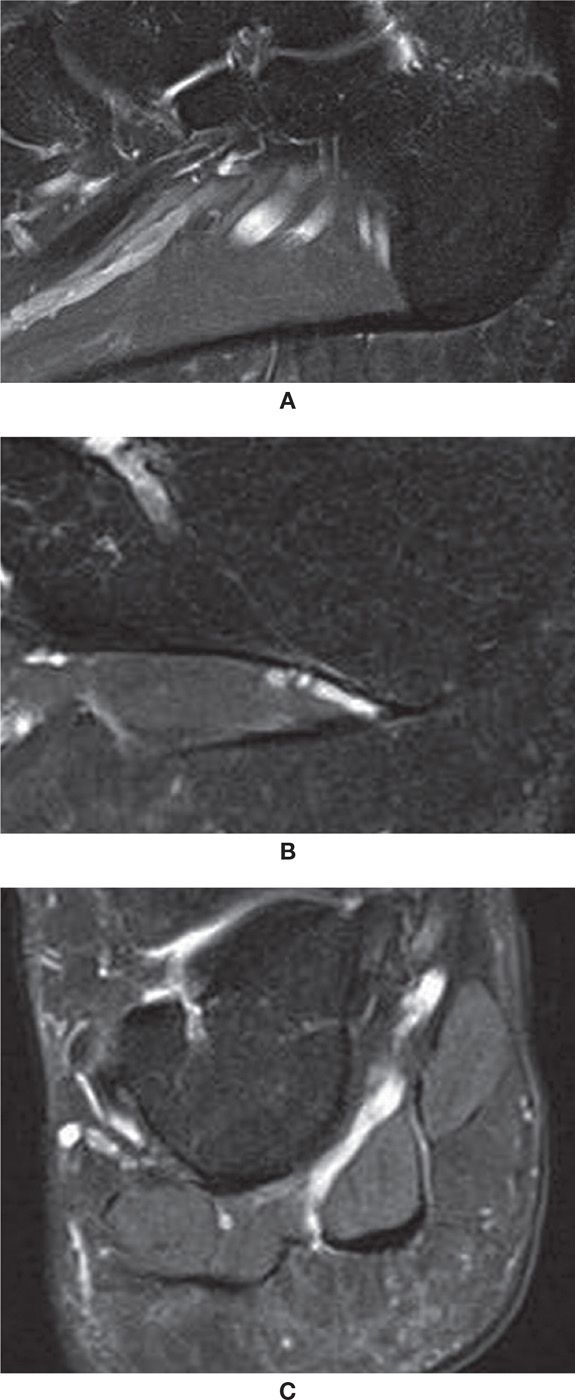
FIGURE 25-19. Plantar fascia; sagittal PD-weighted sequence fat saturation images. A: Central band origin. B: Lateral band origin. Note adjacent neurovascular bundle. C: Coronal PD-weighted sequence fat saturation with the lateral, central, and medial components of the plantar fascia. Observe the intimate relation with the adjacent superficial plantar muscles of the foot.
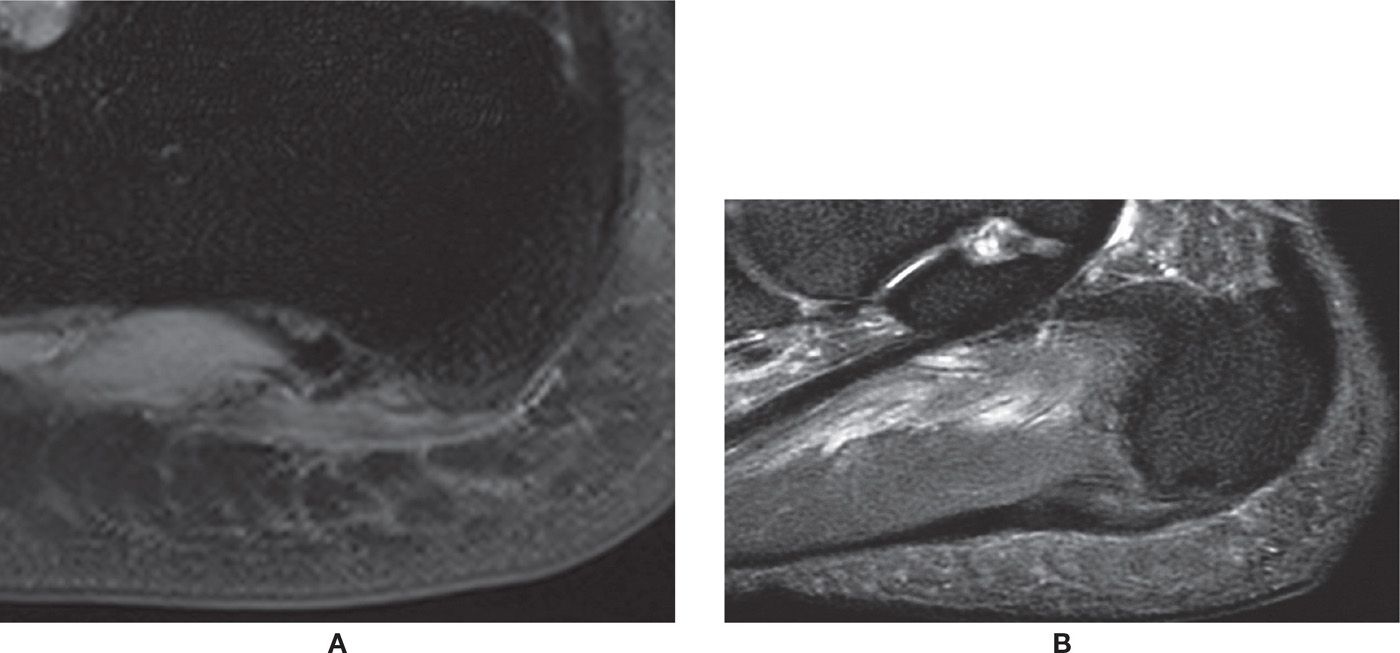
FIGURE 25-20. Plantar fasciitis. A: Plantar fascia thickening, signal change, and subtle edema of the surrounding soft tissues and bone marrow (sagittal PD-weighted sequence fat saturation). B: Chronic changes. Thickening and signal change of the plantar fascia without remarkable surrounding edema (sagittal PD-weighted sequence with fat saturation).
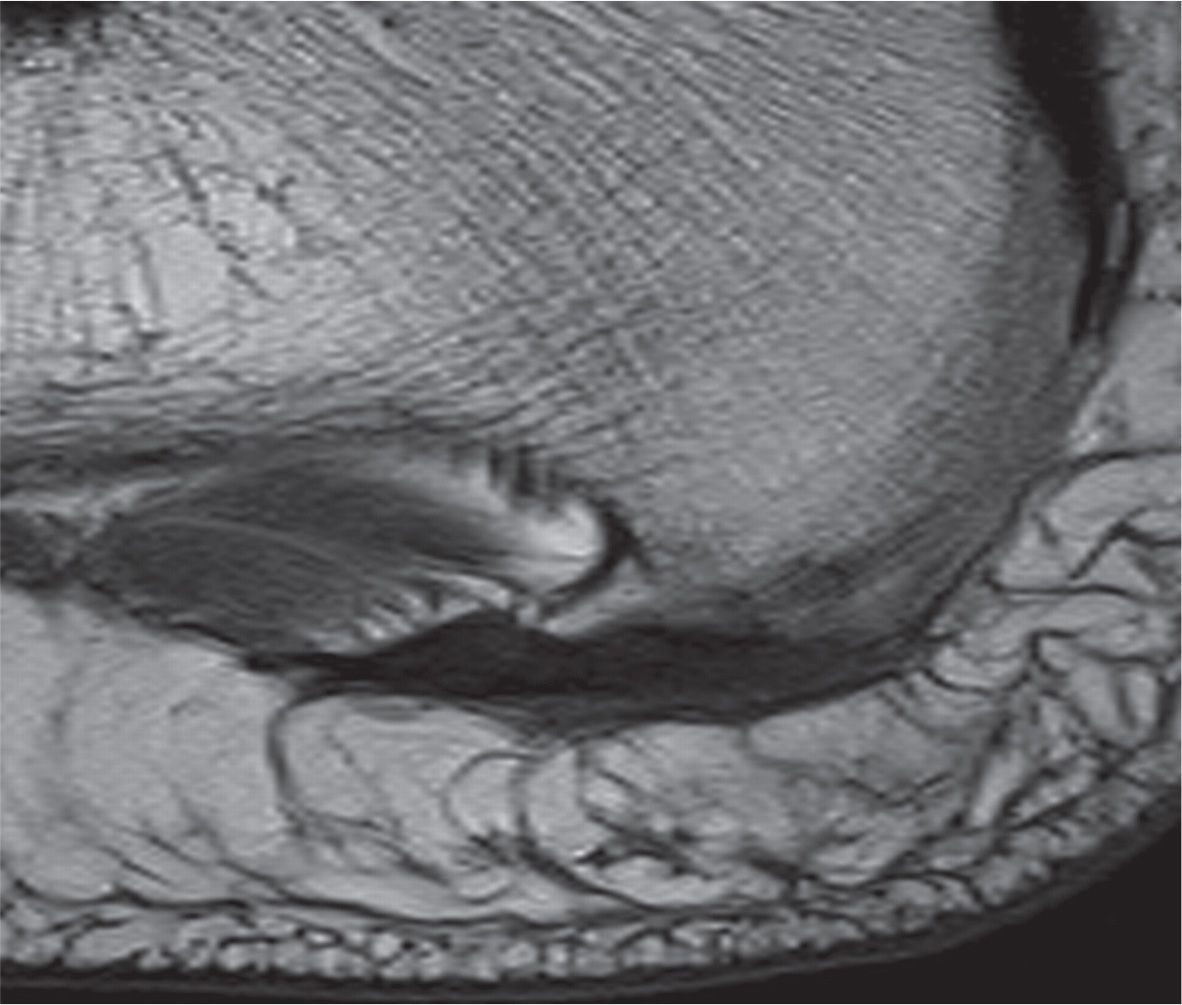
FIGURE 25-21. Plantar calcaneal enthesophyte. Note associated thickening of the plantar fascia without remarkable signal change (sagittal T1-weighted sequence).
Another possible complication associated with small tear is the secondary formation of scar or fibroma, which may be palpable and painful.
Finally, the inferior calcaneal nerve, which runs deep to the plantar fascia origin, can be affected by the local inflammatory process related to plantar fasciitis; it may also suffer chronic microtrauma because of its peculiar topography. Secondary denervation of the abductor digiti quinti muscle may occur, initially with diffuse and homogeneous increased signal intensity in the fluid-weighted sequences, and then with progressive fatty infiltration, which indicates chronic involvement (Figure 25-23). These findings are known as Baxter syndrome and also may be a source of chronic heel pain refractory to treatment.56

FIGURE 25-22. Rupture of the plantar fascia. A: Sagittal PD-weighted sequence fat saturation. Full-thickness tear of the central band of the plantar fascia with fluid-filled gap. Associated thickening and surrounding edema. A plantar calcaneal enthesophyte is also observed. B: Sagittal T1-weighted sequence. The same area demonstrating intermediate-signal intensity. Note the cutaneous marker indicating the area of pain.
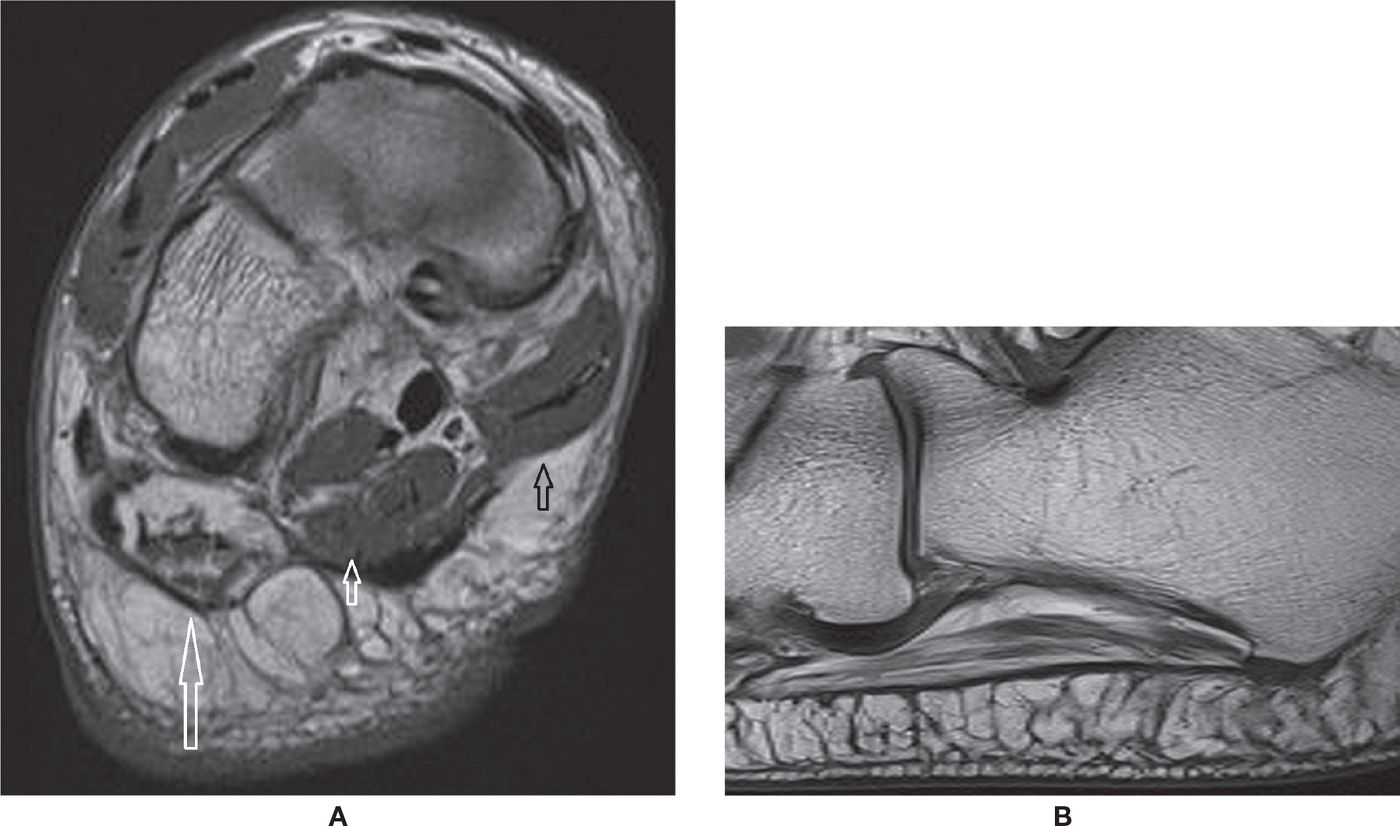
FIGURE 25-23. Baxter syndrome. A: Coronal T1-weighted sequence. Severe fatty infiltration of the abductor digiti quinti muscle due to chronic denervation (long arrow). Note the normal aspect of the trophic superficial layer of the adjacent plantar intrinsic muscles of the foot, flexor digitorum brevis (small white arrow), and abductor hallux (small black arrow). B: Sagittal T1-weighted sequence. There is moderate fatty infiltration of the abductor digiti quinti muscle. Note the lateral band of the plantar fascia adjacent to it, in this case with normal thickness and signal.
Plantar Fibromatosis
Plantar fibromatosis is defined as the presence of fibrous proliferation within the plantar fascia. This disorder may occur at any age but is most frequent between the ages of 30 and 50 years, involving more often the central and medial area of the fascia. The lesions are not infrequently multiple, and it may be bilateral in up to 50% of patients. On MR, the fibroma is oval, with low-signal intensity on T1-weighted sequences, low-to-intermediate or heterogeneous signal intensity in T2-weighted sequences, and with variable enhancement by intravenous (IV) gadolinium.52,57 The lesion may be eccentric and bulge the plantar fat pad and even the adjacent surface of the intrinsic muscles (Figure 25-24). Evidence of true invasion of the deep soft tissue structures should be sought, with signal changes of the underlying muscle, indistinct margins, or even definite evidence of invasion; however, this is quite rare. If exeresis of the tumor is performed, postoperative imaging will demonstrate a defect or focal thinning of the fascia; eventual rupture can occur. Recurrence of the lesion may happen, with an irregular lesion that may increase in size.
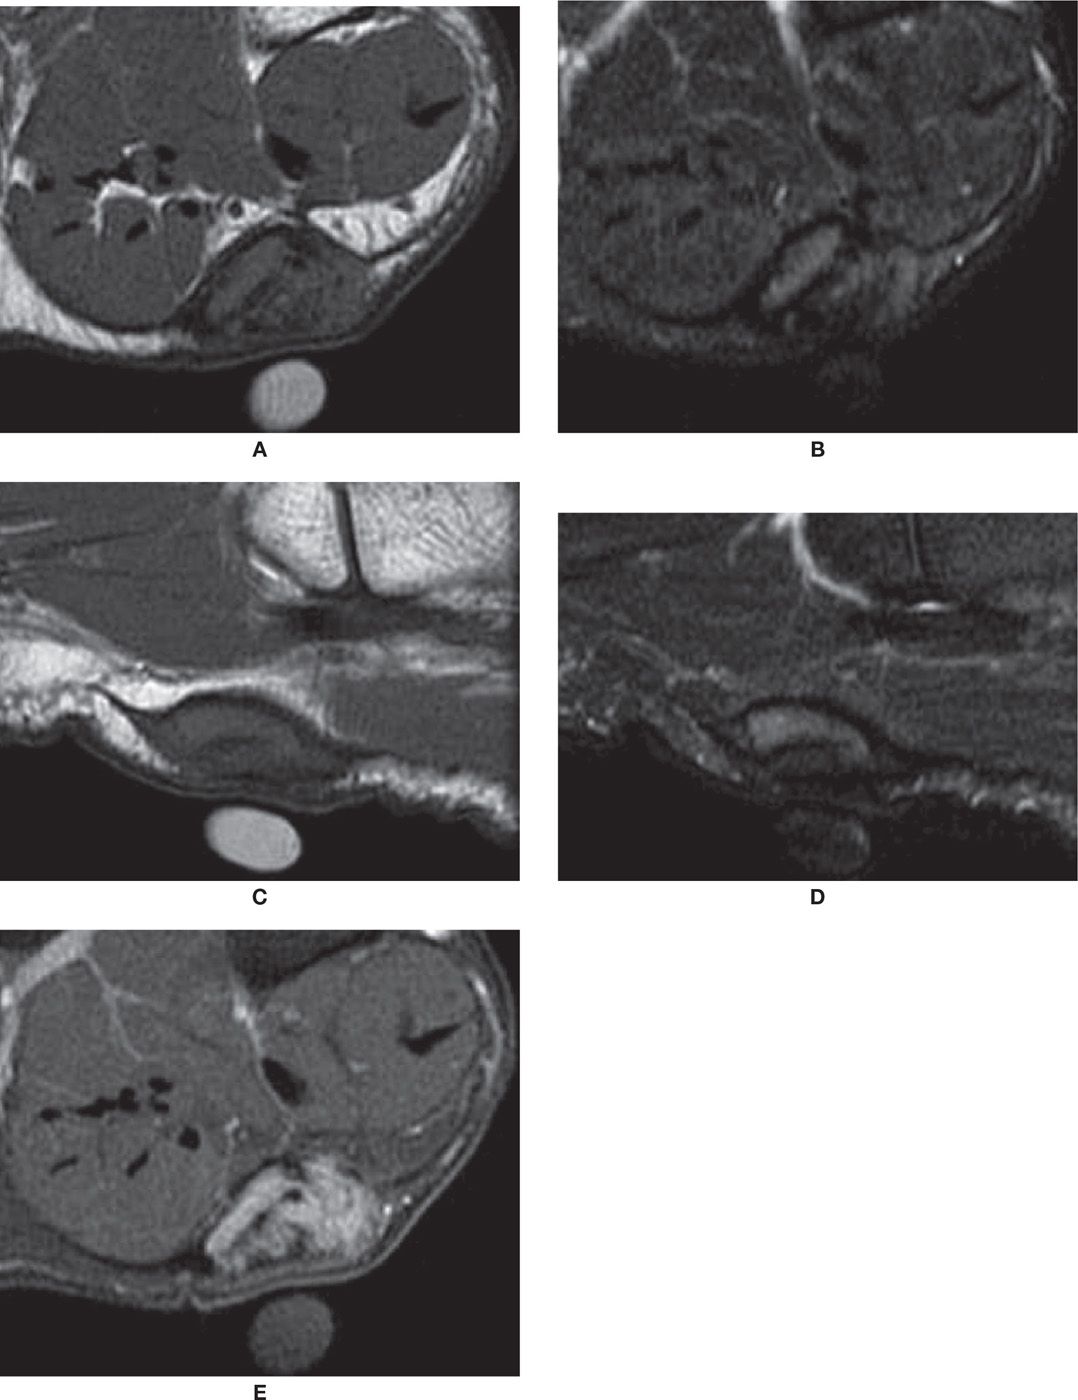
FIGURE 25-24. Plantar fibroma. Coronal T1- (A) and T2-fat-saturation- (B) weighted sequences. Nodule demonstrates intermediate-signal intensity in T1 and T2. There is an adjacent cutaneous marker. Sagittal T1- (C) and T2-fat-saturation- (D) weighted sequences. The nodule is again observed in continuity with the plantar fascia. E: Coronal T1-weighted sequence fat after intravenous injection of paramagnetic contrast. In this case, there was diffuse enhancement of the lesion.
BONE
Bone Marrow Edema
Bone marrow edema is the classic denomination of high-signal intensity within the bone marrow in MRI fluid-sensitive-weighted sequences. The true histologic representation of this finding is uncertain, however, and it is not infrequently a nonspecific imaging feature. Graduation of its intensity may be done both using MRI fluid-sensitive-weighted sequences or by the T1-weighted sequence, which is more specific, with intense edema represented as low-signal intensity in relation to muscle (Figure 25-25).
The causes of bone marrow edema are variable. Reactive bone edema may be due to a surrounding articular or soft tissue inflammatory process, vascular channels, subcortical or subchondral cyst, altered biomechanics, or areas of red bone marrow. There is variable high-signal intensity in the fluid-weighted sequences, but the T1-weighted sequence usually demonstrates normal signal intensity or subtle intermediate signal in relation to the muscles.
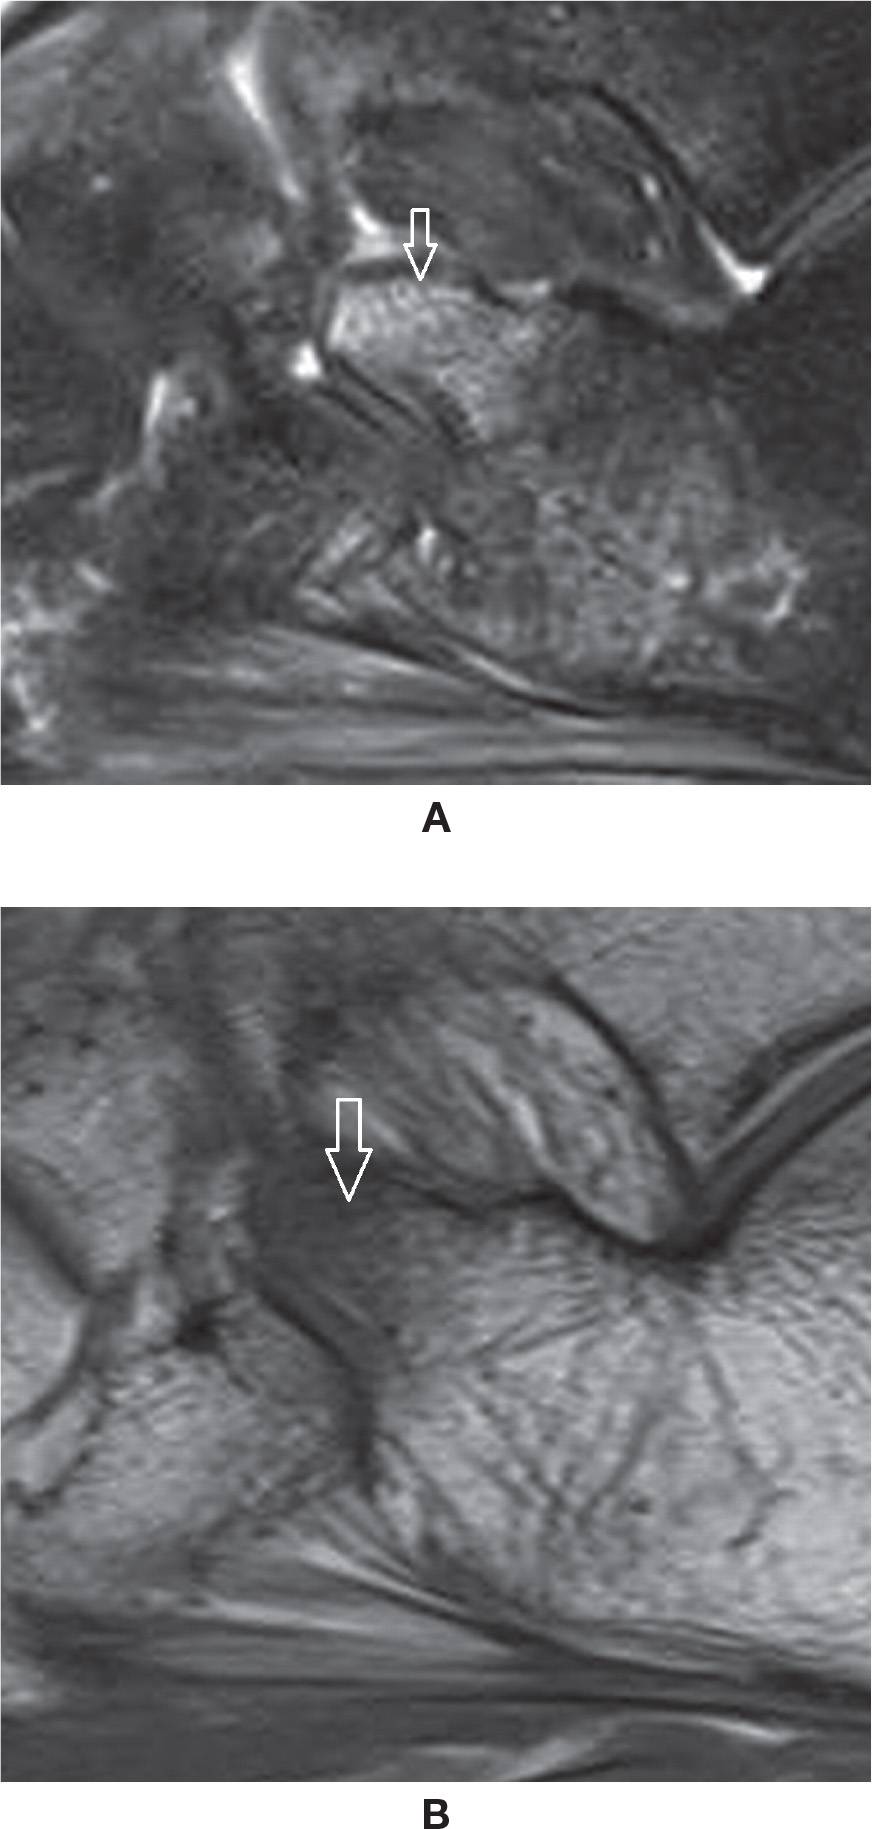
FIGURE 25-25. Bone marrow edema. A: Sagittal PD-weighted sequence fat saturation. Edema of the anterior process of the calcaneus post–ankle torsion. B: Sagittal T1-weighted sequence. Low-signal intensity within the corresponding area, indicating marked severity of the edema. However, there was no evident fracture line.
Microfracture of the bone trabeculae (or bone bruise), fracture, and subchondral marrow edema associated with arthritis may or may not be accompanied by low-signal intensity in T1-weighted sequences. Avascular necrosis (AVN) may have variable signal in both sequences. On the other hand, osteomyelitis is associated with bone marrow edema of low-signal intensity in T1-weighted sequences.58,59
Other less frequent causes are transient osteoporosis, regional migratory osteoporosis, and disuse osteoporosis; multiple small spots of bone marrow edema may be diffusely observed within the affected bones, with epiphyseal predominance. Complex regional pain syndrome (CRPS) is also a questionable cause.58,59 Note that skeletally immature patients may also present with nonspecific areas of high signal within bone marrow due to various developmental processes (Figure 25-26).
Accessory Bones
Accessory bones may be frequently observed in cross-sectional studies of the foot.60 Among them, there is particular interest in the os trigonum, observed posterior to the posterolateral process of the talus, representing a non-fused ossification center with variable shape and size. It is present in approximately up to 14% of the feet (Figure 25-27A). In some cases, the synchondrosis between it and the talus is fused, determining a prominent aspect of the posterolateral process (Stieda process). The os trigonum should be differentiated from a fracture of the posterolateral process of the talus. Also, the ossicle may lead to pain if fractured. Os trigonum syndrome, a more common chronic mechanism with degenerative/overuse change of the synchondrosis, presents with bone marrow edema and cystic change that may contribute to posterior ankle pain61 (Figure 25-27B). The os trigonum may also be involved in posterior impingement syndrome, involving structures between the soft tissues and posterior margins of the tibia, talus, and calcaneus; this is caused by chronic forced plantar flexion, for example, in ballet dancers or soccer players.61,47 In this situation, there is edema posteriorly in the soft tissues, bone margins, and within the os trigonum with MRI fluid-sensitive sequences.
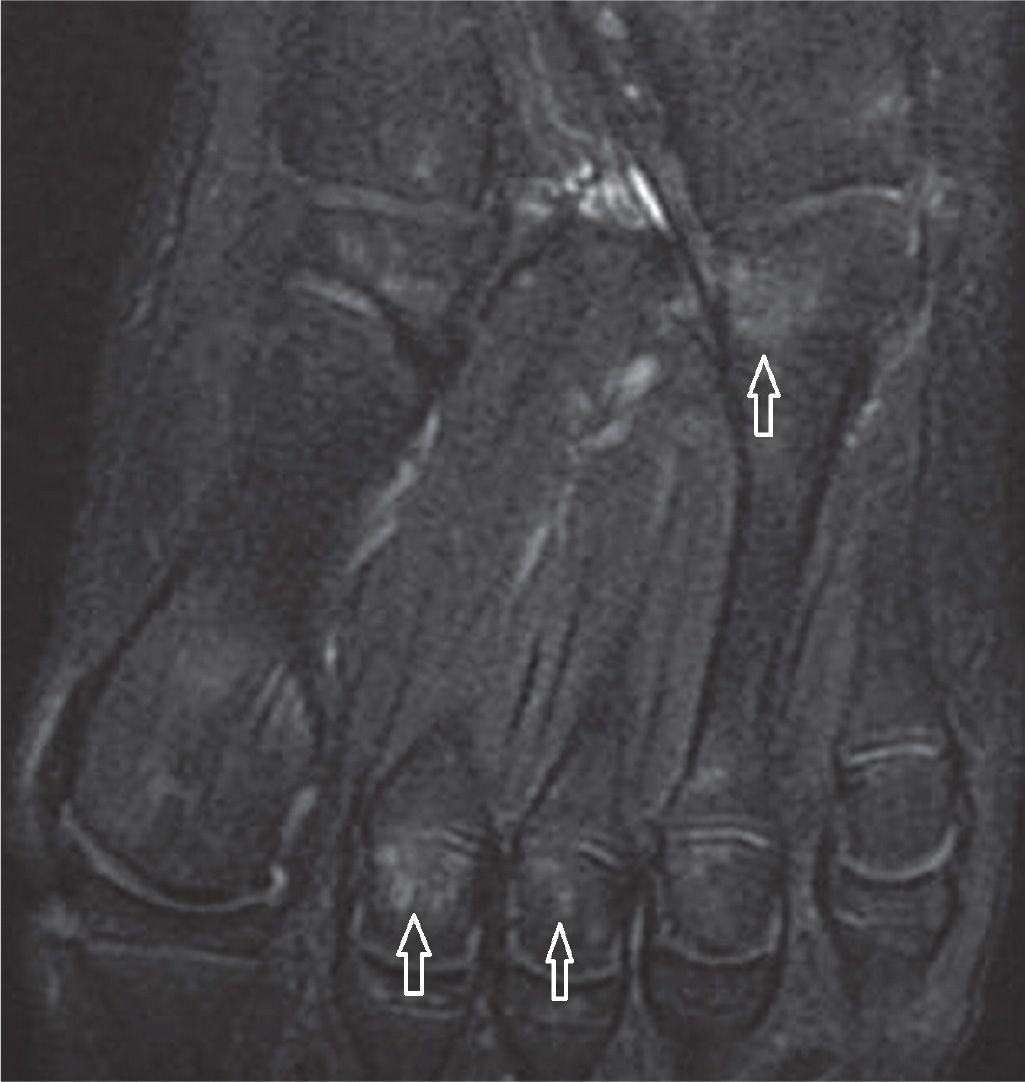
FIGURE 25-26. 11-year-old boy. Study done to evaluate the base of the fifth metatarsal, without local changes. Nonspecific multiple foci of high signal within the bone marrow. Axial PD-weighted sequence fat saturation.
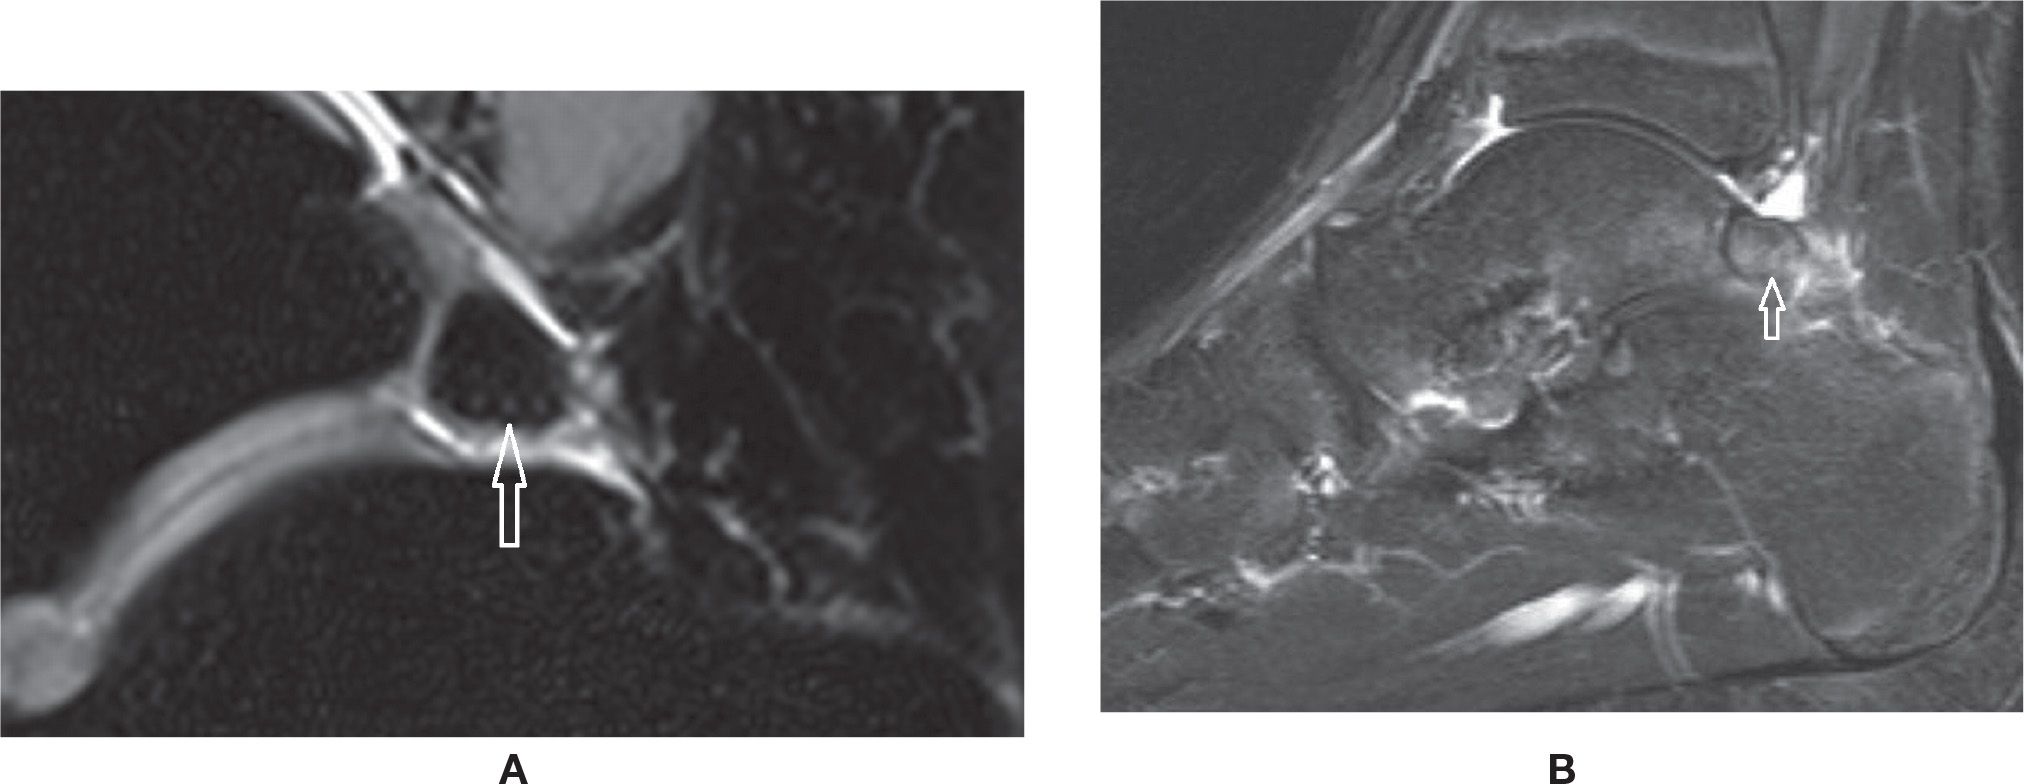
FIGURE 25-27. Os trigonum. A: Normal aspect. Sagittal PD-weighted sequence fat saturation. B: Os trigonum syndrome with posterior impingement. Bone marrow and mild surrounding fat planes edema. Sagittal PD-weighted sequence fat saturation.
The accessory navicular bone is observed adjacent to the medial tuberosity of the navicular in about 4% of the population. Three variations have been described (Box 25-4). Type I is a small ossicle that measures about 3 mm and is embedded within the distal aspect of the posterior tibial tendon. This type is usually asymptomatic and may be precisely termed an os tibiale externum. The type II accessory navicular corresponds to a nonfused ossification center apposed to the tuberosity, with a possible synchondrosis between them; this is the true accessory navicular. The main insertion of the PTT may be observed at this accessory bone. It may be associated with symptoms due to biomechanical stress at the synchondrosis; findings include bone marrow edema and cystic change, similar to that seen with os trigonum syndrome. The type III represents a synostosis of the accessory bone with the navicular, also know as a cornuate navicular. PTT dysfunction may be associated with types II and III accessory navicular bone (Figure 25-28).60,62,63
The os intermetatarseum is an accessory bone between the bases of the first and second metatarsals. It may be associated with metatarsus varus primus.64
The os peroneum is a sesamoid embedded within the peroneus longus tendon just proximal to or at the level of its inflexion at the cuboid (Figure 25-29). It may be associated with pain (painful os peroneum syndrome [POPS]), which demonstrates regional edema either in the os or in the adjacent calcaneus. In cases of distal rupture of the peroneus longus tendon, abnormal retraction of the tendon together with the bone may happen.65,66
Several other accessory bones may be seen, such as the os vesalianum (base of the fifth metatarsal), the os supranaviculare (superior aspect of the navicular),60 and the os subfibulare (adjacent to the distal fibular epiphysis); these ossicles may need to be differentiated from fracture and can also may be associated with symptoms.66 Abnormal findings include associated bone marrow and surrounding edema; evidence of biomechanical stress is identified as high signal in MRI fluid-weighted sequences.
Sesamoids
The two sesamoid bones of the first metatarsophalangeal joint may be a frequent location of clinical pain. Bipartite sesamoid is frequently seen, usually medially; it classically presents as a well-defined convex shape with nonmatching apposed margins and a coronal cleavage plane.67 An attempt to visually unite the pieces of a bipartite sesamoid would result in a larger sesamoid when compared to the other sesamoid. The differential diagnosis includes fractured sesamoid when the global dimensions are normal and the pieces fit together (Figure 25-30). If the fracture was remote, however, it may be sometimes difficult to determine the true origin of the findings. The presence of a cleavage plane in another plane is also suggestive of previous fragmentation. The clinical diagnosis of sesamoiditis may be represented by bone marrow and surrounding soft tissues edema of varying intensity (Figure 25-31). A spectrum of changes, including altered biomechanics, microfracture of trabeculae, or fracture with or without associated AVN of the sesamoid or of the fragmented pieces, may be observed (Figure 25-32). Note that a thin sclerotic line or small focal area within the plantar surface of the sesamoid constitutes a physiologic finding and should not be mistaken for an area of AVN. OA of the first metatarsophalangeal joint can also extend to the metatarsal-sesamoid (or glenosesamoid) complex; findings include chondral wear, subchondral sclerosis, cysts, and peripheral osteophytes (Figure 25-33).
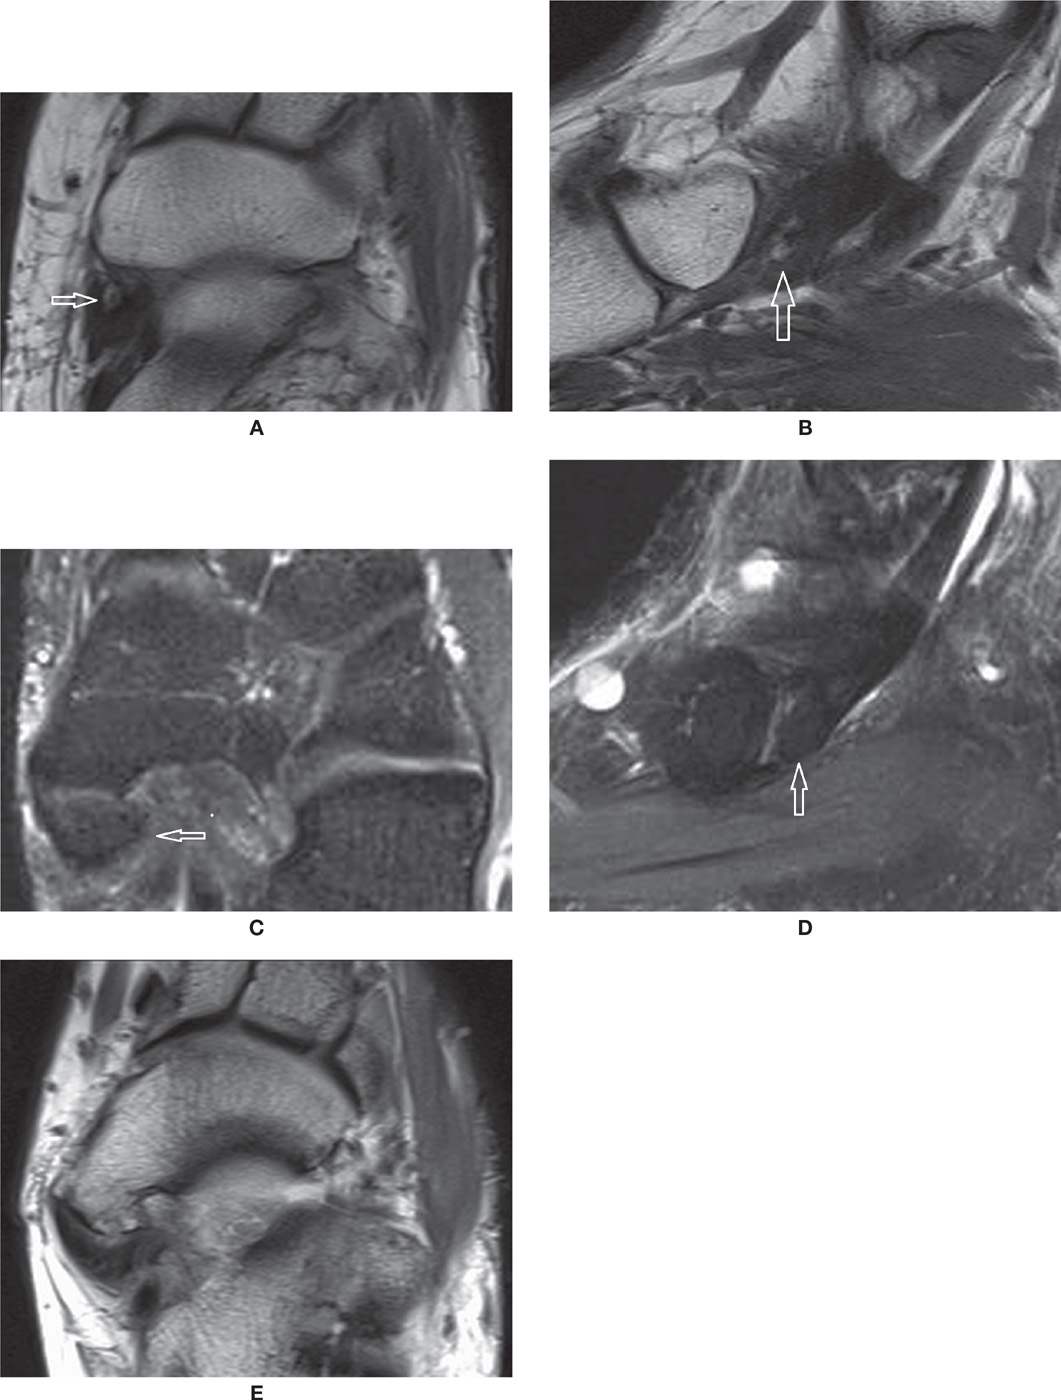
FIGURE 25-28. Accessory navicular bone. Axial (A) and Sagittal (B) T1-weighted sequences. Type I (arrow). Axial (C) and Sagittal (D) PD-weighted sequences with fat saturation. Type II (arrow). Note the synchondrosis with the navicular. E: Axial T1-weighted sequence. Type III or cornuate navicular.
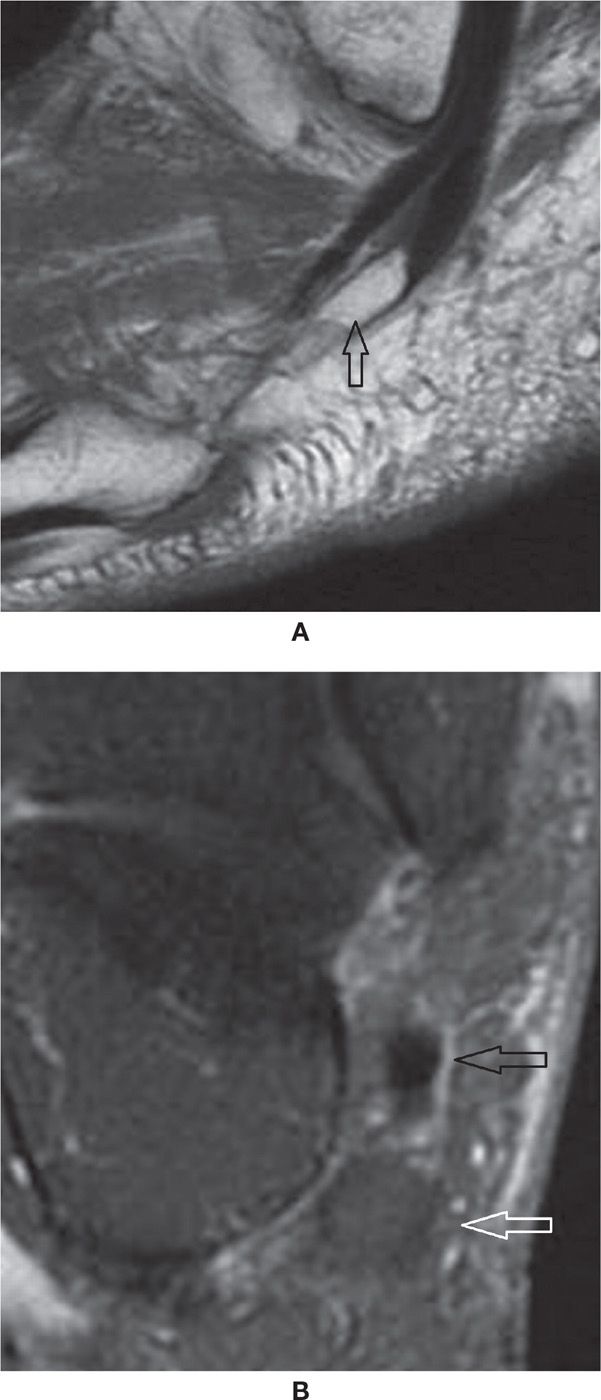
FIGURE 25-29. Os peroneum. A: Sagittal T1-weighted sequence—a large os peroneum is seen within the peroneus longus tendon at the typical location. B: Coronal PD-weighted sequence fat saturation. Os peroneum with normal bone marrow signal (white arrow). Note the adjacent peroneal brevis tendon (black arrow).
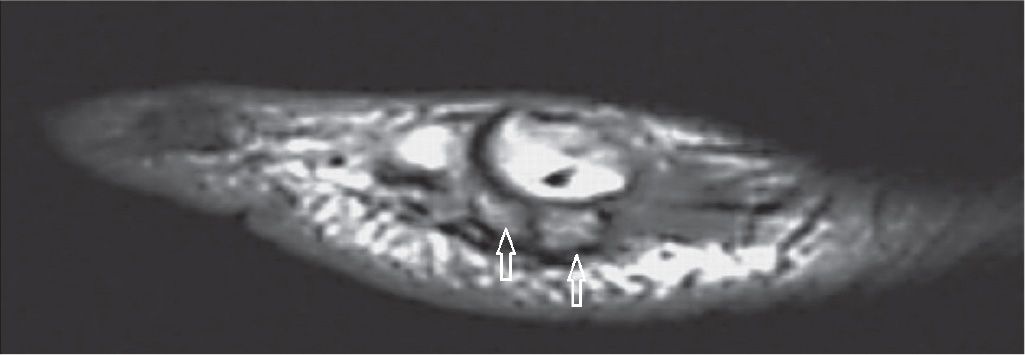
FIGURE 25-30. Fractured sesamoid. The fragments of the sesamoid (arrows) match exactly (Sagittal T1 weighted sequence).
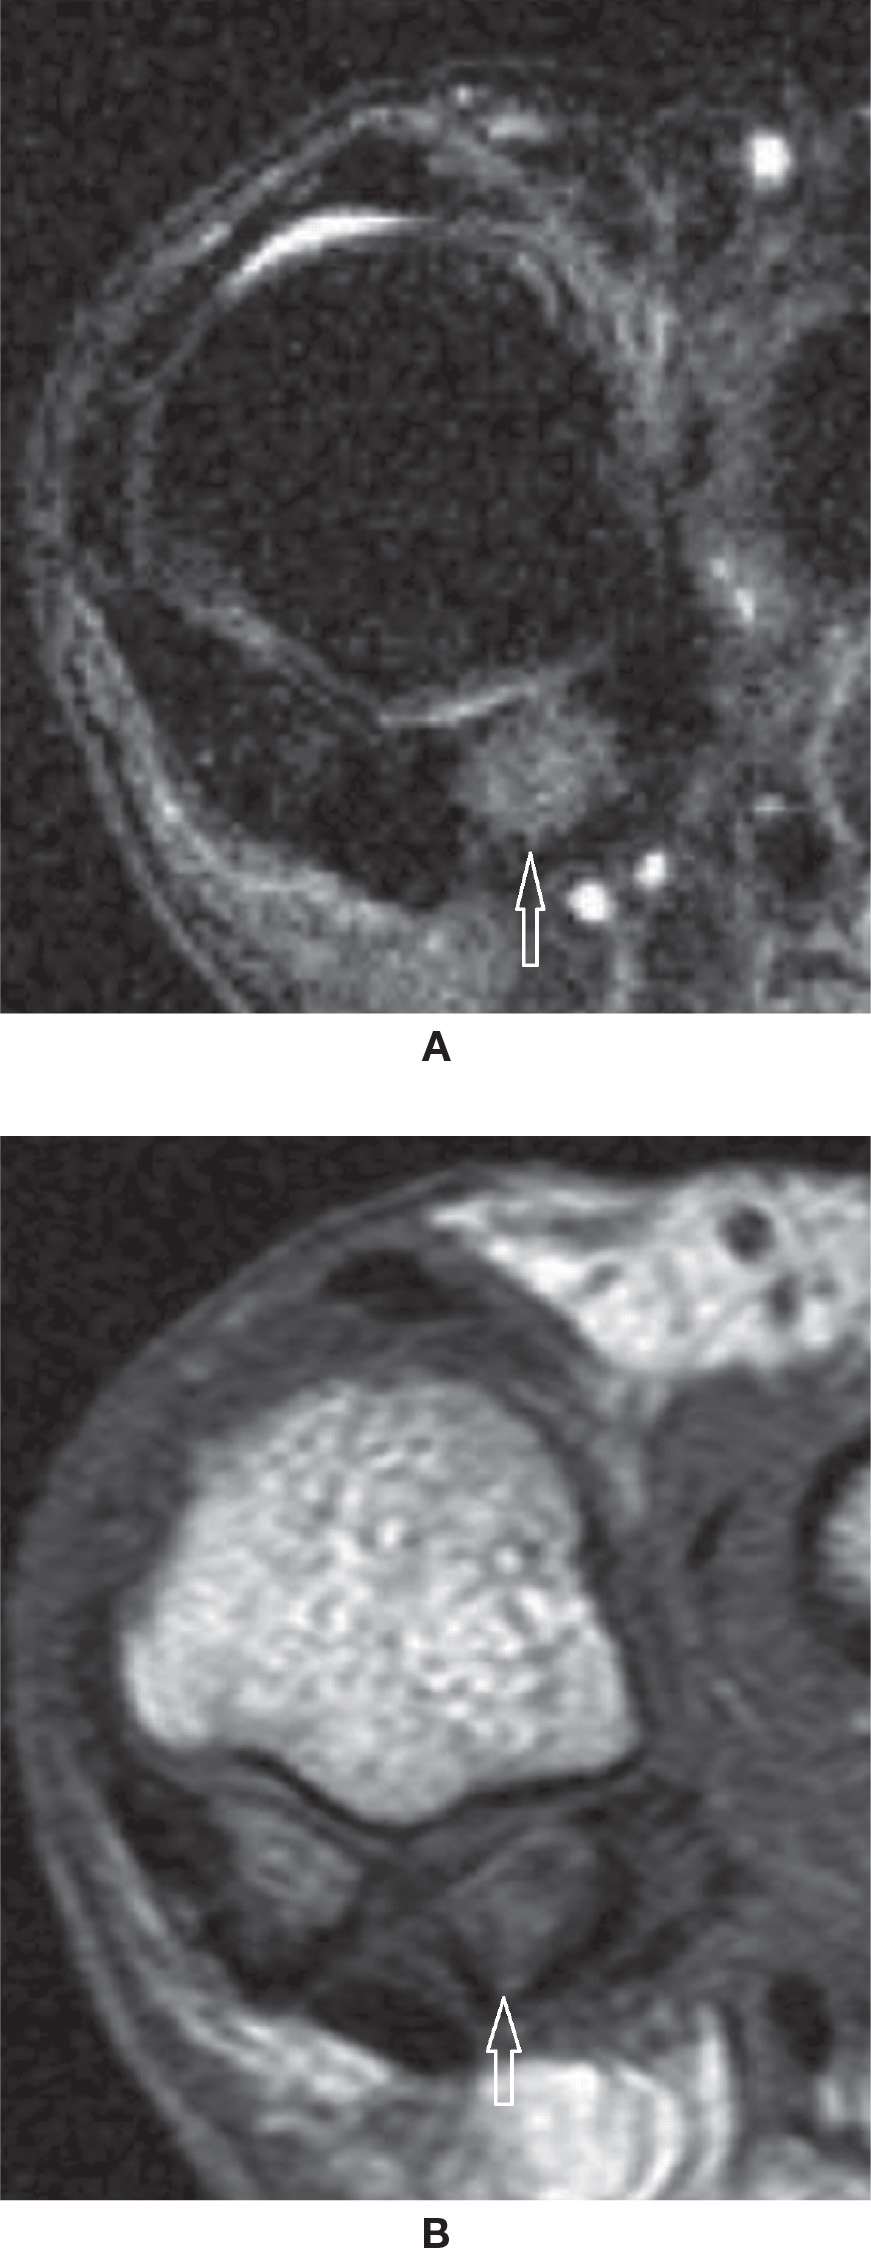
FIGURE 25-31. Sesamoiditis. A: Coronal T2-weighted sequence fat saturation. Bone marrow edema within the lateral sesamoid. B: Coronal T1-weighted sequence. Heterogeneous moderate bone marrow signal represents the moderate intensity of the bone marrow edema.
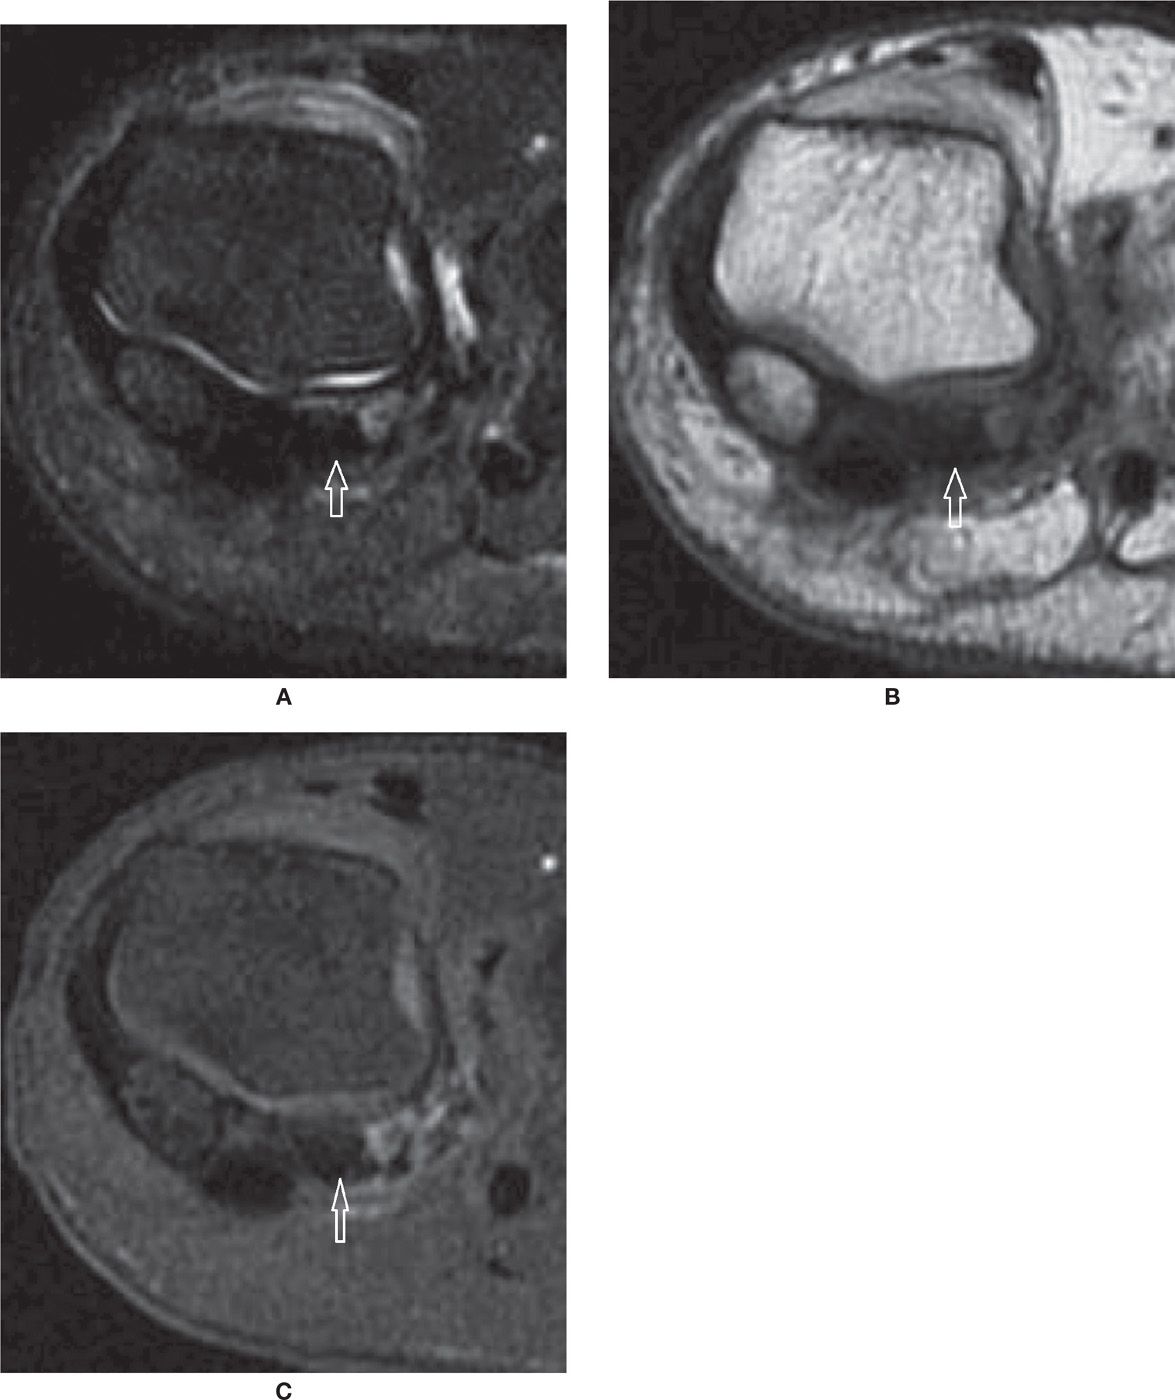
FIGURE 25-32. Avascular necrosis. Coronal T2-fat-saturation- (A) and T1- (B) weighted sequences. Marked low-signal intensity within the lateral sesamoid, which appears smaller than the medial due to fragmentation. C: Coronal T1-weighted sequence fat saturation after intravenous injection of paramagnetic contrast. Absence of enhancement of the lateral sesamoid confirms AVN. Nonspecific soft tissue enhancement about the sesamoid and between the fragments.
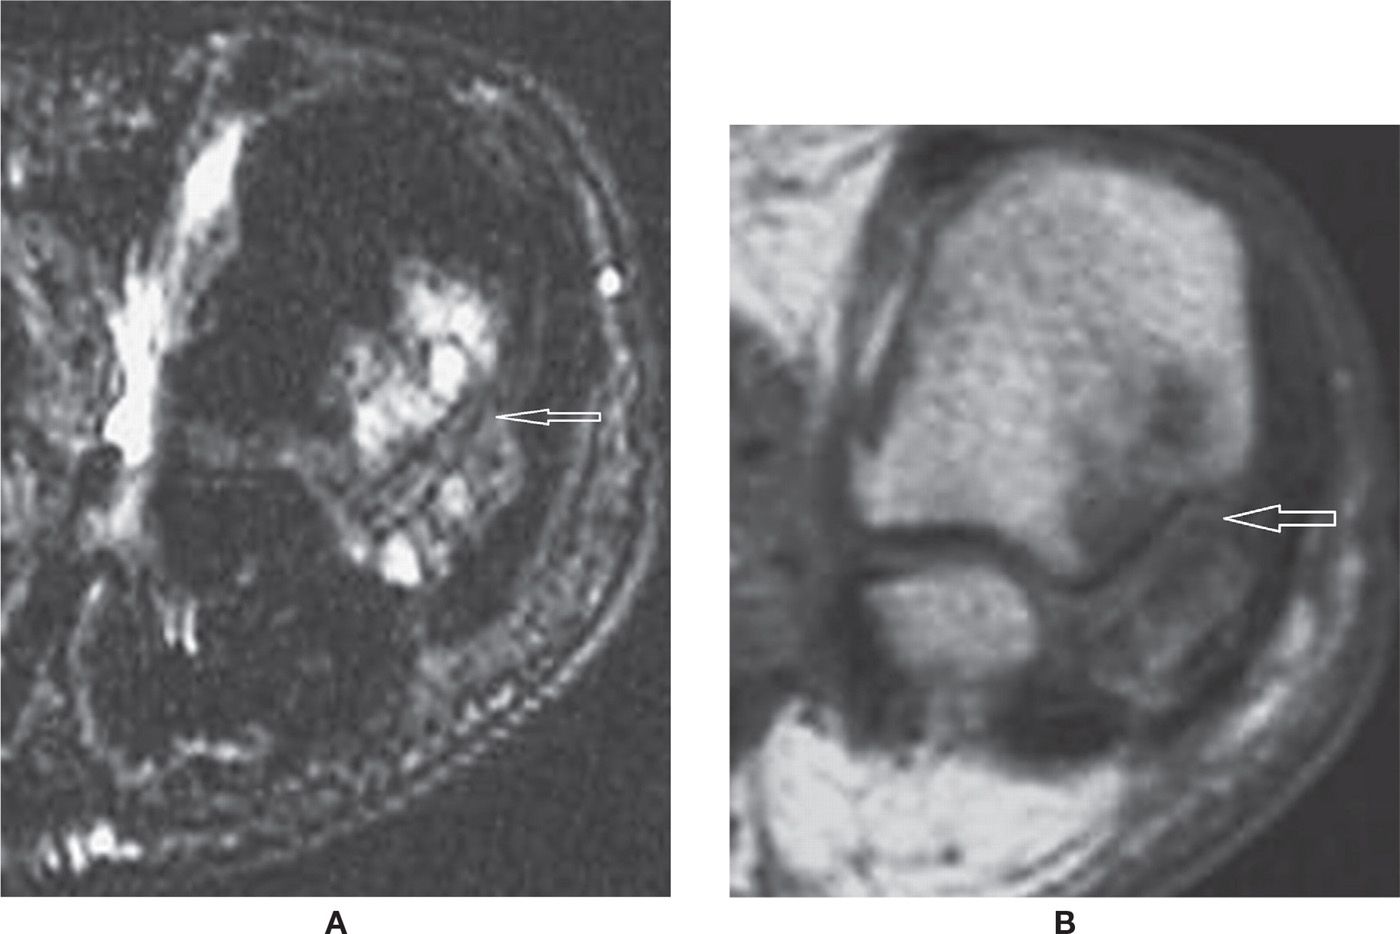
FIGURE 25-33. Osteoarthritis. Coronal T2-fat-saturation- (A) and T1- (B) weighted sequences. Multiple subchondral cysts and bone marrow edema indicating OA of the metatarsosesamoid joint.
TRAUMATIC LESIONS
Both CT and MRI may be used to evaluate posttraumatic bone lesions of the foot. The multiplanar capabilities of both methods, including off-axis reformats that may be performed with the aid of a workstation, are particularly helpful to understand comminuted and complex fractures and help with their classification. The analysis of fracture line extension to articular surfaces, step-off deformities, presence of intra-articular loose bodies, measurement of displaced fragments, and associated chondral and soft tissue injuries are relevant.
A bone contusion represents the first stage of an acute traumatic insult to bone, with microfracture of trabeculae represented as bone marrow edema in MRI fluid-sensitive-weighted sequences with greatest sensitivity (Figure 25-25).67 A macroscopic fracture line within the bone marrow or cortex may be observed in MRI as a low-signal image in T1-weighted sequences and as high- or low-signal lines in fluid-sensitive images (Figure 25-34). In osteoporotic patients, MRI can be particularly useful to detect radiographically occult fractures with more advantages relative to CT. As a general rule, however, CT demonstrates fractures exquisitely; it is particularly helpful to understand the architecture of comminuted fractures for example, of the calcaneus and midfoot (Figure 25-35). Associated surrounding soft tissues edema/hemorrhage, osteochondral injury, disruption of ligaments or tendons, entrapment of tendons (Figure 25-36), and hemarthrosis, or rather infrequently lipohemarthrosis, may be associated.
An osteochondral injury is a lesion involving hyaline cartilage and subchondral bone, usually at the talar dome. The exact pathogenesis is not precisely known; however, the anterolateral lesions are frequently the result of an acute traumatic mechanism of inversion with dorsiflexion, and posteromedial lesions are due to inversion with plantar flexion. It has also been reported that medial lesions are frequently asymptomatic and do not necessarily have a history of previous trauma, but may be a consequence of chronic microinstability, among other possible causes.68,69
Both CT and MRI have high accuracy for the detection of osteochondral lesions. The lesion stage may be classified as stage I when there is a small area of compression of the subchondral bone, stage II when an osteochondral fragment is partially detached, stage III if it is completely detached but remains in the donor site, and stage IV if it is displaced from the donor site. MRI may help to differentiate stable from unstable lesions, stages II and III, by the presence of underlying high signal or fluid in fluid-sensitive-weighted sequences partially or totally surrounding the fragment.70 Other MRI findings may be associated with instability of the fragment, such as the presence of fluid at the interface between the bone and the fragment, cartilaginous defects, or cystic lesions beneath the cartilage, especially if larger than 0.5 cm (Figure 25-37).70–73
Stress Fracture
A stress fracture occurs when a chronic biomechanical stress is applied to a bone not adapted to withstand it. When the bone has normal characteristics and the stress is beyond the physiologic limits for that given patient and bone, the stress lesion is named as fatigue. When the stress is physiologic but the bone is not within the expected characteristics of normality (osteoporotic, for example), the stress lesion is named as insufficiency. Before a true fracture happens there is a stress response of the bone, clinically represented by pain at or just after exertion. This is observed in MRI initially as subtle bone marrow edema or enhancement by contrast on T1 fat-suppressed weighted images postcontrast; it likely represents microfracture of trabeculae. This is followed by a progressive increase in bone marrow edema, occasionally associated with periosteal edema, surrounding soft tissue edema, and then a visible incomplete fracture line. Lastly, a complete fracture may develop. The therapeutic interruption of this mechanism potentially allows the bone to have time to heal, with endosteal and periosteal reaction and asymmetric cortical thickening about the fracture site. With time, bone remodeling may eventually make the previous site of the stress injury have a normal appearance again, or a residual cortical thickening may be observed.74–77
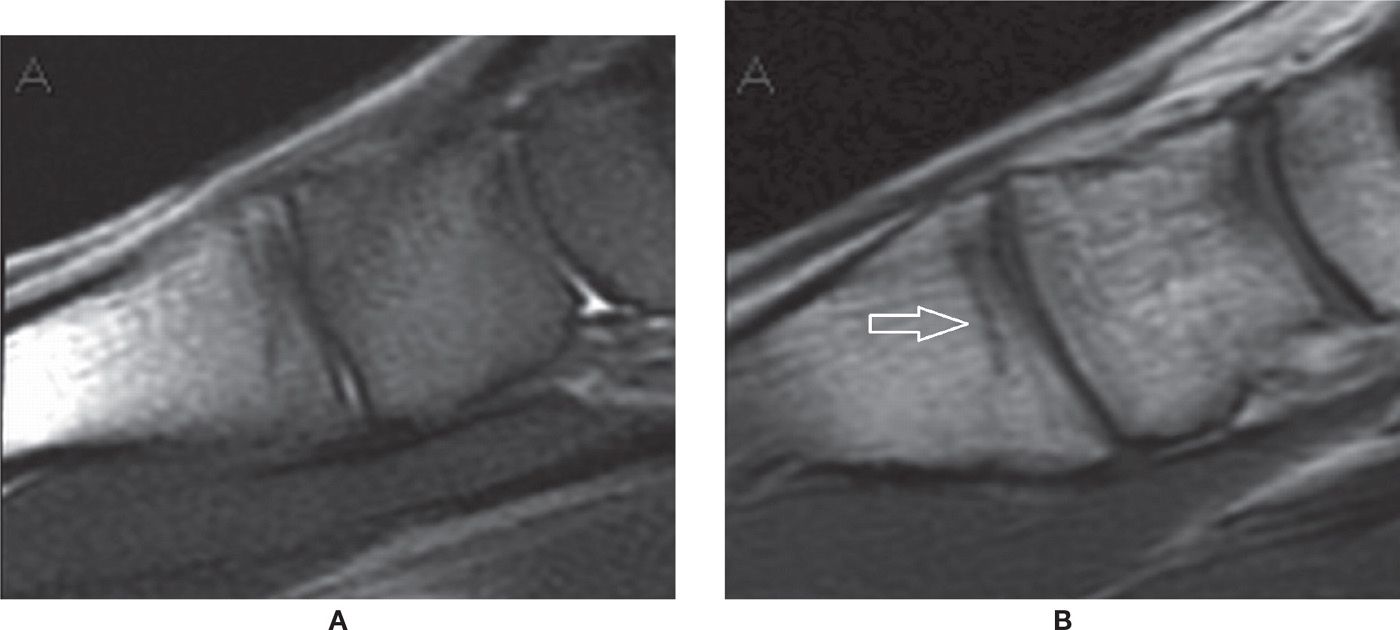
FIGURE 25-34. Occult fracture at the base of the first metatarsal. Sagittal PD-fat-saturation- (A) and T1- (B) weighted sequences. Mild bone marrow edema, which is hard to characterize due to imaging artifact resulting in a nonhomogeneous fat saturation with red marrow high signal in PD fat saturation. The fracture line is better demonstrated in the T1-weighted sequence.
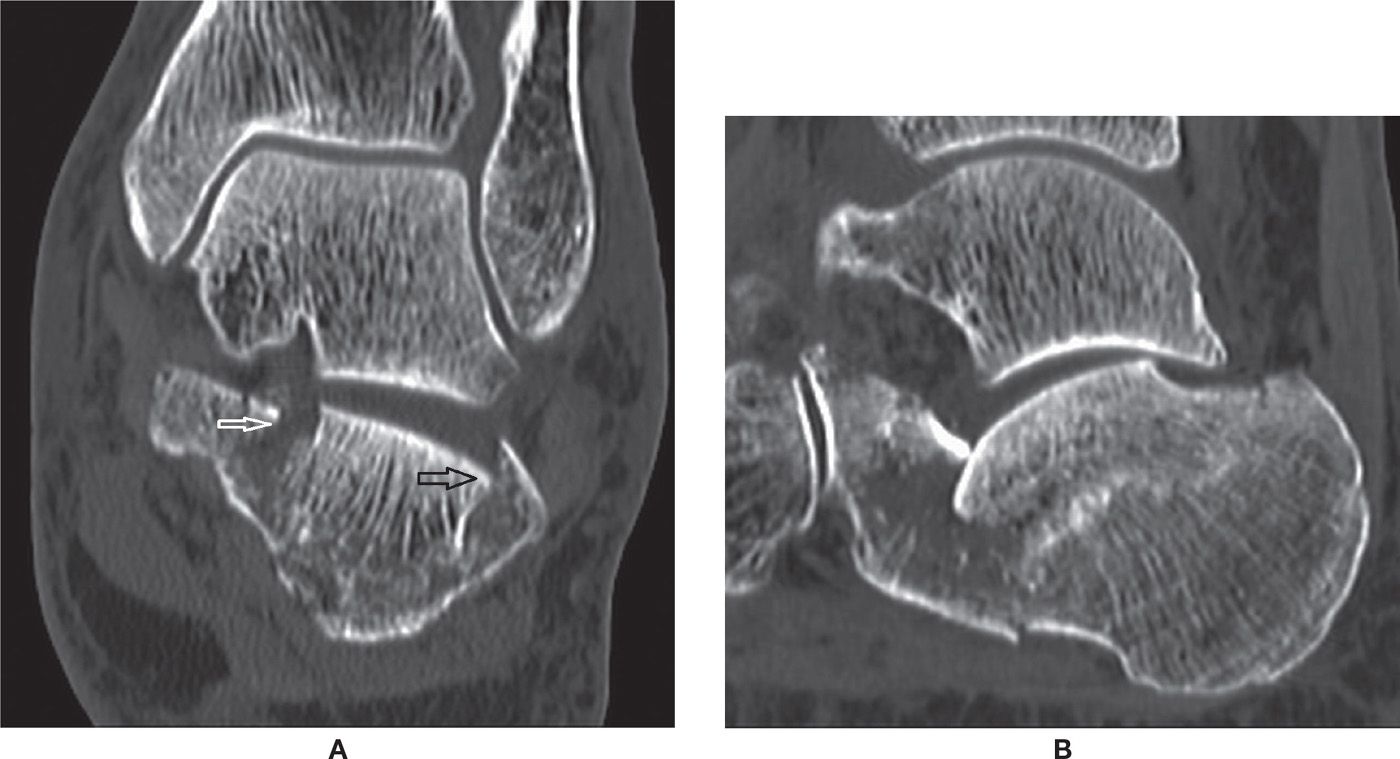
FIGURE 25-35. Calcaneal comminuted fracture (depression type)– (A) Coronal CT reconstruction 1mm. Fracture lines observed within the posterior subtalar joint (black arrow) and sustentaculum tali (white arrow). (B) Sagittal CT reconstruction 1mm. Impaction of the posterior subtalar joint calcaneal facet.
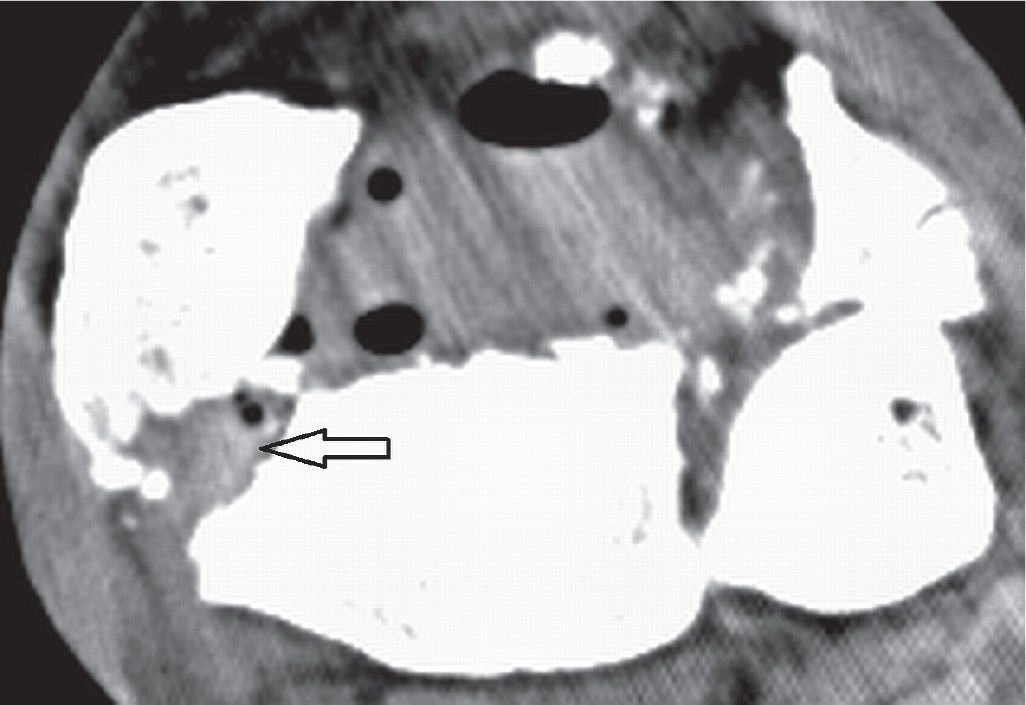
FIGURE 25-36. Comminuted fracture of the distal tibia with associated tendinous complication. Axial CT 1 mm reconstruction. Entrapment of the PTT (arrow) in a fracture gap of the distal tibia. Note the gas within the soft tissues (open fracture).
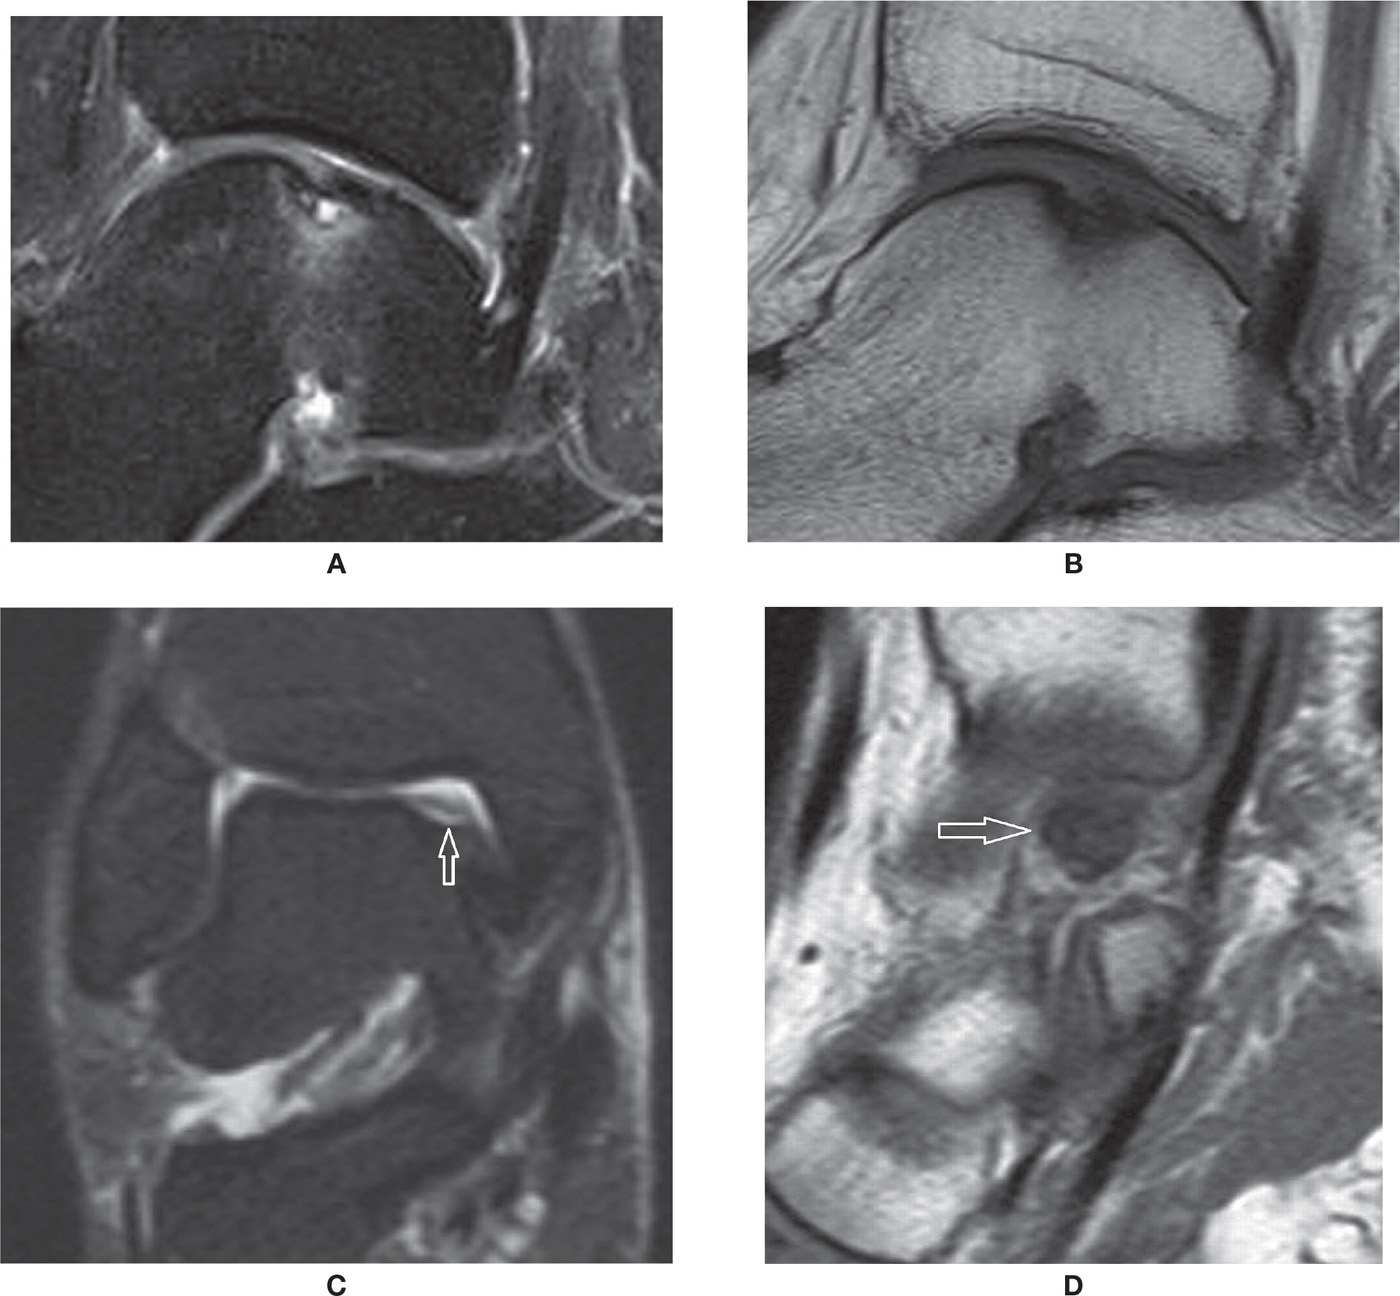
FIGURE 25-37. OCD talus. Sagittal PD-fat-saturation- (A) and T1- (B) weighted sequences: stable OCD. Cortical irregularity and small cortical fragment, undisplaced. There are bone marrow edema and an underlying cyst of small dimension, without evident chondral delamination or surrounding high-signal line. Coronal PD-fat-saturation- (C) and sagittal T1- (D) weighted sequences: unstable OCD. There is a bone gap at the site of a chronic OCD, with residual overlying cartilage in this coronal PD-fat-saturation image. The displaced low-signal necrotic fragment is displaced medially within the medial joint line (arrow in D).
CT will demonstrate the fracture line, periosteal reaction, and subsequent cortical thickening and bone remodeling. This diagnosis should be suspected anytime when there is a focal area of bone pain with insidious and progressive onset, usually associated with a new or a variation of a previous biomechanical stimulus. Those particularly susceptible are the patient with osteoporosis, inflammatory or metabolic bone conditions, and anorexia nervosa, as well as military personnel and athletes, including professional athletes who have their training changed.
The calcaneus stress fracture is usually observed in the superior aspect of the tuberosity, although they can happen in the other parts of the bone (Figure 25-38).77 The navicular bone stress fracture (Figure 25-39) is typically at the midline sagittal plane, observed in runners. Metatarsal stress fractures can be observed within the proximal aspect of the first, second, fourth and fifth metatarsals and distal aspect of the second to fourth (Figure 25-40).74 Stress fracture also affects the metatarsal head, which may be associated with AVN. Runners, military personnel, and osteoporotic patients are frequently affected. The tibia and fibula may also be frequently affected by stress reactions and fractures. There is a special vertical type of stress fracture infrequently seen in the tibia and femur75; CT will help demonstrate it.
Patients being treated with bisphosphonates may rarely present with recurrent stress fracture of the foot as a result of the decreased ability of bone remodeling. This is due to the blocking of the osteoclastic activity and stimulus to osteoblastic activity, and has been named “frozen bone syndrome.”78
Osteonecrosis/Avascular Necrosis
Osteonecrosis may be associated with a variety of causes. Examples include hemoglobinopathy (sickle cell disease and systemic lupus erythematous), Gaucher disease, Caisson disease, infection of bone, trauma, and particularly exogenous steroid use.79–81
The terminology is not uniform, but when the area of necrosis is intramedullary within the metaphysis and diaphysis, the term bone infarct is preferred. When the necrosis occurs at the epiphysis, the term avascular necrosis is applied; this may be at times indistinct from subchondral fracture, which may also have necrotic fracture fragments. Also, sometimes the term osteonecrosis is preferred to indicate ischemic bone death due to sepsis.
The MRI findings are variable. The initial finding of a bone infarct is bone marrow edema in fluid-weighted sequences, initially subtle but usually more prominent, also characterized by low signal in T1-weighted sequences. Later, the delimitation of a necrotic area will be associated with a “double-line sign,” which is a serpentine line of low-signal intensity in the fluid-sensitive sequence surrounding a line of high-signal intensity. A hallmark of remote areas of osteonecrosis is the presence of fat with high-signal intensity in T1-weighted images (Figure 25-41). Intravenous administration of paramagnetic contrast will demonstrate variable enhancement pattern, and its role has been subject to investigation, but in the acute phase, enhancement of surrounding marrow and soft tissues as well as joint effusion and reactive synovitis may be observed. This picture may sometimes be similar to osteomyelitis, but the correlation with clinical symptoms and history, particularly the absence of skin ulcerations and fistulas, helps with the differentiation. The prognosis of the findings may change depending on the underlying cause and the location and volume of bone involved. The resultant biomechanical change of the involved bone may predispose it to secondary fractures; for example, flattening of articular surfaces contributes to OA. On CT, secondary deformity with articular flattening and occasionally fragmentation, fracture lines, and diffuse sclerosis may be observed, paralleling the well-known radiographic findings, although MRI will be a more sensitive diagnostic tool, especially for early stages.
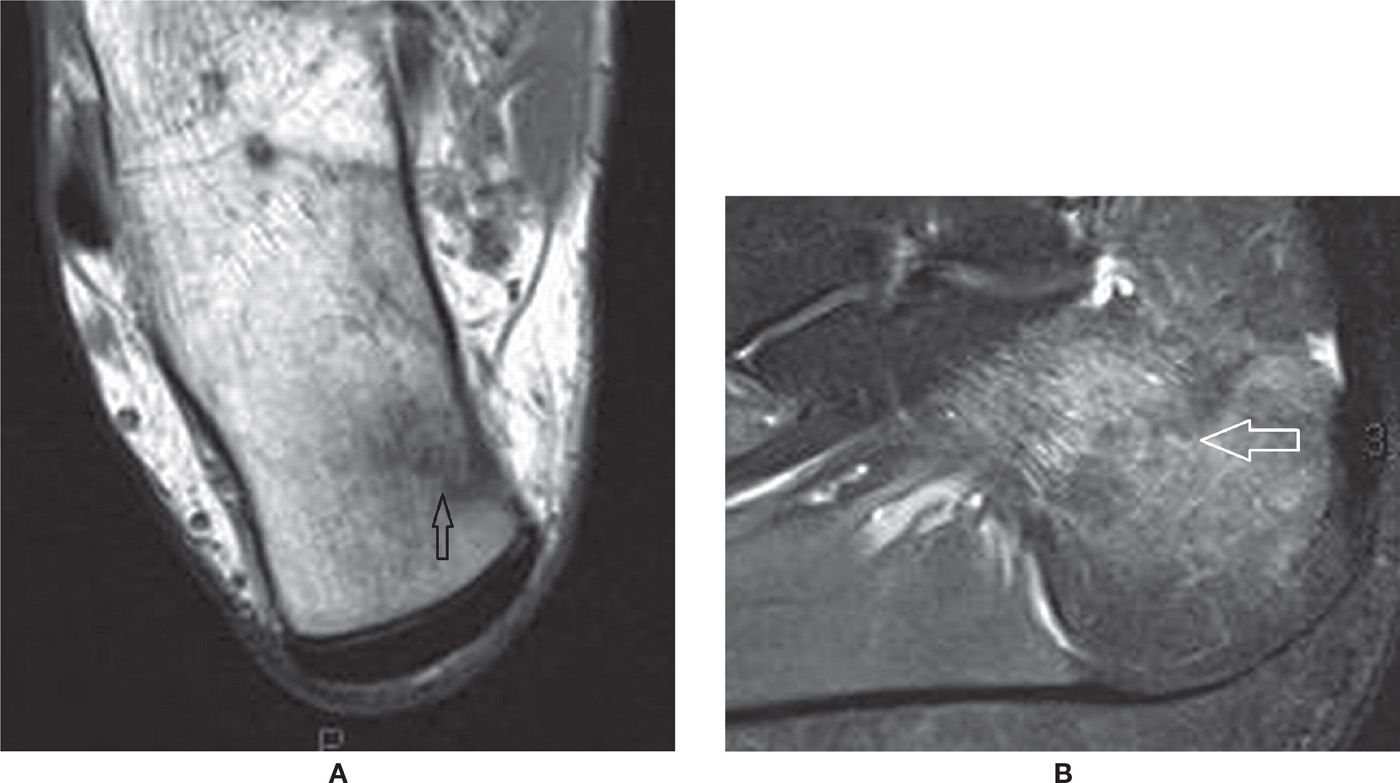
FIGURE 25-38. Calcaneal stress fracture. A: Axial T1-weighted sequence. B: Sagittal PD-weighted sequence with fat saturation. The fracture line extends perpendicularly to the superomedial cortex of the tuberosity. Marked surrounding bone marrow edema. Note the bone marrow edema represented by moderate low-signal intensity surrounding the irregular fracture line in A.
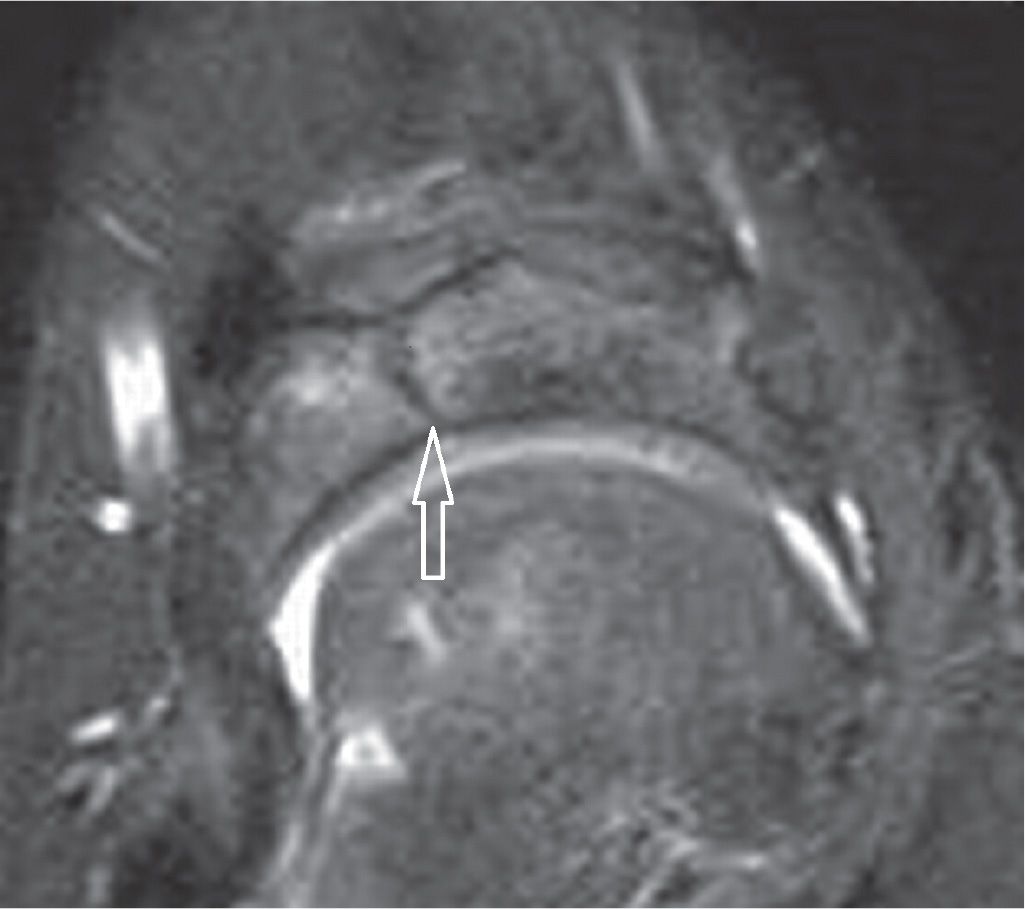
FIGURE 25-39. Navicular stress fracture. Axial PD-weighted sequence with fat saturation. Sagittal fracture line in the middle third of the navicular.
Special cases include AVN of the talus secondary to fracture and dislocation (Figure 25-42). Because of the large chondral surface, relative paucity of vascularization entry sites, the presence of small nutrient vessels, and lack of collateral circulation, the talus is particularly predisposed to AVN. Fracture and dislocation are associated with vessel disruption, and the chances of AVN increase with the magnitude of the fracture. Nondisplaced fracture of the neck has 0% to 15% risk of developing AVN. Displaced fracture with dislocation or subluxation of the subtalar joint has 20% to 50% risk of developing AVN. If there is also dislocation of the ankle joint, the chances are almost 100%, and virtually 100% if there is associated dislocation of the talonavicular joint. The presence of the Hawkins sign radiographically, a thin subchondral linear area of lucency at the talar dome, indicates the presence of blood supply at that area, and can be observed in radiographs after 6 to 8 weeks; this finding precludes AVN.81
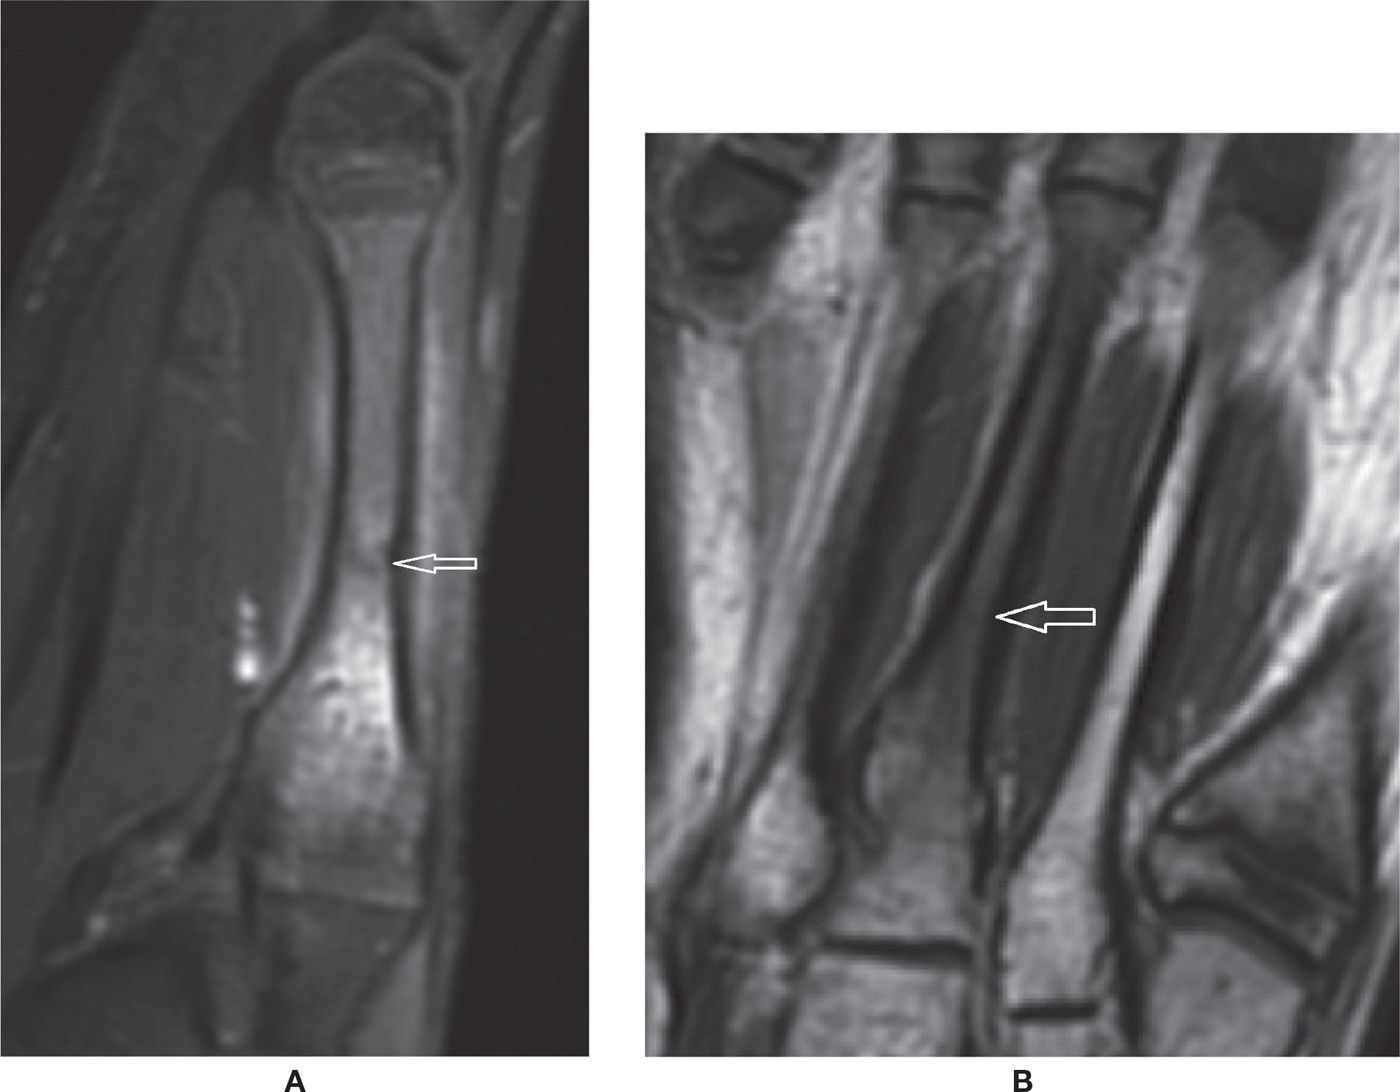
FIGURE 25-40. Acute metatarsal stress fracture. A: Sagittal PD-weighted sequence with fat saturation. B: Coronal T1-weighted sequence. Marked bone marrow edema and a visible subtle intramedullary perpendicular fracture line. There is mild surrounding soft tissues edema. The cortex is still preserved, without remarkable reactive focal thickening.
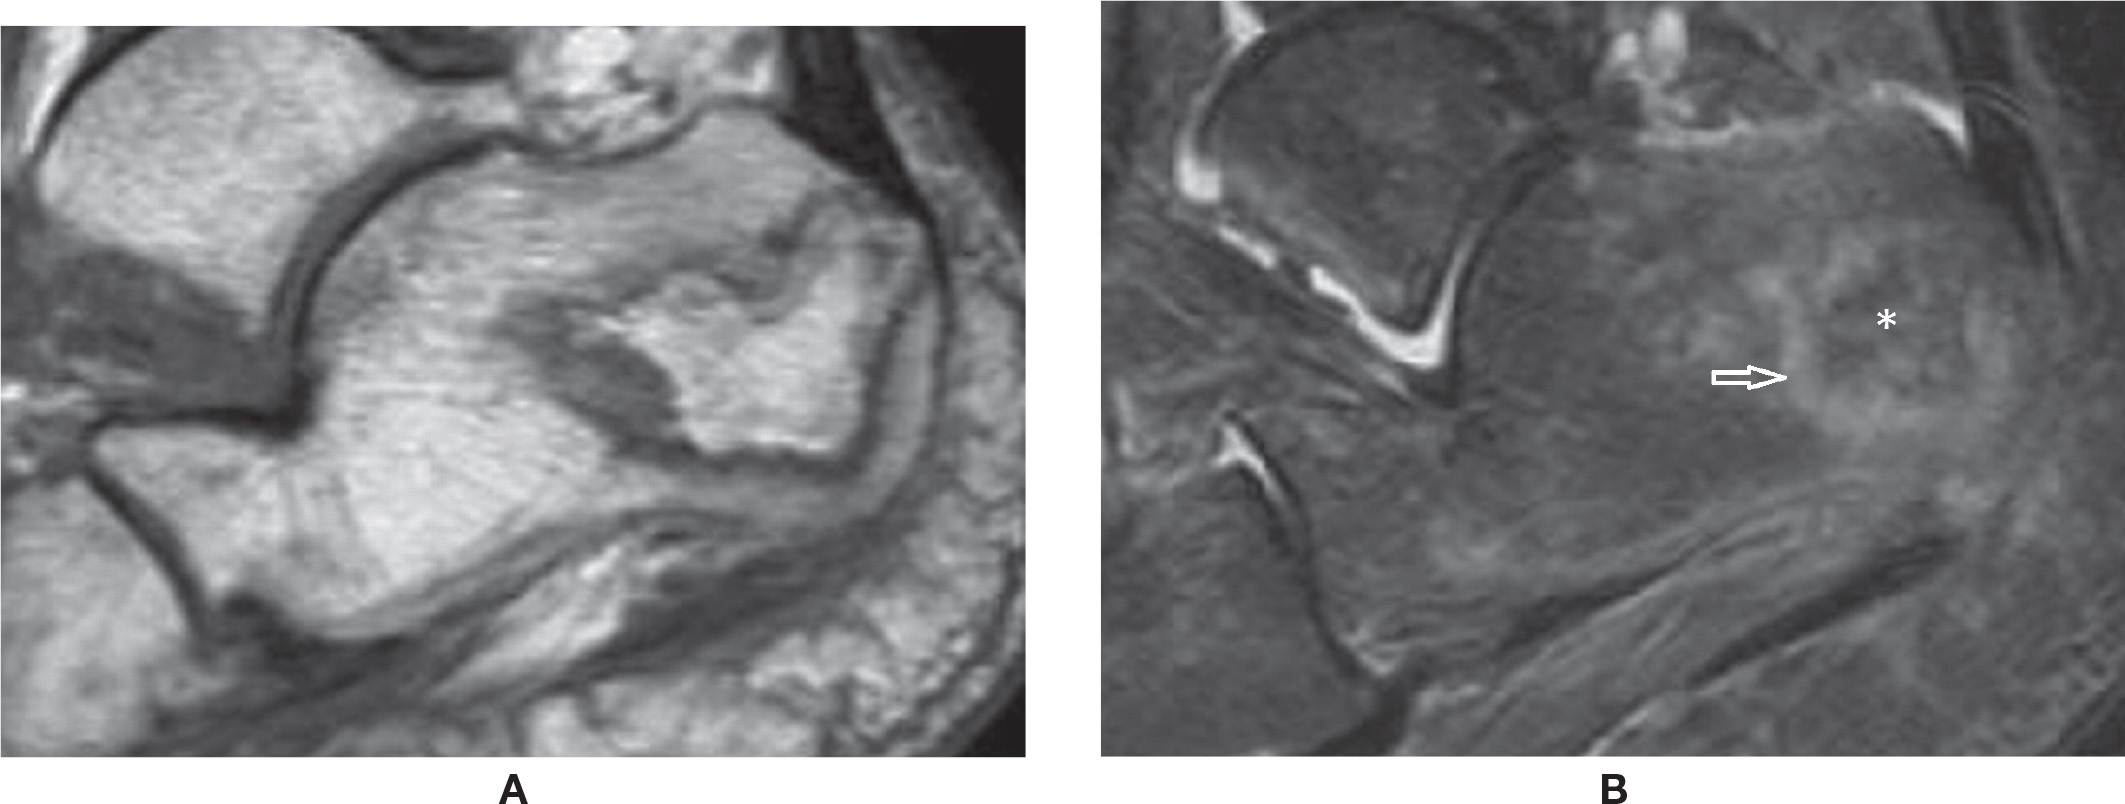
FIGURE 25-41. Calcaneal avascular necrosis. (A) Sagittal T1 weighted sequence. Well defined area within the calcaneal tuberosity with serpentine geographic margins and fat signal within it. (B) Sagittal T2 weighted sequence fat sat. The area of AVN is delimited by a high signal line (arrow), with fat attenuation within it (*).
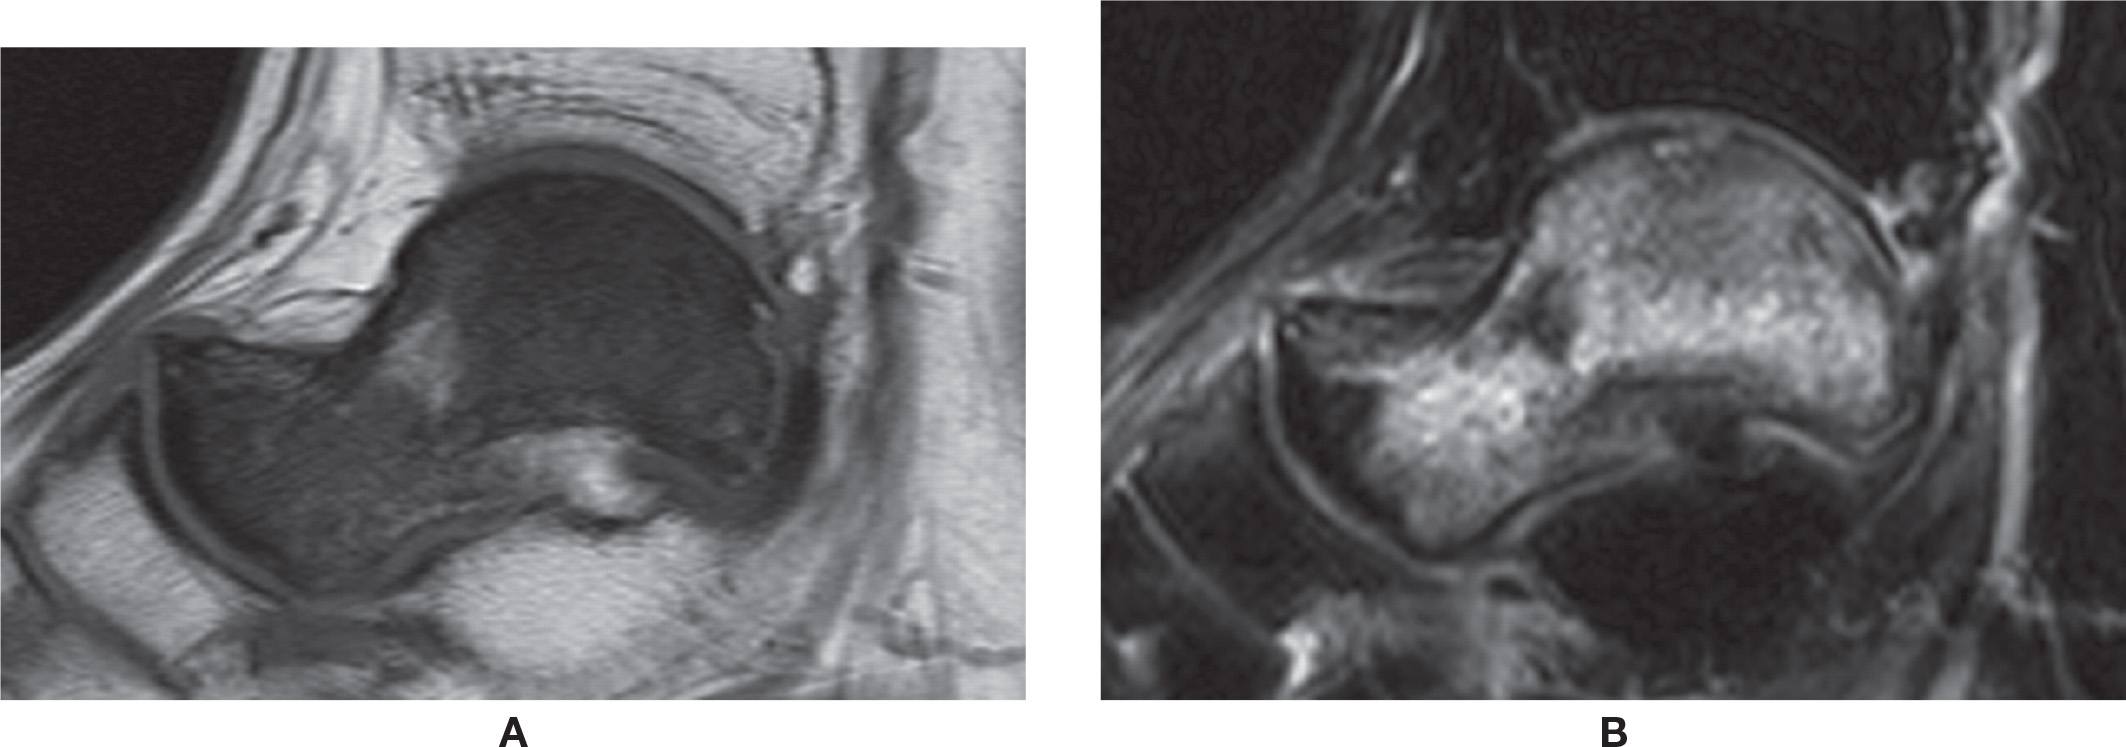
FIGURE 25-42. AVN of the talus. Unknown cause. A: Sagittal T1-weighted sequence. Diffuse low signal of the talus. B: Sagittal T2-weighted sequence with fat saturation. Diffuse high-signal intensity. Note associated small osteochondral lesion of the dome of the talus.
Some cases of necrosis are classified as osteochondrosis. Navicular osteochondrosis, also named Köhler disease, is seen in children between 3 and 7 years of age; it is characterized by a phase of destruction and then reconstitution of the bone with a final good prognosis. It is, however, not certain if this represents osteonecrosis, or more likely, an altered sequence of ossification or/and endochondral bone formation.81 The navicular is the last bone to ossify in the tarsus, what makes it particularly sensitive to biomechanical stress, suffering from the chronic pressure transmitted by its counterparts. In adults, spontaneous necrosis of the navicular is named Müeller–Weiss syndrome; this does not have a good prognosis and residual fragmentation or deformity may happen. Müeller–Weiss syndrome apparently has no relation with Köhler disease.82
The Freiberg infraction was classically described as a type of osteochondrosis of the head of the second or third metatarsal; it is seen in adolescents between 13 and 18 years of age, usually girls, although it is also seen in older women. This is now believed to be secondary to chronic biomechanical stress, subchondral fracture, and secondary flattening of the metatarsal head, usually the longer one, which receives most of the biomechanical forces of anterior transverse arch of the forefoot. The recurrence in women possibly is related to the wearing of high heels (Figure 25-43).
AVN of a sesamoid may be the result of chronic biomechanical stress. The spectrum includes bone marrow edema due to altered biomechanics or increased biomechanical stress, microfracture, fracture, and an association with AVN. Chronically, the necrosis will be characterized by low-signal intensity in both T1- and fluid-sensitive images.83
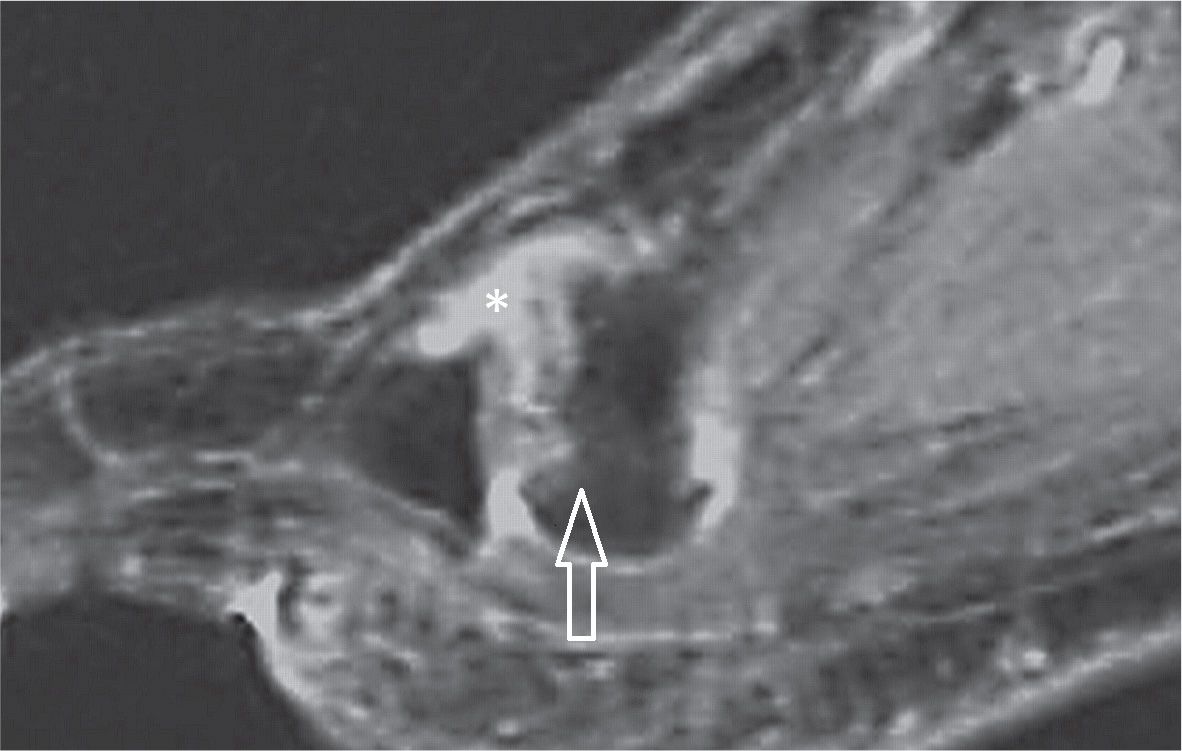
FIGURE 25-43. Freiberg infraction. Sagittal T2 weighted sequence fat sat. Marked irregularity and dorsal flattening of the second metatarsal head (arrow) with joint effusion (*).
Coalition
Tarsal coalition is characterized by the presence of an abnormal fusion of tarsal bones. A coalition may be constitutional/developmental, secondary to trauma or surgery, or even previous arthritis with residual deformity of bone and joint that may determine biomechanical change of the foot. Overall, the prevalence is approximately 1%, and approximately half of the cases may be bilateral. Coalition can be subclinical or associated with clinical findings, such as pain, flatfoot or cavus foot deformity, frequent sprains, spasm of the peroneus muscles, calcaneus valgus, abduction of the forefoot, and limited subtalar motion. Symptoms have been associated with progressive ossification of the coalition.69,84–86
Classically, coalition has been divided into two groups: osseous coalition, when there is bone marrow continuation between the bones; and nonosseous coalition, which includes a fibrous type and a cartilaginous type. Also, marked deformity of a joint with arthritis may mechanically behave and present clinically as a coalition. Coalition is more frequently seen in the talocalcaneal and calcaneonavicular joints. Potentially any other joint of the foot may be involved; calcaneocuboid, talonavicular, and other coalitions are rarely observed.
Evaluation with CT prompts an adequate morphologic study of the shape and dimension of the coalitions, and the evaluation of both feet together allows comparison. MRI demonstrates the coalitions with the advantage of characterizing the soft tissue abnormalities and bone marrow signal changes, and thus is particularly useful for nonosseous coalitions. Not infrequently a coalition is also detected at MRI when studying for another apparent source of symptoms in the ankle.87
The talocalcaneal coalition most often involves the medial subtalar joint, either with bone bridging (Figure 25-44A) or an abnormal shape of the joint (Figure 25-44B,C). The sustentaculum tali slopes downward, which may be dysplastic or hypoplastic, easily characterized on thin coronal plane cross-sectional acquisitions or reformats. Marked irregularity and subchondral cysts may also be indicative of a coalition. Other associated findings may be seen, such as a talar beak (defined as an osseous prominence of the anterodorsal aspect of the talus).86,88
The calcaneonavicular coalition is at present more often diagnosed,88 probably due to the increased number of cross-sectional studies that are performed (Figure 25-45A). In the majority of cases, it is nonosseous with an evident area of apposition of the bone cortex, either due to a prominent anterior process of the calcaneus (“anteater sign”), an anterolateral prominence of the navicular (“reverse anteater sign”), or both at the same time. Other criteria include a visible joint line, characterized as a vertical image in the sagittal plane or visible apposition of the bones on axial images. On CT, cartilaginous coalition is suspected when there are subchondral cysts in the apposed bone margins, and a fibrous coalition if there is subchondral sclerosis. On MRI, high signal in the fluid-sensitive sequence represents cartilaginous coalition (Figure 25-45B,C); low-signal intensity between them in both fluid-sensitive and T1-weighted images represents a fibrous coalition (Figure 25-45D,E).85,86 Bone marrow edema likely indicates biomechanical stress. Many times, however, these findings are isolated and without definite clinical manifestations.
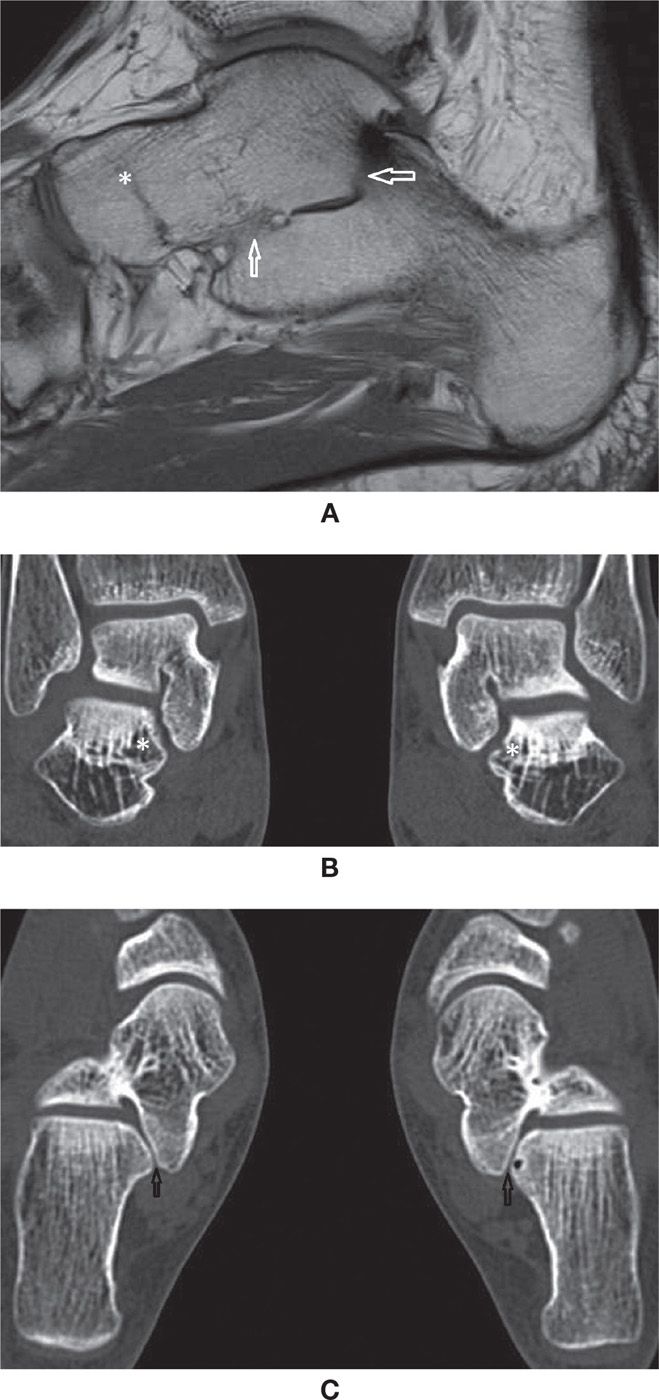
FIGURE 25-44. Talocalcaneal coalition (A) Sagittal T1 weighted sequence. Osseous talocalcaneal coalition. Obliteration of the medial and posterior subtalar joints with bone marrow bridging (arrows). Also there is talonavicular coalition (*), with complete fusion of the bones and just a minimal residual evidence of the joint line; (B) Multislice CT coronal reconstruction (1mm). Abnormal shape of the medial subtalar joint. Downsloping of the sustentaculum tali (*) with angular deformity of the joint. Note the symmetry of the abnormality. The field of view include both feet to facilitate comparison. (C) Axial multislice CT axial reconstruction (1mm). Same patient as in B. Again the abnormal shape of the medial subtalar joint is observed (arrows). In this case the joint surfaces are smooth. Note the normal posterior subtalar joint facets.
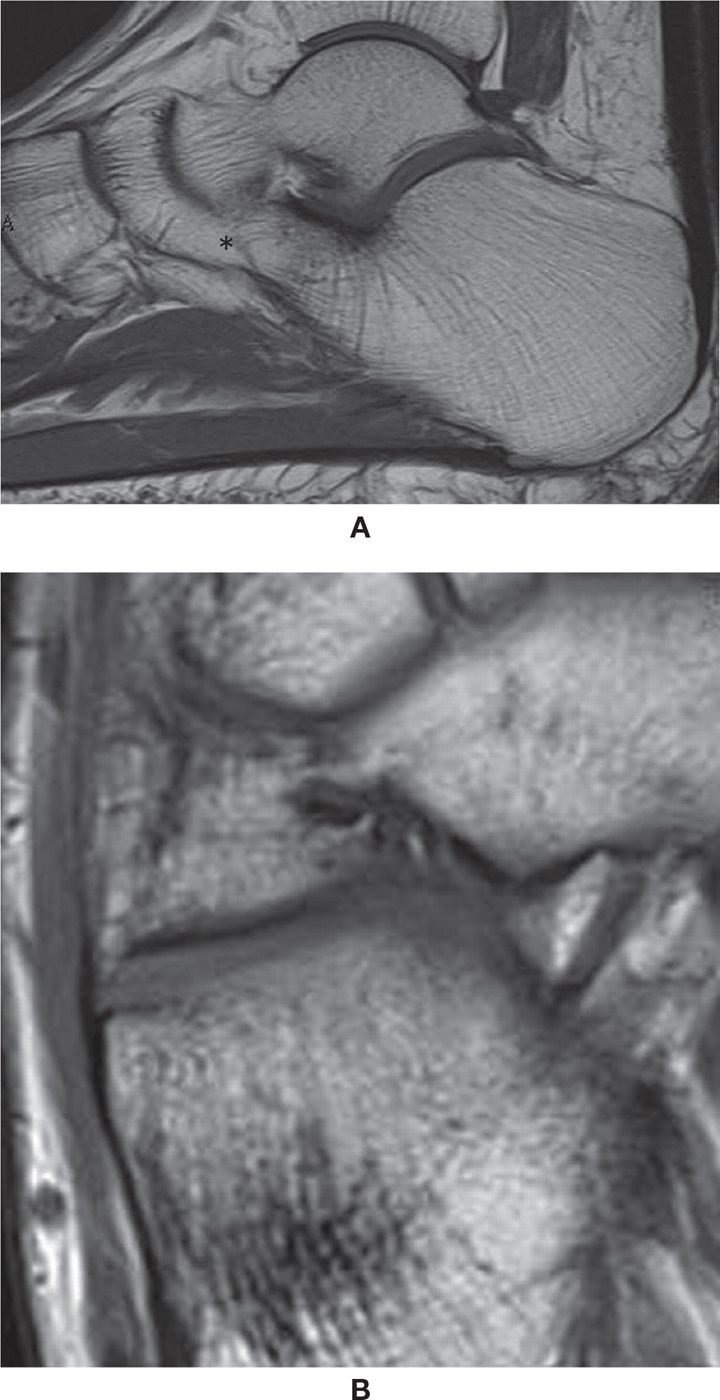
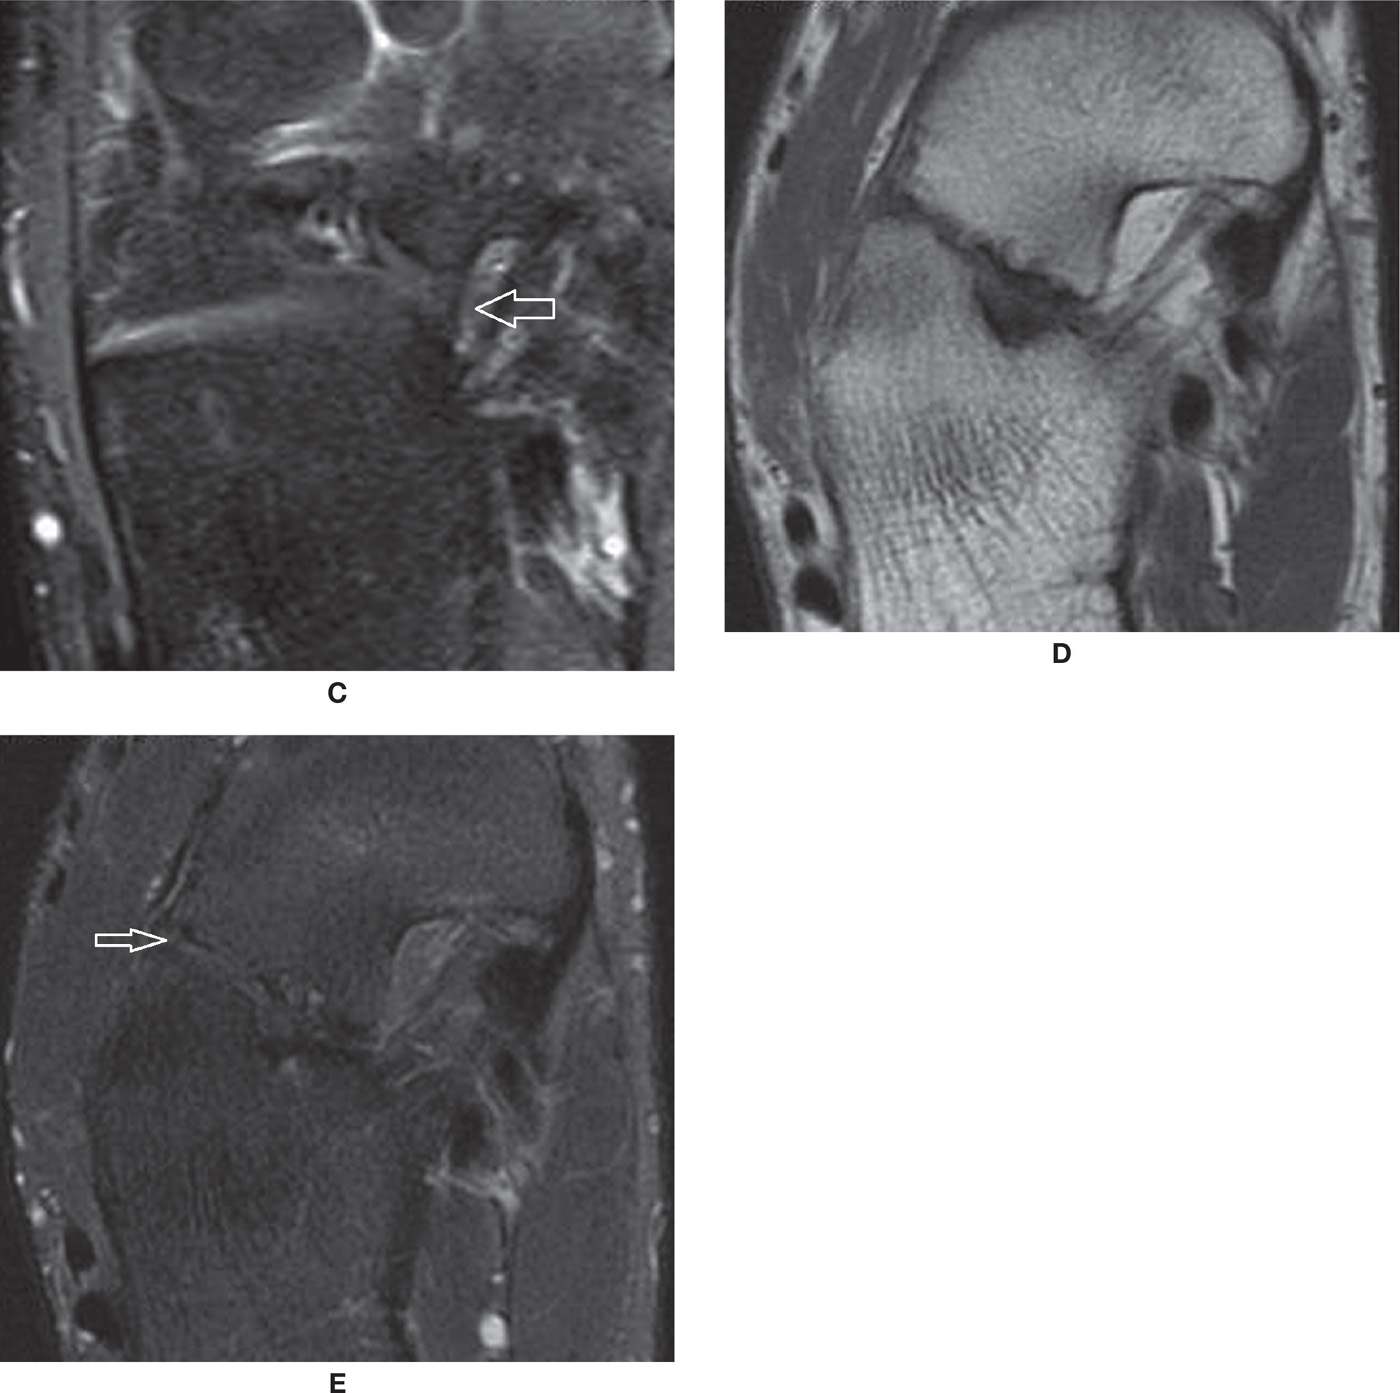
FIGURE 25-45. Talonavicular coalitions- (A) Bone talocalcaneal coalition (*); (B) and (C) Axial T1 and PD fat sat weighted sequences. Cartilaginous talonavicular coalition. Note the cartilaginous tissue interposed between the calcaneus and navicular with high signal in PD and intermediate signal in T1 (arrows); D and E – Axial T1 and PD fat sat weighted sequences. Fibrous coalition (arrows). Marked cortical irregularity and low signal between the prominent anterior process of the calcaneus and the navicular.
JOINTS
Osteoarthritis
Osteoarthritic findings in the foot are often characterized by asymmetric joint space narrowing, subchondral cyst, subchondral sclerosis, and osteophyte formation; less commonly, joint effusion and synovial reaction, capsular and periarticular edema and eventual osteochondral fragmentation with intra-articular bodies and subchondral fractures and deformity are associated. The most frequent site of pedal OA is the first metatarsophalangeal joint, which is the main center of transmission of forces between the ground and body during gait.89,90 These findings are also frequently observed simultaneously in the metatarsosesamoid joints (Figure 25-33). One relevant characteristic condition happens when a osteophyte is developed at the dorsum of the first metatarsal head, preventing adequate dorsiflexion (hallux rigidus) (Figure 25-46). As a consequence, there is extension-increased stress over the first interphalangeal joint and an associated subungual hematoma.
The talonavicular, the other midtarsal, and the tarsometatarsal joints are frequently sites of milder OA changes. If however they are pronounced, an underlying previous traumatic injury to bones, tendons or ligaments, or an underlying systemic disease should be suspected. The tibiotalar joint is extraordinarily resistant to OA changes, thanks to the complex mechanism of stability, unless there is previous injury with likely instability or overuse. OA changes are frequently found in CT or MRI studies of the foot, and the latter can help to evaluate associated soft tissue conditions.89 However, the studies are not typically primarily indicated to evaluate OA, as it can be diagnosed clinically and radiographically.
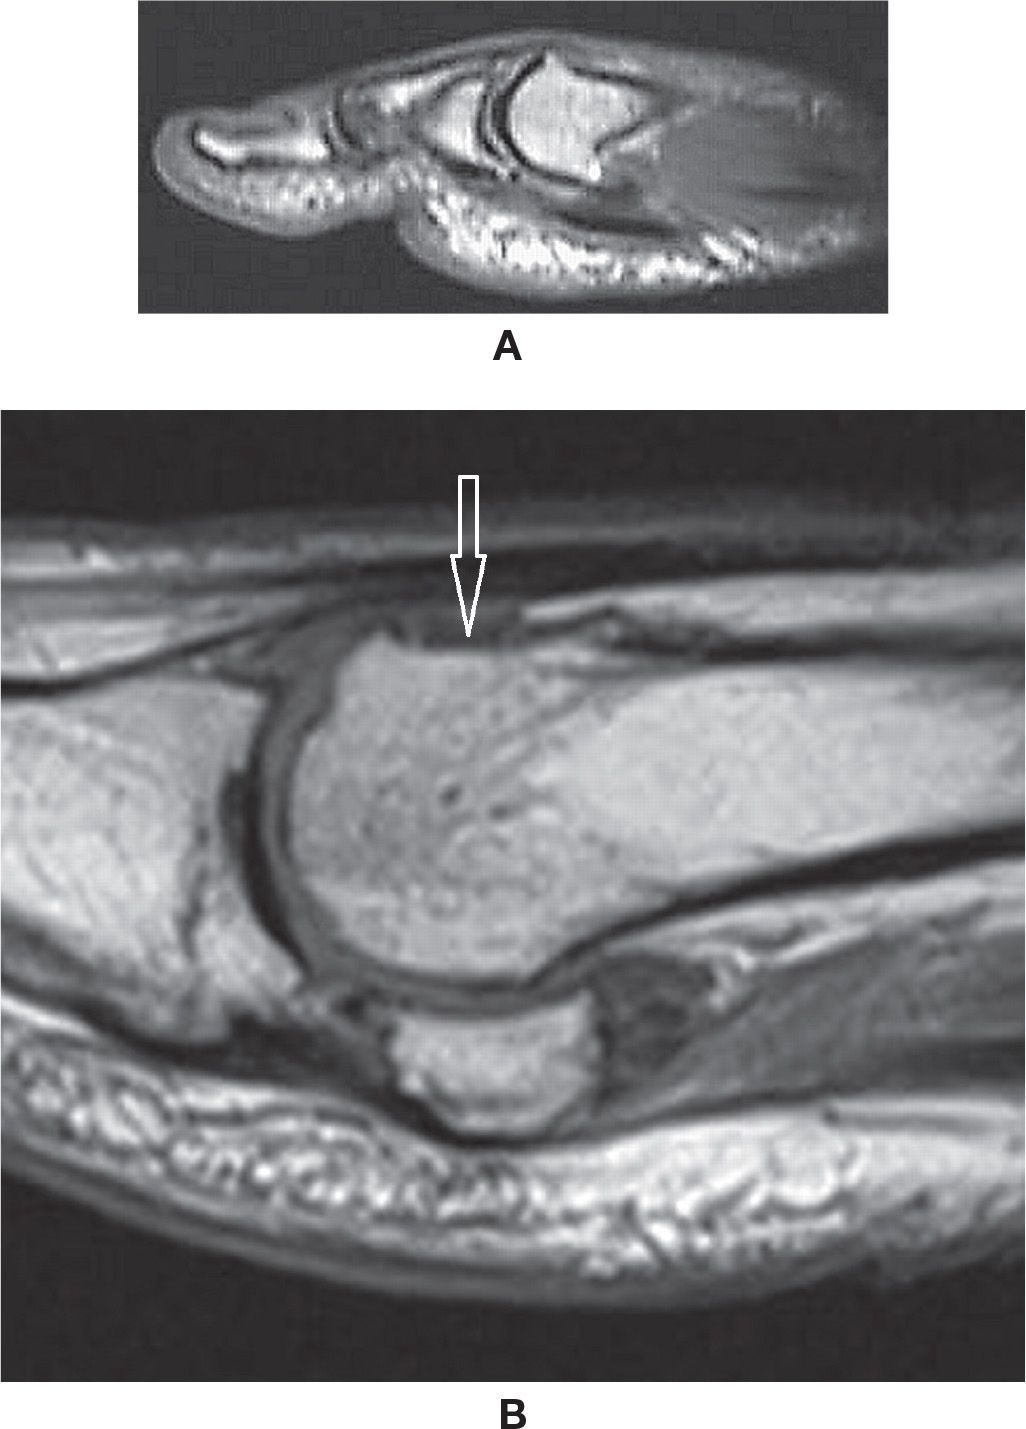
FIGURE 25-46. Hallux rigidus- (A) Dorsal osteophyte at the first metatarsal head (Sagittal T1 weighted sequence). (B) Post resection of dorsal osteophyte (Sagittal T1 weighted sequence, different case from A). Post-operative flattening of the dorsum of the head of the first metatarsal (arrow). Note also degenerative peripheral osteophytes at the first metatarsophalangeal and metatarsosesamoidal joints.
Inflammatory Arthritis
Rheumatoid arthritis frequently involves the feet. Bilateral joint involvement can potentially cause major articular changes including effusion with synovitis and pannus formation, symmetric joint space narrowing, marginal erosion, subchondral erosion, and bone marrow edema. Typically, the metatarsophalangeal and hallux interphalangeal joints are involved; other sites may include the tarsometatarsal, talonavicular, and talocalcaneal joints. The simultaneous involvement of these two latter joints is relatively specific for rheumatoid arthritis.89 Other possible findings include joint deformity due to capsular laxity and architectural change and, if untreated, evolution to fibrous ankylosis of the joint, hammer, and claw toes. The findings progress with a background of periarticular osteoporosis, eventually aggravated by steroid treatment. In severe cases, the patient may necessitate surgical intervention to restore adequate ambulation.
Although the disease is usually adequately evaluated clinically and with the aid of radiography, MRI can be used, as it is more sensitive to detect the earliest changes; it can also help to determine ongoing inflammatory activity within the joints. Fluid-sensitive sequences will demonstrate joint effusion and capsular or periarticular edema, as well as subchondral bone signal changes. Postcontrast T1-weighted sequences, typically with fat signal suppression or equivalent techniques, will demonstrate synovitis. Also, other relevant associated soft tissue changes may be characterized, such as peritendinitis and tenosynovitis, particularly involving the PTT (with possible tear) and the extensor tendons. Achilles tendinopathy, retrocalcaneal bursitis, and rheumatoid nodule (observed at points of chronic microtrauma such as the extensor aspect and the heel) are other findings.89,91
Seronegative Spondyloarthropathies
Inflammatory arthropathy may demonstrate severe involvement of the feet.
Reactive arthritis typically involves the feet, with asymmetric metatarsophalangeal and first interphalangeal joint synovitis, without pannus. Other findings include PTT, FHL and FDL tenosynovitis, retrocalcaneal bursitis, and erosions at entheses with bone marrow edema, for example, at the malleoli and base of the fifth metatarsal.
Psoriatic arthritis affects the forefoot symmetrically or asymmetrically, typically involving the metatarsophalangeal and first interphalangeal joints. The distribution may have a ray pattern and lead to severe destruction. Sausage digit, with diffuse soft tissue edema on MRI, is a typical finding. Associated tendinous change, including tenosynovitis, tendinopathy, and rupture, may also be found, particularly affecting the Achilles tendon with retrocalcaneal bursitis.
Ankylosing spondylitis mostly affects the hindfoot, but is rarely associated with Achilles tendonitis (and less frequently with bursitis), associated with erosions and enthesophytes. Radiography is the usual modality for imaging these arthritides, but MRI may contribute for characterization of active synovitis and determining other soft tissue changes.92–95
Gout
Gout is most frequent in men over the age of 30 years. Monoarticular involvement of the first metatarsophalangeal joint is typical, although any other joint can potentially be involved. Joint effusion and synovitis can be observed in MRI, but are not specific. Tophaceous gout represents a chronic phase of the disease, and gouty tophi may sometimes be a pseudotumoral lesion of bones. They can be observed almost anywhere, but more frequently at the first metatarsophalangeal joint and Achilles tendon.
On MRI, findings include lesions with well-defined margins and characteristic intermediate-to-low-signal intensity in T1-weighted sequences; there is variable signal in the fluid-sensitive sequences, with low-signal regions and enhancement in T1-weighted sequences with intravenous paramagnetic contrast (Figure 25-47). Frequently, there are multiple areas of involvement, with possible marked surrounding soft tissue edema and eventual arthritis. Multiple periarticular erosions with sharp and overhanging margins may be observed in a nonspecific distribution96,97 (Figure 25-48). Cases of gouty arthritis with only synovitis and periarticular edema can also be observed, without specific characteristics on cross-sectional imaging.
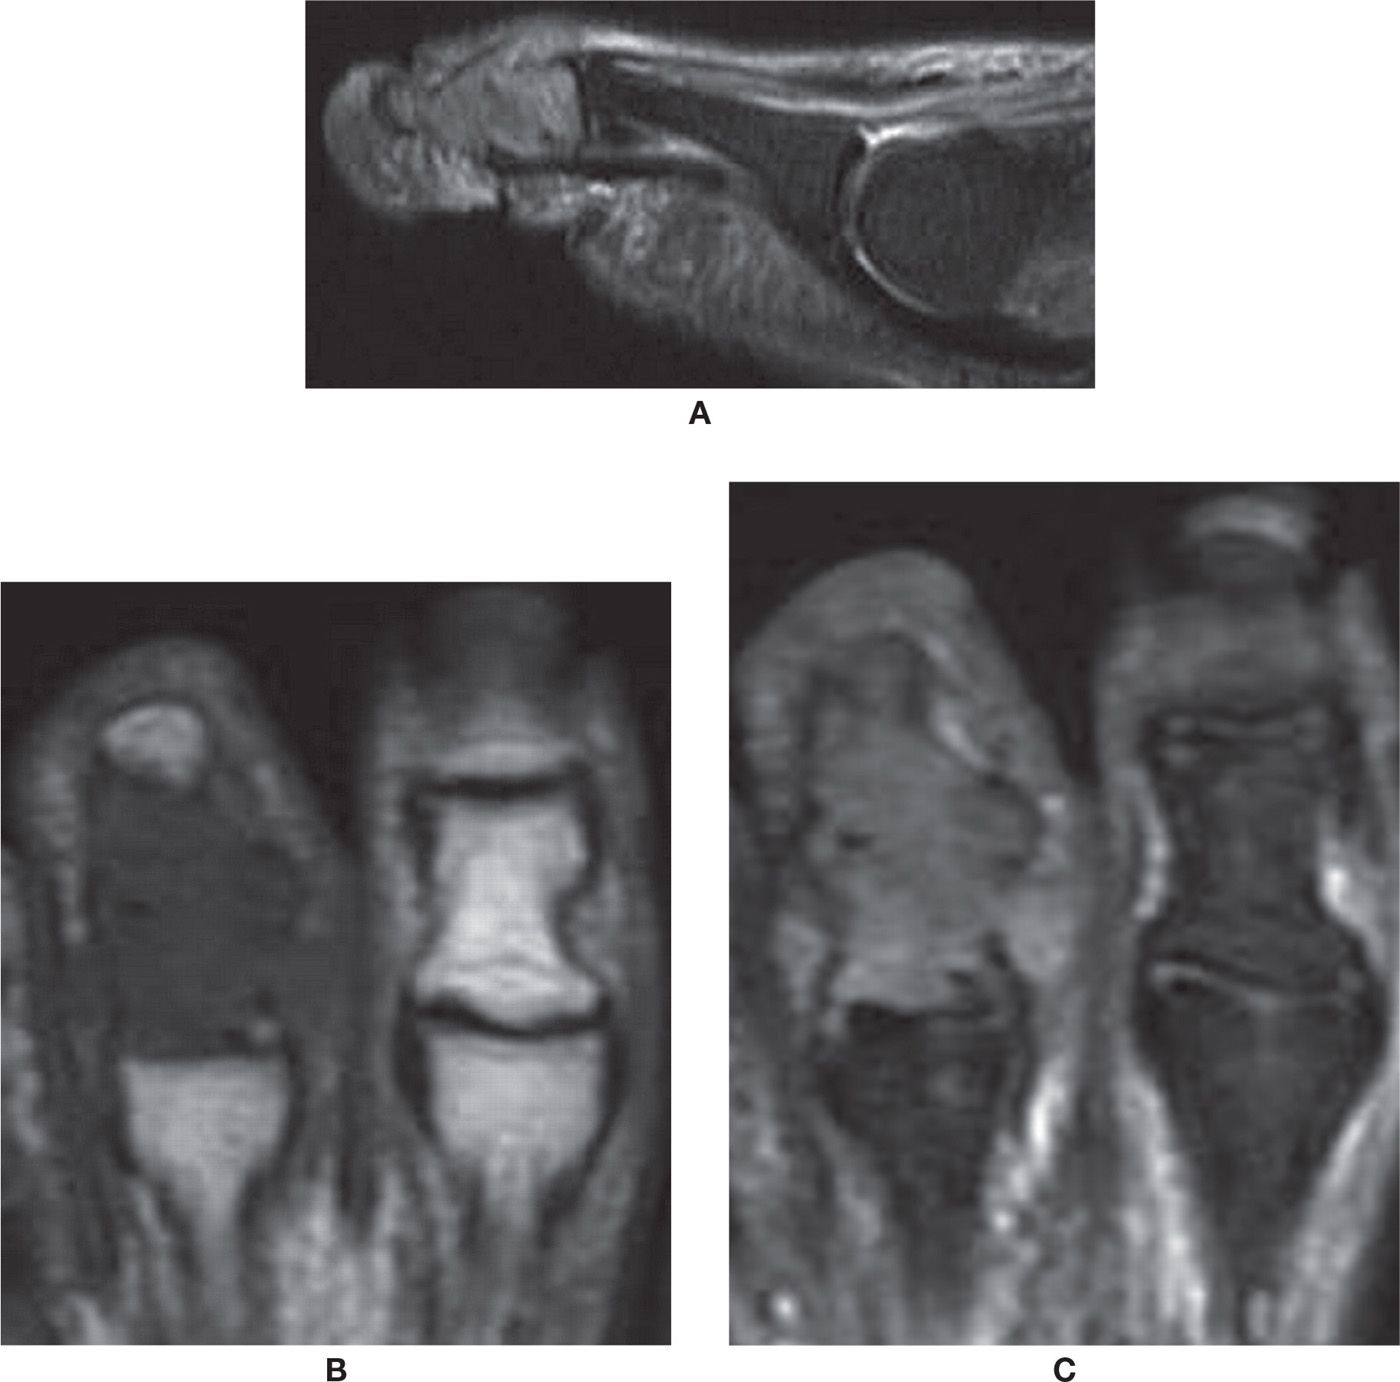
FIGURE 25-47. Tophaceous gout. A: Sagittal PD-weighted sequence with fat saturation. Tophus with high signal involving the middle and distal phalanges and the distal interphalangeal joint with bone expansion. B: Axial T1-weighted sequence. The tophus has low-signal intensity in T1. Note the adjacent normal toe. C: Axial PD-weighted sequence with fat saturation.
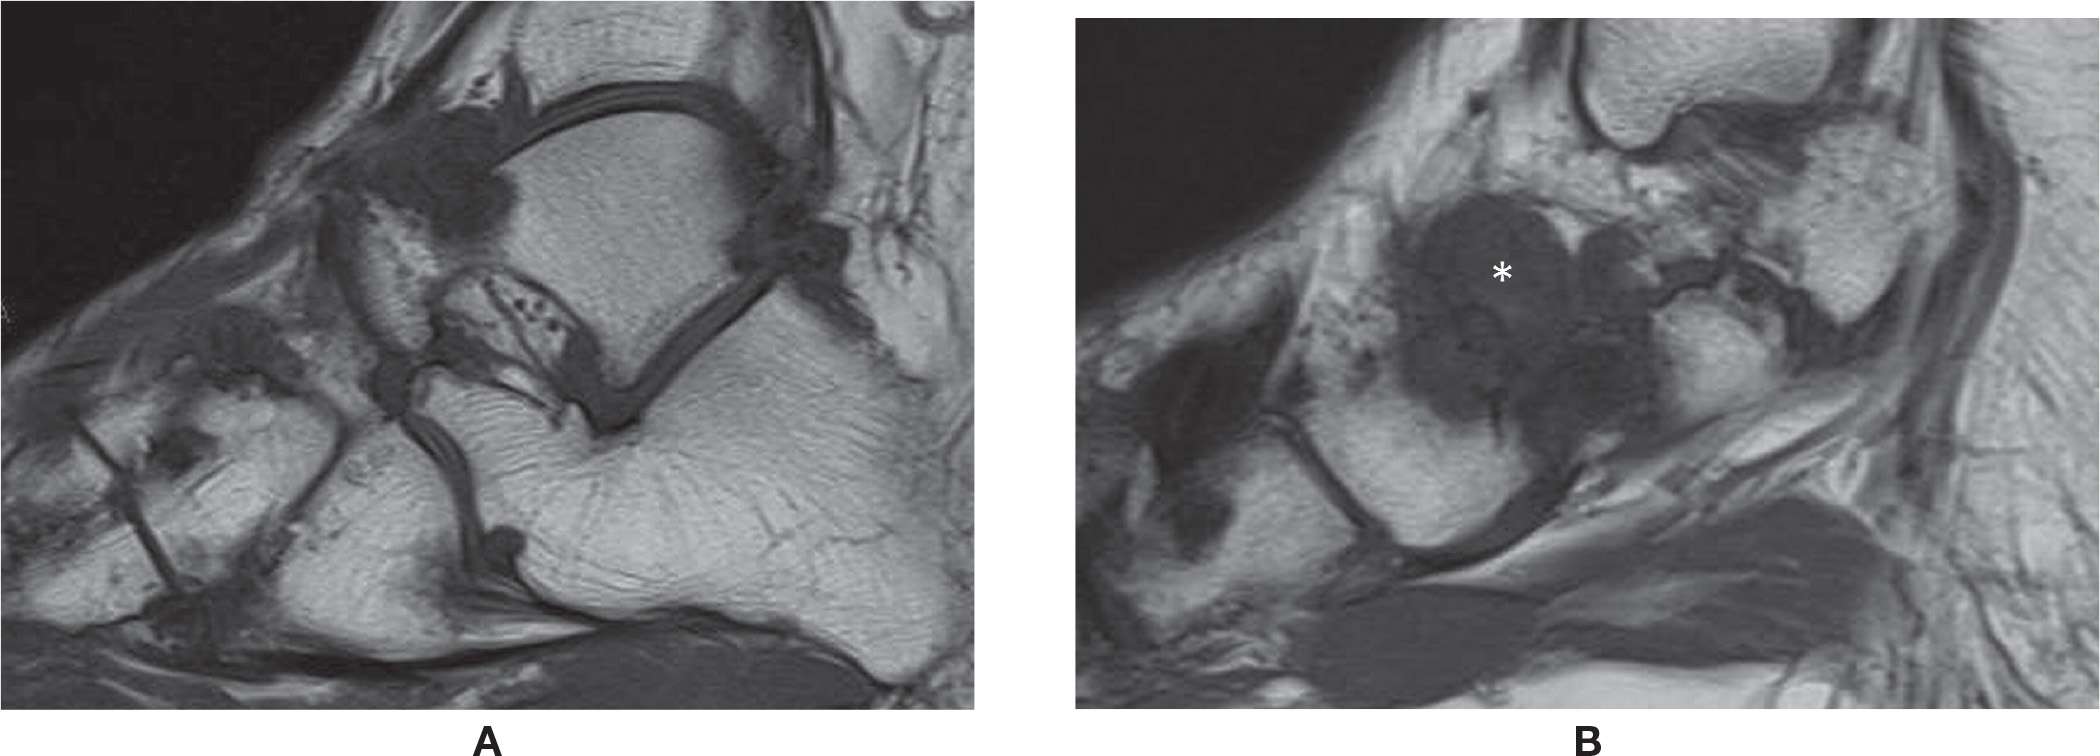
FIGURE 25-48. Tophaceus gout (hind and midfoot). A and (B) Sagittal T1 weighted sequence. Multiple lytic periarticular lesions with low signal intensity and overhanging margins. Large tophus adjacent to the talonavicular joint (*).
Neuroarthropathy and the Diabetic Foot
Foot neuroarthropathy is common and becoming even more so. The most common type is Charcot-type arthropathy of the midfoot associated with diabetes. As a major public health issue, diabetic patients will eventually develop enough macro- and microvasculature arteriosclerotic changes to compromise the arterial vascular flow of the foot and also involve the vasa-nervorum with neuropathy. The combination of vascular and neurologic impairment with loss of sensation and progressive motor abnormality with myopathy and muscle fatty infiltration will result in arthropathy and architectural abnormalities; hammertoes, claw toes, hallux valgus, rocker-bottom deformity, and bony prominences may facilitate the development of ulcer. An acute onset of Charcot neuropathic osteoarthropathy (CN) may simulate infectious arthritis, acute gout, and complex regional pain syndrome (Figure 25-49). In other cases, an indolent progression of arthropathy may be observed. Ulcers may develop due to vascular and sensitivity impairment at usual points of pressure of the forefoot or calcaneus or about new deformities or bone excrescences. If there are deep ulcers, there is a risk of osteomyelitis and infectious arthritis, which should be treated accordingly. Eventual surgical resection may need to be performed to reconstruct or correct foot and to restore weight bearing.
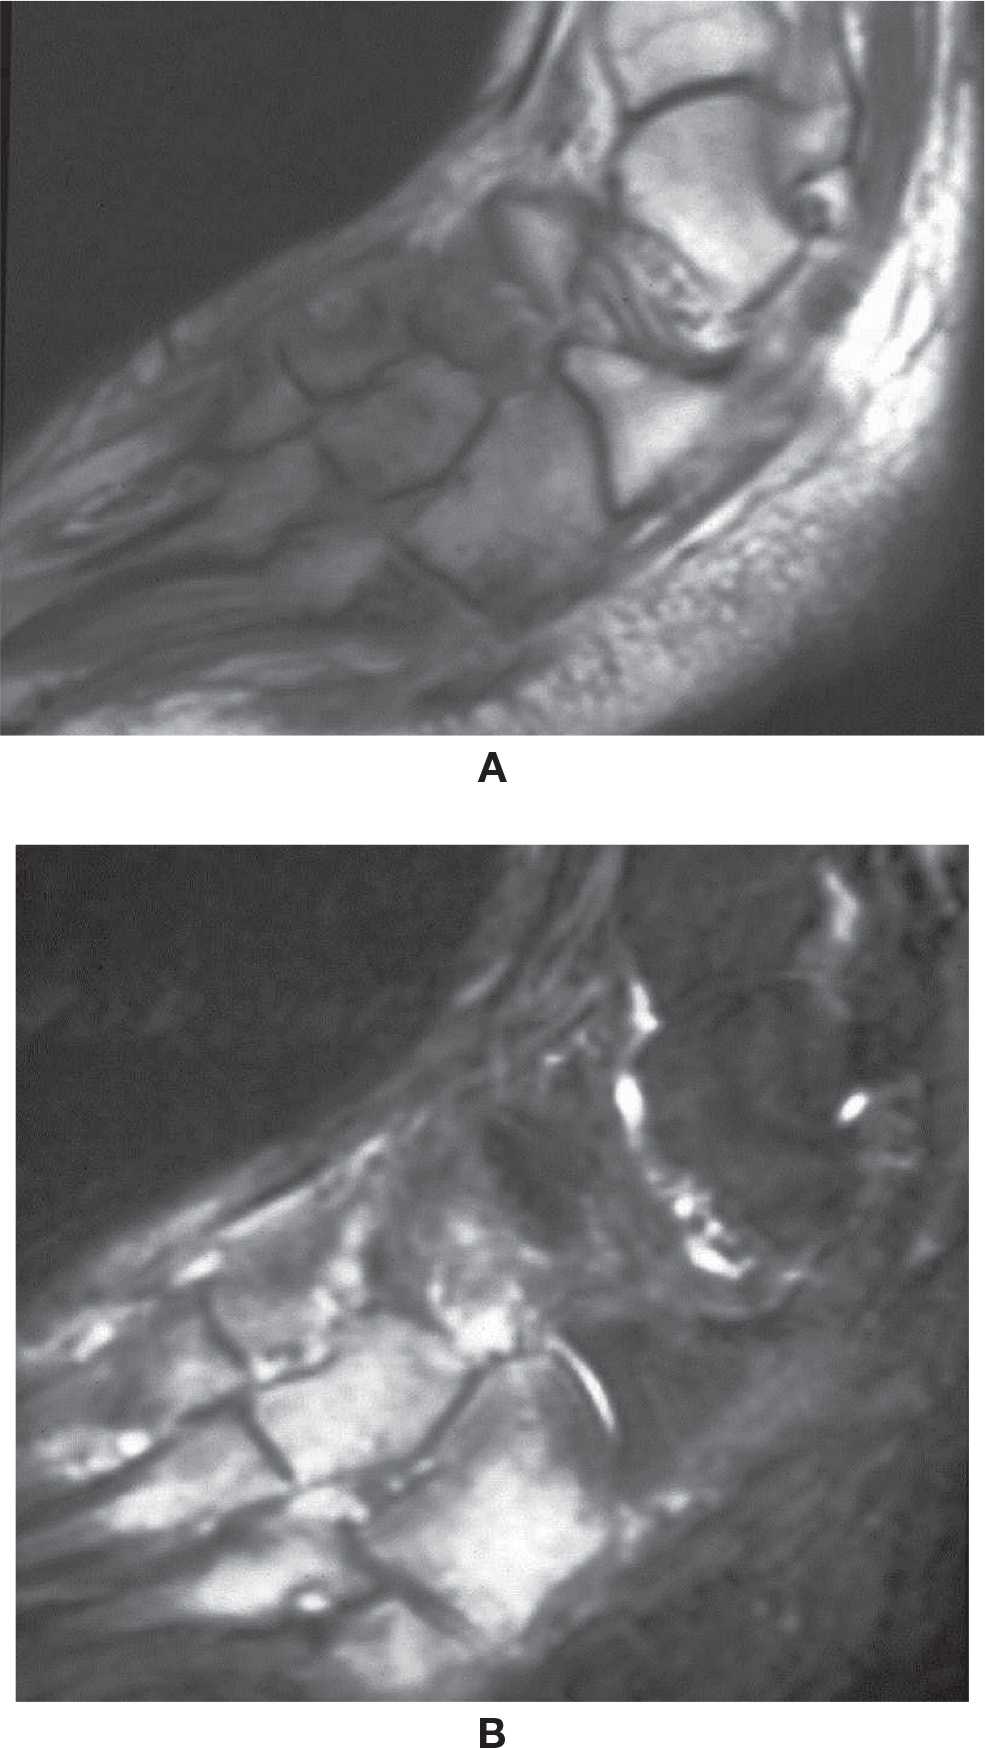
FIGURE 25-49. Acute Charcot foot. Sagittal T1- (A) and T2-fat-saturation- (B) weighted sequences. Midfoot bone marrow and soft tissue edema.
Radiography is used to demonstrate the degree and type of joint involvement, deformity, and allow longitudinal assessment. It is also used pre- and postoperatively. CT may be helpful to determine the exact bone anatomy in more severe cases.
MRI may help identify CN and osteomyelitis with high sensitivity but not always with high specificity. Typical findings are marked bone marrow edema in fluid-sensitive sequences, with corresponding low signal on T1-weighted sequences; there is almost no distinction between bone marrow and cortical bone. The “ghost sign” is characterized by relative absence of bone visualization in T1, while bone is visible in the fluid-sensitive images due to bone marrow edema. Bone-centered signal changes located close to a deep ulcer indicate osteomyelitis (Figure 25-50). In the absence of an ulcer extending from the bone surface, the likelihood of osteomyelitis is low. The use of paramagnetic intravenous contrast may help to evaluate fistula, tract, and abscess in the soft tissues and bones. However, nephrogenic systemic fibrosis may be associated with the use of certain gadolinium chelates in patients with severe renal disease (a not infrequent subgroup of diabetic patients), which results in restriction for use of this type of contrast. In conclusion, MRI is one of the most helpful tools for evaluation of diabetic foot osteomyelitis.98
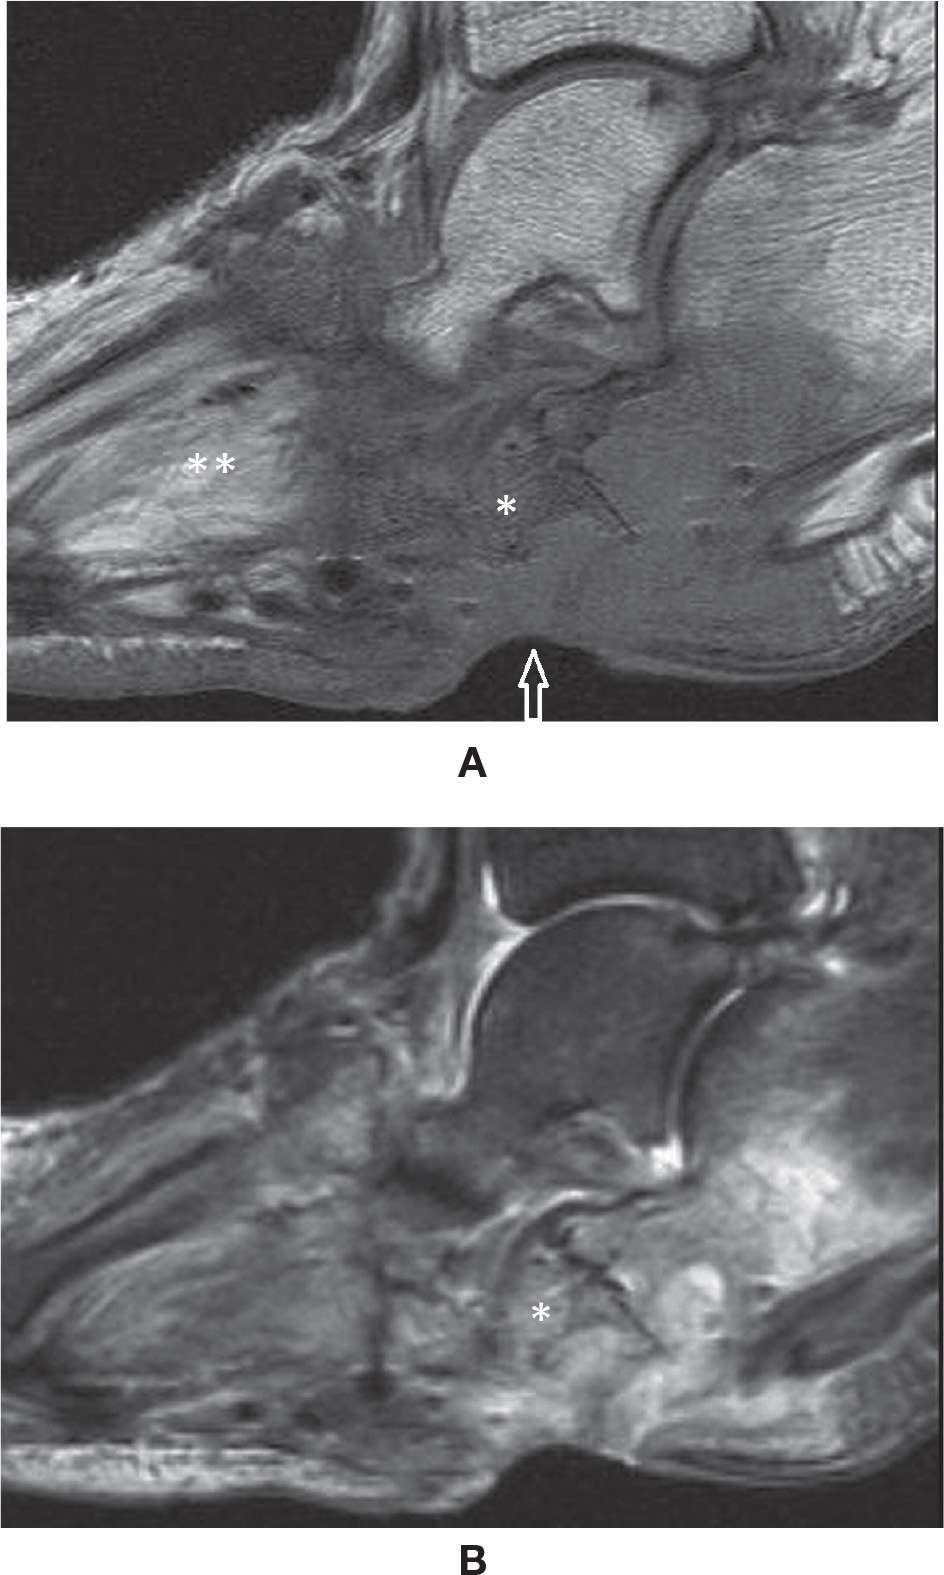
FIGURE 25-50. Diabetes – Ulcer associated with osteomyelitis. Ghost sign. (A) Sagittal T1 weighted sequence demonstrating an ulcer (arrow) extension to the cuboid and calcaneus, with marked low signal intensity of the bone marrow, almost with indistinction of the cuboid (*). Note the fatty infiltration within the intrinsic muscles (**); (B) Sagittal T2 weighted sequence fat sat. Bone marrow edema and ulcer are observed. The cuboid (*) is better delineated (ghost sign). Note cuboid and calcaneus cortical rupture.
SYNDROMES
Complex Regional Pain Syndrome
The exact etiology of complex regional pain syndrome is unknown, but it results in pain, swelling, and vasomotor dysfunction. It may be spontaneous or an abnormal physiologic response of an extremity to trauma, microtrauma, surgical procedure, soft tissue injury, infection, or neoplasm.99
There is clinical spectrum of complex regional pain syndrome. In the acute phase, there is diffuse pain, swelling, hyperhidrosis, redness, or hypothermia. It lasts approximately 3 months and can be followed by a subacute phase, which lasts approximately 9 months with increasing severity of pain and swelling. The redness and hyperhidrosis may progressively become pallor and dry skin. In the chronic phase, approximately 1 year after onset, there are possible irreversible changes, including a dry cold and pale skin, deformity, and stiffness of joints. Others divide the clinical symptoms into a warm phase and a cold phase.99–101
Regional osteoporosis may be progressively observed radiographically, paralleling the clinical findings during the initial phases. Radiographs demonstrates spotty osteopenia at the ends of long bones initially and later in subperiosteal areas. Bone scan demonstrates periarticular uptake in the initial phase of the disease with increased uptake in the blood pool and delayed images.
MRI with intravenous gadolinium may demonstrate skin thickening and soft tissue edema with mild enhancement in the initial stage of the disease, also seen frequently with joint effusion. In the chronic phase, muscle atrophy can also be appreciated. Bone marrow signal changes are atypically found and should raise the suspicion for associated pathology. In late stage disease, less enhancement and edema is seen and muscle atrophy predominates. The findings are notably asymmetric.102–106
Tarsal Tunnel Syndrome
The tarsal tunnel is localized at the posteromedial aspect of the ankle and the medial-plantar aspect of the foot; it is divided into upper and lower compartments. It is delimited superiorly by the deep aponeurosis of the leg and inferiorly by the flexor retinaculum and abductor hallucis muscle. The posterior and posteromedial aspects of the distal tibia and talus, the inferomedial aspect of the navicular, and the medial aspect of the sustentaculum tali and calcaneus form the floor of the tarsal tunnel. This space contains the tibialis posterior, FDL, and FHL tendons, and the posterior tibial neurovascular bundle. Neuropathy may occur due to irritation of the nerve or its branches in this space; this may be due to the presence of anomalous space-occupying lesions or anatomic structures, such as a variant muscle, tumor, tenosynovitis, ganglion cyst, or varicosity (rare). The neuropathy may clinically present as plantar pain, tenderness at the medial aspect of the ankle, and sensory impairment; there is a positive Tinel sign. Clinical and electroneuromyographic examination can determine the diagnosis; cross-sectional imaging studies can provide adequate anatomic analysis. MRI, in particular, is advantageous over CT when examining tarsal tunnel anatomy and intrinsic neural abnormalities; findings include increased signal in fluid-sensitive images, particularly with strongly T2-weighted sequences, and changes in nerve diameter, with thickening or compression (Figure 25-51). Perhaps, the major role of MR is to determine if an underlying mass or tumor is present.107,108
Sinus Tarsi Syndrome
The sinus tarsi is a cone shaped space localized between the talus and the calcaneus; its base is lateral, and its apex is at the anterior margin of the posterior talocalcaneal joint. It basically contains fat, ligaments (cervical and interosseous talocalcaneal), the insertion of the inferior extensor retinaculum, and neural proprioception and vascular structures. Normally the fat within the sinus tarsi is well characterized in cross-sectional imaging studies. Signal abnormalities associated with sinus tarsi syndrome include high or low signal in fluid-sensitive images, particularly low signal in T1-weighted sequences, and enhancement with intravenous gadolinium. Also, ligamentous tear, ganglion cyst, tumor (such as pigmented villonodular synovitis [PVNS]), and even gout with pannus formation may be observed. Clinically, there may be lateral pain at the sinus tarsi; this may be associated with previous trauma, calcaneal valgus, flatfoot deformity, PTT insufficiency, and plantar fasciitis, as well as other space-occupying lesions (Figure 25-52).107,108
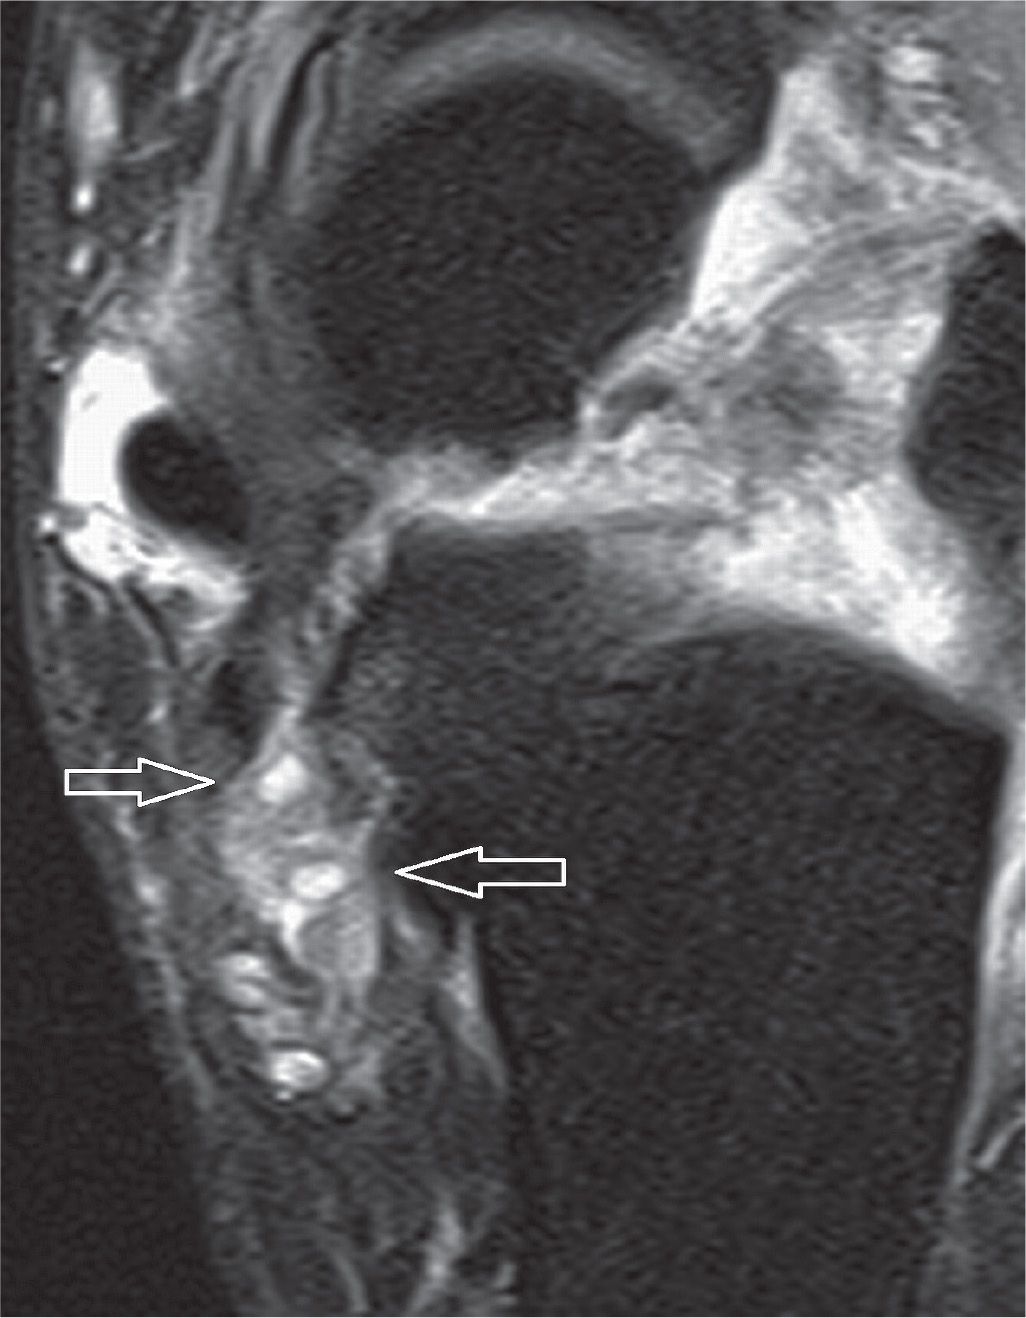
FIGURE 25-51. Patient with tarsal tunnel syndrome clinically with positive findings in the electroneuromyography. Axial PD-weighted sequence with fat saturation. The arrows indicate small cystic images within the tarsal tunnel, adjacent to the medial subtalar joint, which has degenerative changes (note small osteophyte and marrow edema). Intrinsic high signal and fluid surrounding the branches of the posterior tibial nerve. Also observe tenosynovitis of the posterior tibialis and edema within the sinus tarsi.
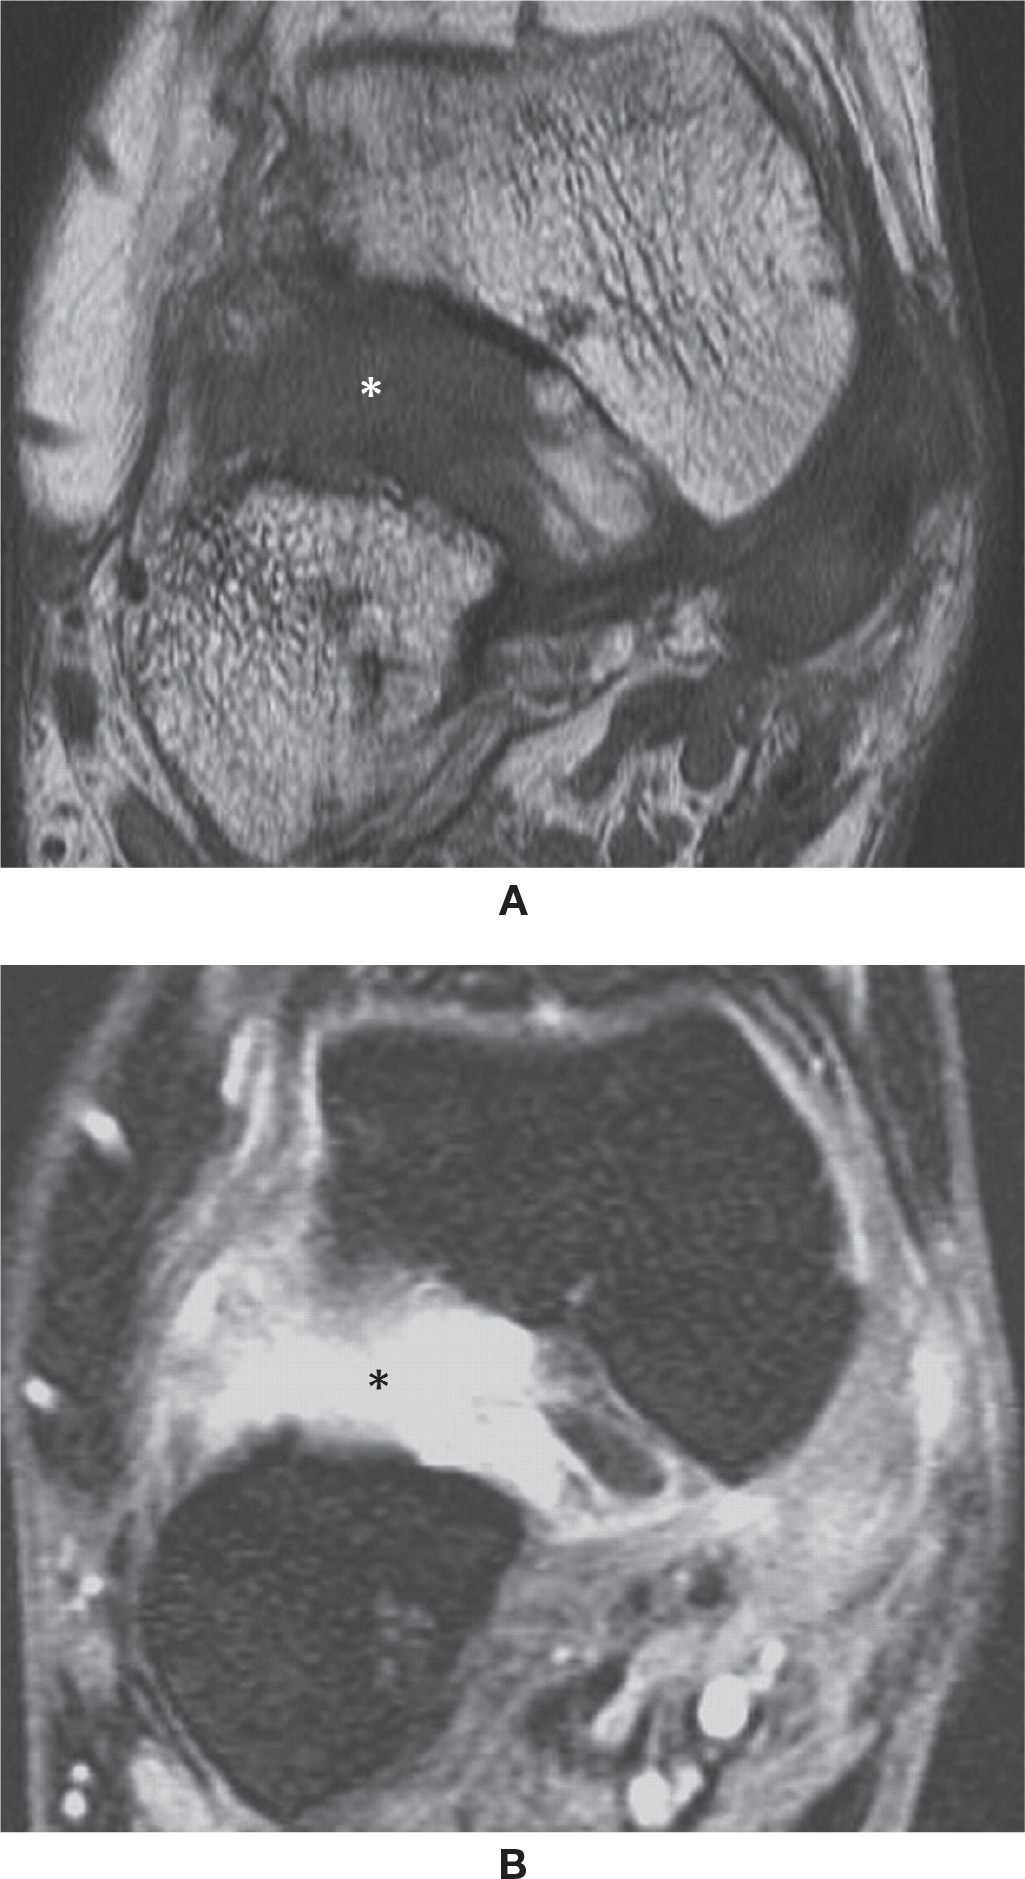
FIGURE 25-52. Sinus tarsi syndrome – (A) Diffuse sinus tarsi (*) low signal in T1 (Coronal T1 weighted sequence) (B) High signal (*) in the fluid sensitive sequence (Coronal T2 weighted sequence fat sat).
Plantar Plate
The plantar plates are fibrocartilaginous structures along the plantar aspects of the metatarsophalangeal and interphalangeal joints; they have a subtle triangular shape, perfectly adjusted to fit the plantar aspect of the bone epiphysis. They are embedded with the joint capsule and help to absorb impaction, stabilize the joint, and prevent abnormal extension. The plantar plate has low-signal intensity in all MRI sequences, as does all other fibrocartilage. However, chronic microtrauma or acute injury may result in degeneration and tear, which determines signal change and shape irregularity, and even sprain or rupture of the proximal or distal insertions, centrally or more laterally. Typical injuries are observed in women that frequently use high heels, which increase stress at the metatarsal heads (Figure 25-53). This injury occurs most often in older patients.109
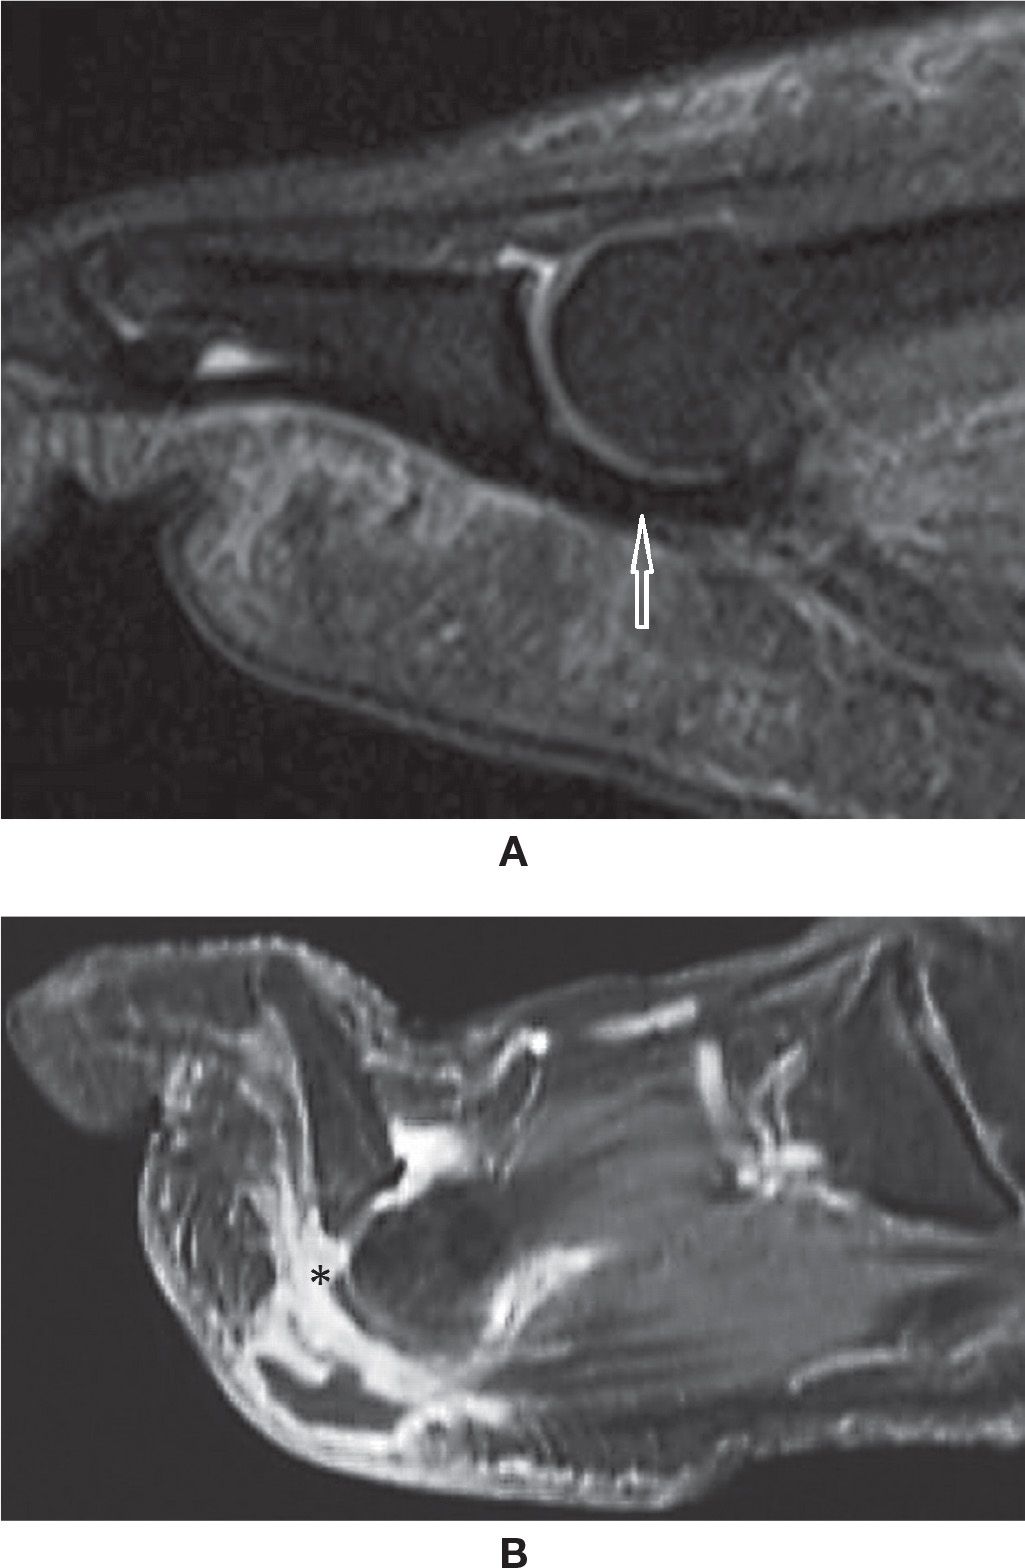
FIGURE 25-53. Plantar plate (A) Sagittal PD weighted sequence with fat saturation. The normal plate (arrow) is the low signal structure plantar to the metatarsophalangeal joint. (B) Sagittal PD weighted sequence with fat saturation. Plantar plate injury: joint fluid is extending to the plantar soft tissues through a tear of the distal insertion of the plantar plate (*).
NEOPLASM
Tumors of the foot and ankle are rare. Bone tumors can be diagnosed by radiography. CT and MRI can be utilized in complex cases. The imaging findings of the more common osseous and soft tissue tumors are described.
OSSEOUS NEOPLASM
Unicameral Bone Cyst
Unicameral bone cyst (UBC), also known as solitary or simple bone cyst, is a benign lesion typically occurring in young adults. The etiology of this cyst is controversial, and many theories have been put forth.110–112 More recent studies emphasize the importance of venous obstruction with resultant accumulation of interstitial fluid as a possible cause.113,114
UBC most commonly affects patients below the age of 20 and more frequently involve long tubular bones.115,116 The lesion occurs more frequently in males than in females. In the foot and ankle, it commonly occurs in the calcaneus.116,117
Clinically, the UBC is usually asymptomatic. When symptoms occur, they are usually associated with pathologic fractures. These pathologic fractures are clinically significant, because they can result in growth disturbances and angulation deformity, especially lesions occurring near the growth plate.118
UBC can be diagnosed accurately on radiographs. The role of CT and MRI is limited, to know the extent of the lesion and to assess the complications such as fractures. CT and MRI may be needed to diagnose UBC in more complex areas such as the spine and pelvis.
Radiographs demonstrate a well-defined, intramedullary lesion with thin sclerotic rim with a narrow zone of transition. CT confirms the radiographic findings. A UBC reveals the attenuation pattern (density) of the bone cyst to be homogeneous and of water density. The cortical margins are well defined and frequently scalloped and sclerotic. Fractures are particularly well demonstrated by CT. Fluid–fluid level may be seen.117,119 MRI demonstrates low-signal intensity on T1-weighted images and high-signal intensity on T2-weighted images. Heterogeneous signal intensities on both T1- and T2-weighted images may be seen because of bleeding within the cyst. Fluid–fluid level and septation may also be seen.117,120
Aneurysmal Bone Cyst
Aneurysmal bone cyst (ABC) is a solitary expansile lytic lesion of bone first described by Jaffe in 1921. It is a nonneoplastic lesion that tends to behave aggressively, mimicking malignancy.121 These lesions usually occur in patients younger than 20 years, in the dorsal elements of the spine and the metaphysis of long bones. The gender distribution appears about equal. In the lower extremity, ABCs occur most122 frequently in the distal tibia and fibula. In the foot, the calcaneus is the most frequently involved tarsal bone, whereas metatarsal and phalangeal involvement occurs with lessened frequency.123
The clinical presentation is that of a slowly growing mass over a period of months. Pain and swelling may or may not be present. Calcaneal involvement may mimic symptoms of heel spur syndrome. Metatarsal or phalangeal involvement is usually detected early, because of the lack of soft tissue in the foot.
The exact etiology of ABC is not clearly understood. The most accepted theory to date suggests that the cyst forms in response to increased intraosseous venous pressure. Some reports indicate that this lesion may result from traumatic fracture in certain cases.121 Grossly, the tumor is composed of spaces filled with blood. Microscopically, the lesion contains cavernous spaces consisting of fibrous walls and giant cells, and lacks features of normal blood vessels.124
Radiography demonstrates a well-defined expansile lesion with sclerotic borders; there are endosteal scalloping and prominent trabeculae that demonstrate a soap bubble appearance. CT helps to better define the ABC lesion.124 CT shows an expansile lytic mass with thin cortical margins; this thin cortical shell surrounds the outer limits of the mass. Multiple fluid levels are characteristic of these lesions; on CT, these lesions present as layers of different densities.124,125 Although CT can demonstrate the expansile nature of the tumor and detect the calcified rim surrounding the lesion, it does not depict soft tissue involvement as well as MRI can. The well-defined cystic spaces with varying range of signal intensities and multiple fluid levels are even better demonstrated on MRI.
T1-weighted MR images show low-to-intermediate-signal intensity with or without fluid levels. High-signal intensity may be seen in case of hemorrhage. T2-weighted images reveal the multilocular appearance of these lesions with low-to-intermediate-signal intensity, depending on the content of the cyst. Multiple fluid–fluid levels are commonly seen, which is very characteristic of ABC on CT and MRI. However, this phenomenon also occurs in telangiectatic osteosarcoma, chondroblastoma, giant cell tumor, and intraosseous lipoma.125,126
Osteochondroma
Osteochondroma is a common bone tumor that is also known as osteocartilaginous exostosis. It represents approximately 20% to 50% of benign bone lesions, and 10% to 20% of all bone tumors.127
Osteochondroma is thought to be hyperplastic, displaced or aberrant, growth plate cartilage.127 Classically, the lesion consists of a bony protrusion with a cartilaginous cap, perichondrium, and a bony stalk. It is possible for this lesion to undergo sarcomatous degeneration, thus becoming a chondrosarcoma. However, such degeneration does not commonly occur in the foot and ankle. Osteochondroma typically occurs in patients under 20 years of age. It seems to occur twice as many in males as in females, commonly in the distal metaphyseal region of the femur. Other locations include the distal tibia and fibula, humerus, proximal femur, and scapula.127
Clinically no pain is usually associated with this lesion per se, and thus osteochondroma is asymptomatic until accidental radiologic examination discovers the lesion. Symptoms may result from impingement on adjacent neurovascular structures. Pain associated with rapid growth suggests malignancy.127,128
The cartilaginous mass may sometimes contain calcified material that is detectable radiographically as areas of increased density. Although radiographically the tumor’s morphology is diagnostic, the cartilage cap and its thickness cannot be determined. Osteochondroma can be solitary or multiple. They can be either sessile or pedunculated.
The characteristic radiographic appearance is a bony prominence that shows cortical and medullary continuity with the underlying bone. CT evaluation reveals a continuity of cortex and spongiosa of the tumor with the parent bone; the cortical structure shows an organized pattern with a center of cancellous bone. Usually there is no associated soft tissue mass or bony destruction. CT can demonstrate the thickness of the cartilaginous cap. Although CT is useful in differentiating the lesion from a chondrosarcoma, lesion size is sometimes difficult to assess with CT; the problem lies with the similarity in attenuation values of cartilage and muscle and difficulty in obtaining the optimal plane of imaging.
MRI clearly demonstrates continuity of the exostotic cortex and medullary cavity with that of the parent bone. On T2-weighted images, the perichondrium is demonstrated as a smooth, low-signal-intensity region adjacent to a high-intensity area of cartilage. The cartilaginous cap is low-to-intermediate-signal intensity on T1-weighted images, and on T2-weighted images the cap appears as an area of intense signal. MRI can precisely measure the thickness of the cartilage cap. The cap normally measures between 2 and 2.5 mm in thickness. MR is capable of detecting mass lesions as small as 3 mm and can accurately estimate the cartilage thickness. These kinds of morphometric measurements are usually accomplished using T2-weighted pulse sequences. When present, cartilage calcification can be detected by MR as a focus of low-signal intensity. This calcification correlates with malignant degeneration of the lesion. The benign osteochondroma is usually treated nonsurgically, unless the lesion is so large that it causes pain and derangement, in which case surgery is required.
Malignant transformation, the most feared complication of osteochondroma, is seen in 1% of solitary osteochondroma and 25% of multiple osteochondromatosis. They invariably transform to chondrosarcoma (arising from the cartilage cap) or rarely to osteosarcoma (arising from the base of the stalk). Imaging features that suggest malignancy are listed in Box 25-6.127–130
BOX 25-6 Imaging Features Suggesting Malignant Transformation of Osteochondroma
Growth of a previously unchanged osteochondroma in a skeletally mature patient
Irregular or indistinct lesion surface
Focal regions of radiolucency in the interior of the lesion
Erosion or destruction of the adjacent bone
Significant soft tissue mass parsGrowth of a previously unchangedticularly containing scattered or
irregular calcification
Hyaline cartilage cap thickness. This is the most important criterion, although there has been disparity in the thickness of the cartilage in the literature. A cartilage cap thickness of more than 1.5 cm in a skeletally mature patient should be viewed with suspicion of malignant transformation
Stay updated, free articles. Join our Telegram channel

Full access? Get Clinical Tree


