Spine
Daniel F. Broderick
Thomas H. Berquist
When multimodality imaging is available, the clinical uses of each modality tend to spread from a single niche. Magnetic resonance (MR), the only modality that directly images the spinal cord, is unique because no other invasive or noninvasive technique possesses this capability. Spinal MR imaging (MRI) accounts for approximately 35% of our practice.
A variety of considerations, including clinical, technical, and anatomic factors, influence MRI. Spinal imaging requires clinical expertise, special equipment, specific imaging sequences, and perhaps imager interaction to obtain adequate examinations. The application of multispecialty expertise seems essential to exploit the versatility of MRI. Translation of the clinical characterization and localization for neurologic and musculoskeletal disorders optimizes the examination. The same thorough neurologic, rheumatologic, or orthopedic evaluation that is key to an accurate clinical diagnosis is equally crucial in optimizing MR scanning sequences because confirmation of the diagnosis is often possible with MR. Additional consultation between radiologists and their clinical colleagues is also important in handling those patients who may require premedication or sedation to complete the examination.
TECHNICAL CONSIDERATIONS
Imaging of the spine is complex. In contrast to the head, where the volume and composition of its tissues are almost constant, the spine is less predictable. The length of the spinal column, its dorsal location, and the small size of the intraspinal content preclude effective imaging by a volume coil such as a body coil. To improve image quality, surface coils must be used to increase the signal-to-noise ratio, whereas smaller fields of view (FOVs; 16 to 24 cm) are often needed to improve spatial resolution. As a result, multiple coil placements are necessary for a complete study of the entire spine unless multicoil technology is available. Currently, the spine coil for our system is built into the table, allowing evaluation of multiple spinal segments (Fig. 5.1). An additional coil is often required for the cervical spine (Fig. 5.2).1
As expected, motion—both patient and physiologic— obscures anatomic and pathologic detail. Sedatives may be necessary in children, whereas analgesics are sometimes needed in patients who are evaluated for a painful condition. If patient motion can be obviated, physiologic motion due to the proximity of the spine to the heart, great vessels, diaphragm, and aerodigestive system becomes a problem. Motion from the beating heart, flowing blood, diaphragmatic excursion, normal swallowing, and cerebrospinal fluid (CSF) pulsation create artifacts that simulate or obscure significant pathology.2,3,4 This is particularly true on T2-weighted and gradient-echo sequences where internal motion results in artifacts from the spatial mismapping of the signal intensities present.3 This lowers the contrast resolution between the CSF and spinal cord and causes areas of decreased signal in the CSF and corresponding areas of increased signal in the spinal cord parenchyma (Fig. 5.3). On T1-weighted sequences, these artifacts are less apparent but can result in areas of increased signal in the CSF (see Fig. 5.2). Because of this, a variety of motion compensation mechanisms, including flow compensation gradients, presaturation pulse sequences, phase and frequency gradient direction reversal, and cardiac/respiratory gating3,5,6 are used to reduce the effect of physiologic internal motion, to maximize the contrast between CSF and the spinal cord, and to minimize misregistration artifacts. Most vendors have many of these options available, and one or several must be used to reduce artifacts and enhance visualization of either pathology or normal anatomy.
Another artifact that can obscure pathology or simulate intramedullary lesions is the truncation artifact or
Gibbs phenomenon.3,7,8 This is a sampling-related effect that occurs at high-contrast boundaries such as the CSF-spinal cord interface. It is most apparent when the object imaged is small relative to the pixel size used, resulting in alternating bands of high and low signals that parallel the high-contrast interface. It is most prominent on sagittal sequences where it can simulate a syrinx. This artifact can be reduced by using small FOVs, small slice thicknesses, and a matrix of 192 or greater.3,7,8
Gibbs phenomenon.3,7,8 This is a sampling-related effect that occurs at high-contrast boundaries such as the CSF-spinal cord interface. It is most apparent when the object imaged is small relative to the pixel size used, resulting in alternating bands of high and low signals that parallel the high-contrast interface. It is most prominent on sagittal sequences where it can simulate a syrinx. This artifact can be reduced by using small FOVs, small slice thicknesses, and a matrix of 192 or greater.3,7,8
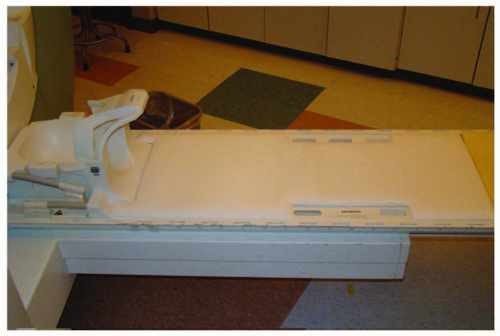 Figure 5.1 Spine coil built into the table to allow assessment of multiple segments. |
The presence of spinal fixation hardware poses unique problems in spinal imaging.The resultant susceptibility artifacts can result in uninterpretable examinations. With careful selection of imaging parameters, compromised but interpretable examinations can be performed. These artifacts can be reduced by using multiple 180° refocusing pulses in rapid acquisition with relaxation enhancement (RARE) imaging. Further reduction occurs when using a high receiver bandwidth (32 kHz) and smaller pixel size (512 × 512 matrix), at the expense of reduced signal-to-noise ratio (Figs. 5.3 and 5.5)9,10,11,12,13 (see Chapter 3 for more details on metal artifact reduction).
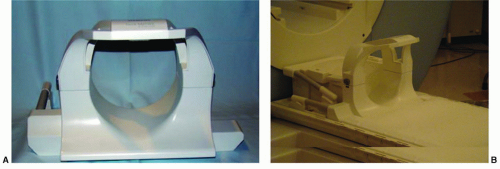 Figure 5.2 Cervical spine coil seen on end (A) and with multisegment attachment (B). |
Body habitus, spinal curvature, and the size of the intraspinal components play a significant role and compound the technical difficulty of obtaining an adequate examination. Some patients exceed the weight limitations of the table, whereas others will not fit within the bore of the magnet. The size of the spinal cord, which measures about 1 cm in diameter, parenchymal pathology, which is no more than a few millimeters, and the nerve roots, which are 1 mm or less, demands excellent contrast and spatial resolution. As a result, even the most powerful commercially available magnets are taxed if the duration of the examination is not compatible with reasonable patient comfort.
NORMAL ANATOMY
The anatomy of the spine is complex, being composed of multiple tissue types. The vertebral bodies provide mechanical support, whereas interposed intervertebral discs cushion motion. A variety of ligaments link these structures together. The spinal cord, which is bathed in the CSF, lies within the protective environment of the spinal column. At each segment, a pair of spinal nerves exits through the neural foramen. An extensive vascular network is also present, with arteries segmentally supplying the bones, muscles, meninges, and cord, and a network of draining veins that extends within the spinal canal and surrounds the vertebral bodies. Each of these structures has different signal characteristics depending on pulse sequences selected. Figures 5.6,5.7,5.8,5.9,5.10,5.11,5.12,5.13,5.14 illustrate the normal MR appearance of the spine in a variety of commonly used imaging planes and pulse sequences.
Spinal Column
There are 33 vertebrae, with the usual distribution being 7 cervical, 12 thoracic, 5 lumbar, 5 sacral, and 4 coccygeal
segments, but this may only be present in 20% of the population. The sacrum and coccyx are usually fused. Vertebral numbers can vary between 32 and 35, with the cervical region most constant and coccygeal region most variable.14 Various methods have been proposed to accurately determine vertebral levels.
segments, but this may only be present in 20% of the population. The sacrum and coccyx are usually fused. Vertebral numbers can vary between 32 and 35, with the cervical region most constant and coccygeal region most variable.14 Various methods have been proposed to accurately determine vertebral levels.
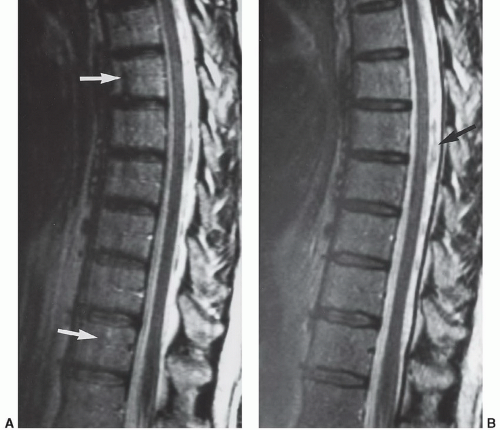 Figure 5.3 Phase misregistration artifact from cardiac motion. A: When the phase encoding direction is anterior to posterior (AP), linear areas of increased and decreased signal are seen (arrows). The cerebrospinal fluid-cord and extradural interfaces are blurred (T2-weighted fast spin echo). B: The phase encoding direction has been reversed from AP in A to superior-inferior, which improves the image. Mild cerebrospinal fluid pulsation artifact persists (arrow) (T2-weighted fast spin echo). |
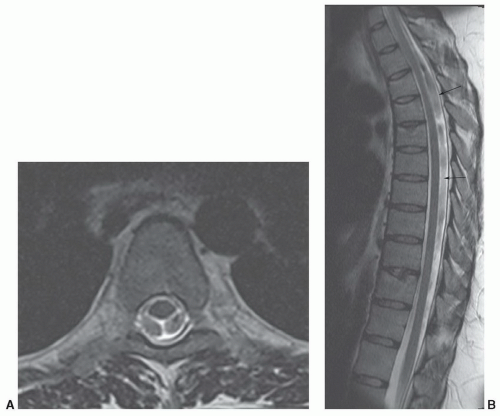 Figure 5.4 Cerebrospinal fluid pulsation artifact. Axial (A) and sagittal (B) T2-weighted images demonstrating pulsation artifacts (arrows). |
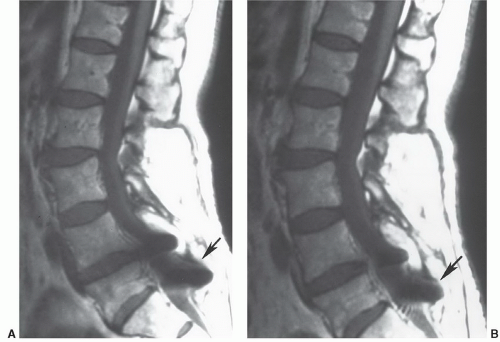 Figure 5.5 Metal artifact reduction, lumbar spine. A: Severe susceptibility distortion of the thecal sac by pedicle screws (arrow) (TE 20 ms, TR 450 ms, matrix 256 × 192, bandwidth 16 kHz). B: The artifact is reduced (arrow) and the disc-thecal sac interface better delineated by using a RARE sequence (echo train length 4) and increasing the receiver bandwidth (32 kHz). |
Identifying the location of the right renal artery on sagittal images has been shown to be located at the L1 to L2 disc level in the majority of cases.15 However, identifying the position of the C2 vertebral body on a large FOV sagittal localizing image may be the most accurate.16 Akbar et al.15 recommended using a subminute automated spine survey for studies of the thoracic and lumbar spine. Their review of 207 patients demonstrated that without the survey, 69% of the 7.7% anatomic variations would be undetected and not appropriately reported.15 Hughes and Saifuddin16 recommended using the identification of the iliolumbar ligament on axial images for correctly numbering the lumbar vertebrae, as this ligament always arises from L5.
The morphology of each vertebra is similar, with individual variations in each region.17 The first two cervical vertebrae are an exception because they are highly specialized structures. In general, each vertebra is composed of a body, which is located anteriorly, and a posterior arch. The posterior arch is formed by two pedicles that extend from the body to an articular mass or pars interarticularis. Projections of bone extend above and below each articular mass to form the superior and inferior facets. They articulate with the corresponding facet of the adjacent vertebral bodies at a synovial joint. Two laminae extend posteriorly where they fuse to form the spinous process, thus completing a ring and forming the spinal canal. Laterally, transverse processes extend from the posterior arches that, together with the spinous processes, act as levers for the attachment of many skeletal muscles. In addition to the synovial facet joints, an additional articulation is found in the cervical region. A lateral ridge of bone, the uncinate process, extends from the superior surface of each cervical vertebral body that articulates with a notch in the inferior aspect of the vertebral body above, forming the uncovertebral joints of Lushka.17 This is not a true joint but rather is thought to represent the lateral extension of the intervertebral disc, which has partially degenerated by adulthood.
The spinal nerves course through the neural foramina at each vertebral body level. In the cervical region, the neural foramina can be elongated, forming a canal that is bordered by the pedicles of adjacent vertebrae above and below.18,19 The anterior margin of the foramen or canal is the posterior vertebral body and uncinate process. The articular masses and facet joints form the posterior margin. The ventral and dorsal roots are located within the inferior portion of the foramen, at and below the disc level.18 In the lumbar region, the superior and inferior borders of the neural foramen are again formed by the pedicles. The posterior vertebral
body above and the posterior disc margin below form the anterior margin. The facet joint and a small portion of the ligamentum flavum form the posterior border. The lumbar nerve roots are located within the superior portion of the foramen above the disc level.
body above and the posterior disc margin below form the anterior margin. The facet joint and a small portion of the ligamentum flavum form the posterior border. The lumbar nerve roots are located within the superior portion of the foramen above the disc level.
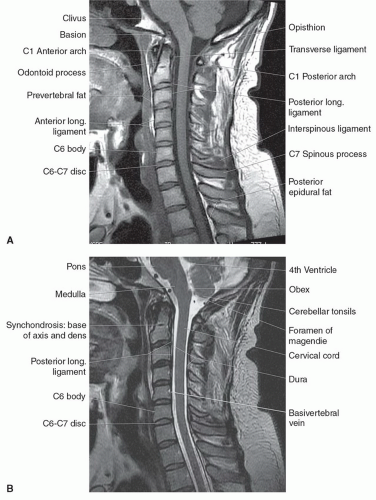 Figure 5.6 Normal cervical spine in the sagittal plane. A: T1-weighted fast spin echo. B: T2-weighted fast spin echo. |
The first two cervical vertebrae, the atlas and the axis, are different in morphology because of their specialized function of holding up the head and allowing for a variety of rotational and tilting motions.17 The atlas, or C1, is ring shaped and lacks a well-formed vertebral body. It has an anterior arch and a posterior arch connected by a lateral mass on each side. The superior articulating facets articulate with the occipital condyle at the base of the skull, and the inferior articular facets articulate with the superior articulating facets of the axis. A long process extends from the superior surface of the body of the axis, which is called the odontoid process or the dens. It forms a synovial joint at its articulation with the posterior aspect of the anterior arch of C1, is held in place by a set of strong ligaments (which are discussed later), and provides a pivot on which the atlas and skull can rotate.17
The signal intensity of the vertebral bodies depends on the amount and type of marrow present. Normally, the proportion of red to yellow marrow is high so that the vertebral bodies show medium to high signal with T1-weighted and RARE sequences, intermediate to low signal with T2-weighted, and low signal on gradient-echo sequences. The signal pattern may be homogeneous or inhomogeneous, depending on the distribution of marrow fat and fibrous tissue. The end plates demonstrate low signal on T1-weighted, T2-weighted, and partial flip angle sequences because of a combination of the composition (cortical bone covered
with cartilage) and chemical shift artifact.20,21 The articular cartilage lining the facet joints usually demonstrates low signal intensity on T1- and T2-weighted sequences and is difficult to distinguish from cortical bone.22 However, it demonstrates increased signal on gradient-echo sequences, distinct from the bone. After radiation therapy, the vertebral bodies become brighter in intensity on T1-weighted sequences when fat replaces the marrow elements (Fig. 5.15).
with cartilage) and chemical shift artifact.20,21 The articular cartilage lining the facet joints usually demonstrates low signal intensity on T1- and T2-weighted sequences and is difficult to distinguish from cortical bone.22 However, it demonstrates increased signal on gradient-echo sequences, distinct from the bone. After radiation therapy, the vertebral bodies become brighter in intensity on T1-weighted sequences when fat replaces the marrow elements (Fig. 5.15).
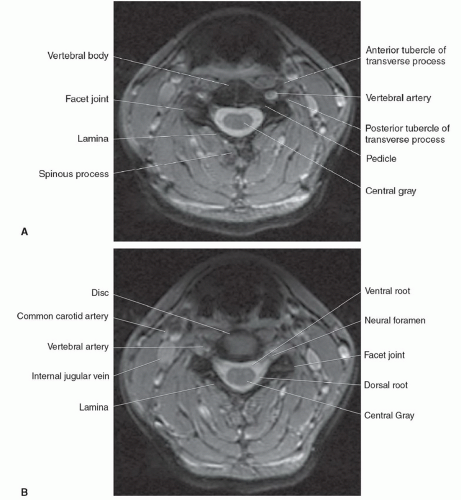 Figure 5.7 Normal cervical spine—axial plane. A and B: Gradient echo. C: T1-weighted. D: Three-dimensional constructive interference at steady state (3 T) (TR 8.9 ms, TE 4.4 ms, 35° flip angle). |
Intervertebral Discs
The intervertebral discs are interposed between adjacent vertebral bodies and hydrostatically cushion the mechanical forces present. The disc consists of a central gelatinous nucleus pulposus, which is believed to be the remnant of the primitive notochord, and peripheral fibrocartilage.19,21 This fibrocartilage is arranged in a concentric lamellar pattern that forms the annulus fibrosis and is designed to withstand radial tension. Superiorly and inferiorly, collagenous (Sharpey’s) fibers insert into the ring apophysis of the vertebral body end plates. The superior and inferior portions of the disc are at least partially covered by a thin hyaline cartilage that is continuous with the cartilage over the adjacent vertebral body end plates.16 Although these components are histologically separate in a normal disc, discrete border zones are not identified at pathology. Rather, the nucleus pulposus blends imperceptibly with the annulus fibrosis.
The MR appearance of the intervertebral disc reflects its water content. Normal discs demonstrate low signal on
T1-weighted sequences and high signal on T2-weighted and gradient-echo sequences. The decline in T2 signal radially from the nucleus pulposus out to the periphery of the disc parallels the normal decrease in water content seen at pathology. The water content, varying from 85% to 90% in the nucleus to 70% to 80% in the innermost annulus, falls to its lowest concentration in the most peripheral portions of the disc.22,23,24 On MR images, the outermost annular fibers show low signal on T1-weighted and T2-weighted sequences, so distinction from the anterior and posterior longitudinal ligaments or the vertebral body end plates is not possible. The transition zone from nucleus pulposus to annulus fibrosis is relatively sharp in the young but becomes less distinct with aging. A horizontal band of low signal on T2-weighted sequences may be seen within the central portion of the disc on sagittal images, which can vary from a small notch to a complete partition.21,24,25,26 Its etiology is unclear. Some authors describe annular-like tissue in the region of the cleft at pathology that is believed to represent degenerative fibrosis.25,26 Other researchers have failed to find a pathologic correlate.21
T1-weighted sequences and high signal on T2-weighted and gradient-echo sequences. The decline in T2 signal radially from the nucleus pulposus out to the periphery of the disc parallels the normal decrease in water content seen at pathology. The water content, varying from 85% to 90% in the nucleus to 70% to 80% in the innermost annulus, falls to its lowest concentration in the most peripheral portions of the disc.22,23,24 On MR images, the outermost annular fibers show low signal on T1-weighted and T2-weighted sequences, so distinction from the anterior and posterior longitudinal ligaments or the vertebral body end plates is not possible. The transition zone from nucleus pulposus to annulus fibrosis is relatively sharp in the young but becomes less distinct with aging. A horizontal band of low signal on T2-weighted sequences may be seen within the central portion of the disc on sagittal images, which can vary from a small notch to a complete partition.21,24,25,26 Its etiology is unclear. Some authors describe annular-like tissue in the region of the cleft at pathology that is believed to represent degenerative fibrosis.25,26 Other researchers have failed to find a pathologic correlate.21
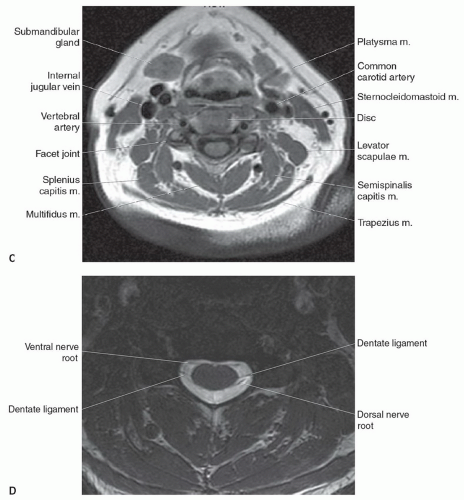 Figure 5.7 (continued) |
With aging, there is progressive loss of water content in the nucleus pulposus and annulus fibrosis. Also, the biochemical structure of the nucleus pulposus changes with replacement of the gelatinous matrix by disorganized fibrocartilage.23,24 Eventually, the degenerated nucleus blends imperceptibly with the annulus fibrosis on imaging and at pathology. The result is a progressive decrease in signal on T2-weighted sequences, as the disc becomes a desiccated, degenerated structure that is mostly fibrocartilage.
Spinal Ligaments
The vertebral bodies and intervertebral discs are linked together by a variety of ligaments.16 The anterior longitudinal ligament extends from the base of the skull to
the sacrum and is adherent to the anterior vertebral bodies and the anterior disc margins. A corresponding ligament, the posterior longitudinal ligament, extends from C2 to the sacrum. This ligament is firmly attached to the vertebral body end plates and posterior disc margins but is separated from the midposterior vertebral body to allow room for the anterior internal epidural venous plexus and basivertebral veins. The anatomy of this more patulous portion of the anterior epidural space at the level of the vertebral body has been further defined. A midline septum anchors the posterior longitudinal vertebral body to the posterior longitudinal ligament. Thin membranes extend laterally from the posterior longitudinal ligament, dividing this space. These structures result in predictable patterns of involvement by neoplasms and infection.27
the sacrum and is adherent to the anterior vertebral bodies and the anterior disc margins. A corresponding ligament, the posterior longitudinal ligament, extends from C2 to the sacrum. This ligament is firmly attached to the vertebral body end plates and posterior disc margins but is separated from the midposterior vertebral body to allow room for the anterior internal epidural venous plexus and basivertebral veins. The anatomy of this more patulous portion of the anterior epidural space at the level of the vertebral body has been further defined. A midline septum anchors the posterior longitudinal vertebral body to the posterior longitudinal ligament. Thin membranes extend laterally from the posterior longitudinal ligament, dividing this space. These structures result in predictable patterns of involvement by neoplasms and infection.27
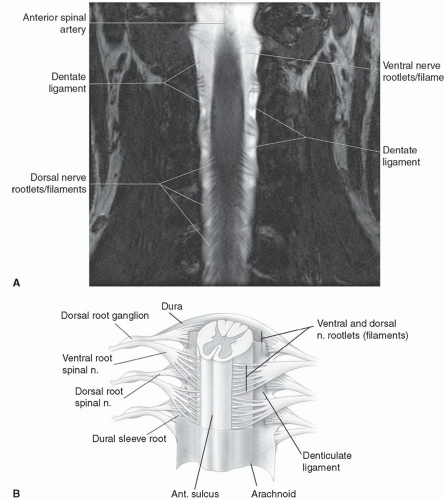 Figure 5.8 Coronal cervical cord. A: Three-dimensional constructive interference at steady state (3 T). B: Illustration. |
The superior extension of the posterior longitudinal ligament is the tectorial membrane that extends from C2 to the lower clivus. The laminae of each vertebral body are segmentally joined by the ligamentum flavum, named for its yellow color noted at surgery. The ligamentum flavum extends posterolaterally to merge with the facet joint. The interspinous ligament segmentally connects the spinous processes, and the supraspinous ligament extends along the tips of the spinous processes.
Additional ligaments are present at the craniovertebral junction that stabilize the atlantoaxial and cranial cervical junction. The anterior atlantooccipital membrane extends from the anterior margin of the foramen magnum to the anterior arch of the atlas. A corresponding posterior atlantooccipital membrane extends from the posterior margin
of the foramen magnum to the posterior arch of the atlas. An important ligament is the cruciate (cruciform) ligament, named for its cross-like shape. It has a horizontal portion that forms the transverse ligament and holds the dens to the ring of C1 and a vertical portion that, together with the tectorial membrane, attaches to the lower clivus. The apical ligament extends from the tip of the dens to the anterior margin of the foramen magnum, and the alar ligaments extend laterally from the dens to each occipital condyle.16
of the foramen magnum to the posterior arch of the atlas. An important ligament is the cruciate (cruciform) ligament, named for its cross-like shape. It has a horizontal portion that forms the transverse ligament and holds the dens to the ring of C1 and a vertical portion that, together with the tectorial membrane, attaches to the lower clivus. The apical ligament extends from the tip of the dens to the anterior margin of the foramen magnum, and the alar ligaments extend laterally from the dens to each occipital condyle.16
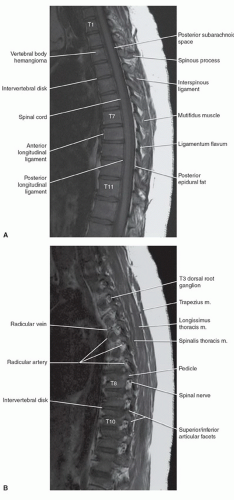 Figure 5.9 Normal thoracic spine in the sagittal plane. A: T1-weighted, midline. B: T1-weighted, lateral to midline. C: T2-weighted fast spin echo. |
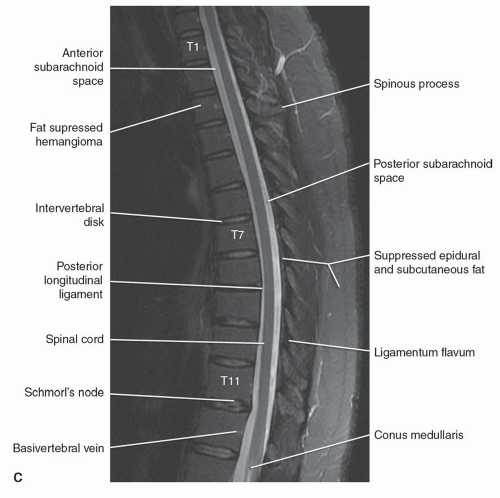 Figure 5.9 (continued) |
On MR images, most ligaments, with the exception of the ligamentum flavum, demonstrate low signal intensity, similar to bone, on all imaging sequences because of their high collagen content.22,28 The ligaments blend imperceptibly with cortical bone, the outer fibers of the annulus fibrosis, and the dura. The ligamentum flavum demonstrates intermediate signal on T1- and T2-weighted sequences and high signal on gradient-echo sequences. The reason for this discrepancy is presumably related to its different biochemical composition. The ligamentum flavum contains only 20% collagen and 80% elastin.22,29
Spinal Cord and Nerves
The spinal cord begins as the caudal extension of the medulla oblongata at the level of the foramen magnum. Its distal extent is more variable and age-dependent. The spinal cord and vertebral column are equal in length until the third fetal month. Thereafter, because of discordant growth between the cord and the spinal column, the tip of the conus “ascends” tolie opposite of the L1 vertebral body in the adult, with a range from the 11th thoracic interspace to the second lumbar interspace.30 The conus terminates in the filum terminale, which is less than 2 mm in diameter and extends to the first coccygeal segment.30
The spinal cord varies in size depending on its level within the spinal canal. It is widest at the cervical enlargement (C5 to C6), narrowest at the mid thoracic region (T5 to T9), and enlarges again in the lumbar region from T10 to the conus.30 The anteroposterior diameter of the cord remains relatively constant at 9 to 10 mm throughout its length.
Small nerve rootlets emerge from posterior and anterior lateral sulci along the length of the spinal cord to form the dorsal and ventral nerve roots. The union of the dorsal sensory and the ventral motor roots forms the spinal nerves. There are eight pairs of cervical nerve roots but only seven cervical vertebral bodies. The first seven cervical nerves exit above the pedicles of their corresponding vertebral body level. For example, the C5 nerve root exits at the fourth cervical interspace above the C5 pedicle. The C8 nerve root exits below the C7 pedicle at the seventh cervical interspace.
Below T1, the remaining nerve roots exit inferior to their corresponding vertebral body levels so that T1 nerve root exits at the first thoracic interspace, T2 nerve root exits at the second thoracic interspace, and so on. In the cervical region, the nerve roots course relatively horizontal to exit their neural foramen. Because of the discrepancy between the length of the spinal cord and vertebral column, the course of the nerve roots becomes progressively more vertical throughout the thoracic region. Below the tip of the conus, the lumbar and sacral nerve roots have a rather long, parallel, vertical course that forms the cauda equina.16
Below T1, the remaining nerve roots exit inferior to their corresponding vertebral body levels so that T1 nerve root exits at the first thoracic interspace, T2 nerve root exits at the second thoracic interspace, and so on. In the cervical region, the nerve roots course relatively horizontal to exit their neural foramen. Because of the discrepancy between the length of the spinal cord and vertebral column, the course of the nerve roots becomes progressively more vertical throughout the thoracic region. Below the tip of the conus, the lumbar and sacral nerve roots have a rather long, parallel, vertical course that forms the cauda equina.16
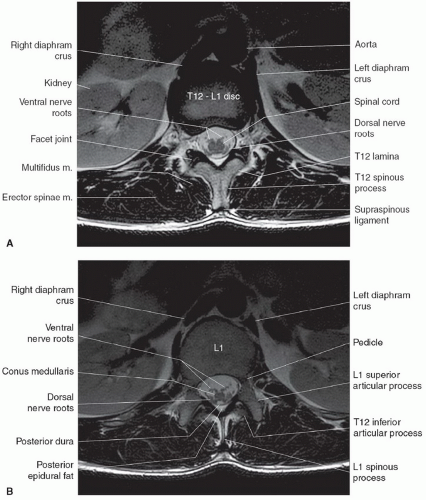 Figure 5.10 Normal thoracic spine—axial plane, T2-weighted fast spin echo. A: At the distal spinal cord. B: At the conus. |
On MR images, the spinal cord has intermediate signal on T1-weighted sequences and low signal on T2-weighted and gradient-echo sequences. On high-resolution studies at high field strength, some internal architecture can be seen on T2-weighted and gradient-echo sequences. This is particularly apparent on axial images where an “H”-shaped zone of slightly higher signal may be seen in the region of a central gray matter surrounded by the slightly lower signal of the white matter tracts (Fig. 5.7). A corresponding longitudinal stripe of slightly higher signal is seen within the mid spinal cord on the sagittal T2-weighted and gradient-echo sequences.31 This distinction between white and gray matter is thought to be secondary to a combination of the differences in water content between white and gray matter, the differences in relaxation times, and the presence or absence of myelin.31 These changes are not apparent on T1-weighted sequences. Individual nerve roots and rootlets
can sometimes be resolved with high-resolution imaging at high field strengths (Figs. 5.7 and 5.8).
can sometimes be resolved with high-resolution imaging at high field strengths (Figs. 5.7 and 5.8).
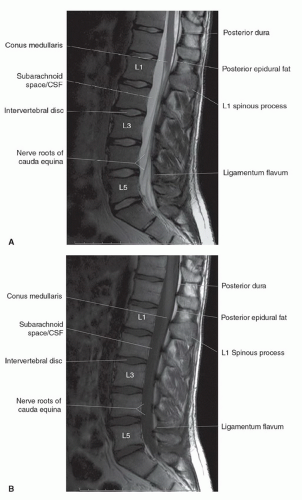 Figure 5.11 Normal lumbar spine in the sagittal plane, midline. A: T1-weighted fast spin echo. B: T2-weighted fast spin echo. |
Dural Coverings
The dural coverings of the spinal cord and nerve roots are in continuity with those in the cranial cavity. The dura and the arachnoid are closely adherent, with only a potential space between the two. They form the outer boundary of the subarachnoid space. The inner boundary is formed by the pia mater, which is closely adherent to the spinal cord and nerve roots. The pia mater is attached to the dura on both sides of the spinal cord by pointed processes known as the denticulate (dentate) ligaments. CSF circulates within the subarachnoid space and freely communicates with the cranial CSF spaces. It demonstrates low signal intensity (lower than spinal cord) on T1-weighted sequences and cannot be
distinguished from the dura or posterior longitudinal ligament. On gradient-echo and T2-weighted sequences, the CSF becomes high in signal, much greater than the spinal cord.
distinguished from the dura or posterior longitudinal ligament. On gradient-echo and T2-weighted sequences, the CSF becomes high in signal, much greater than the spinal cord.
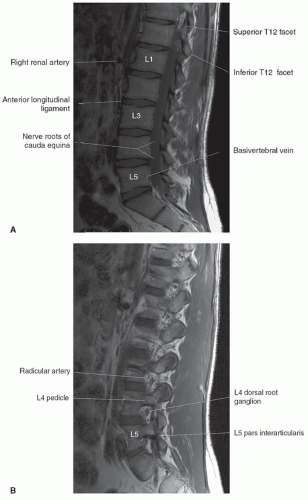 Figure 5.12 Normal T1-weighted lumbar spine in the sagittal plane. A: Lateral to midline. B: Far lateral to midline. |
Vascular
The blood supply to the spinal cord is via a larger anterior spinal artery that supplies the anterior two-thirds to four-fifths of the spinal cord and two small posterior spinal arteries that supply the remainder of the cord.17 The anterior and posterior spinal arteries are asymmetrically and variably supplied at a few levels by medullary branches of the radiculomedullary arteries that arise from the vertebral arteries, aortic intercostal arteries, and lumbar arteries. At the skull base, the junction of paired medullary branches of the intracranial vertebral arteries forms the anterior spinal artery. Additional arterial contribution is seen at two or three other cervical levels. The upper thoracic cord is poorly
supplied with a watershed zone at approximately T4. The predominant arterial supply to the thoracolumbar region is through the great anterior medullary artery, the artery of Adamkiewicz. It arises on the left side 75% of the time and usually between T9 and L2 85% of the time.30,32 It makes a characteristic hairpin bend as it forms the ascending and descending anterior spinal artery (Fig. 5.16). The venous system roughly mirrors the arterial system, with multiple medullary veins draining into pial veins that communicate with the prominent posterior spinal vein and smaller anterior spinal veins.17 Radicular veins coursing with the nerve roots at variable levels drain the pial veins into the internal vertebral venous plexus that is in the epidural space surrounded by fat.33 The internal vertebral venous plexus drains into the external vertebral venous plexus either via the basivertebral vein through the vertebral body or via paired anterior longitudinal epidural veins that drain through the neural foramen.17 The external vertebral venous plexus ultimately empties into the azygos system.
supplied with a watershed zone at approximately T4. The predominant arterial supply to the thoracolumbar region is through the great anterior medullary artery, the artery of Adamkiewicz. It arises on the left side 75% of the time and usually between T9 and L2 85% of the time.30,32 It makes a characteristic hairpin bend as it forms the ascending and descending anterior spinal artery (Fig. 5.16). The venous system roughly mirrors the arterial system, with multiple medullary veins draining into pial veins that communicate with the prominent posterior spinal vein and smaller anterior spinal veins.17 Radicular veins coursing with the nerve roots at variable levels drain the pial veins into the internal vertebral venous plexus that is in the epidural space surrounded by fat.33 The internal vertebral venous plexus drains into the external vertebral venous plexus either via the basivertebral vein through the vertebral body or via paired anterior longitudinal epidural veins that drain through the neural foramen.17 The external vertebral venous plexus ultimately empties into the azygos system.
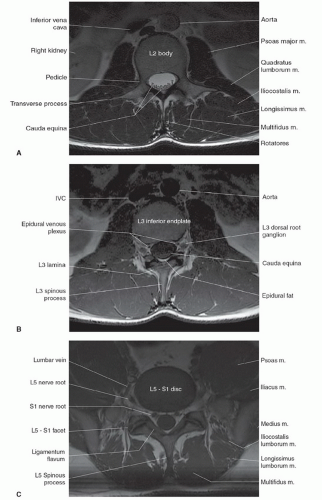 Figure 5.13 Normal lumbar spine in the axial plane. A: T2-weighted fast spin echo at the L2 body. B: T1-weighted at the L3 inferior end plate. C: T1-weighted at the L5 interspace. IVC, inferior vena cava. |
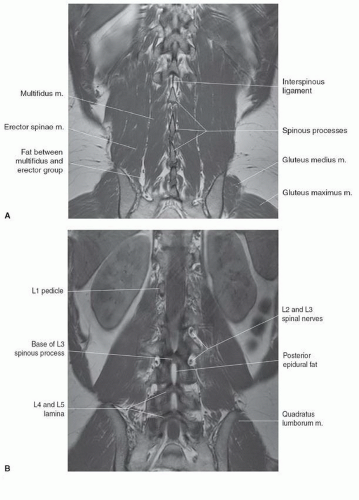 Figure 5.14 Normal T1-weighted lumbar spine in the coronal plane. A: Far posterior at the spinous processes. B: Posterior at the lamina. C: At the vertebral body/pedicle. |
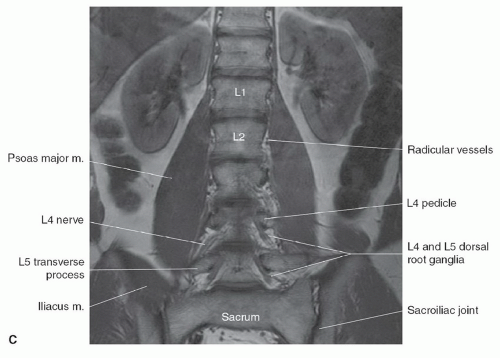 Figure 5.14 (continued) |
 Figure 5.15 Radiation changes in a patient treated for vertebral malignancy. T1-weighted sagittal images of the cervical (A) and thoracic (B) spine. High marrow fat signal (arrows) is seen within the vertebral bodies adjacent to the treated vertebral body. |
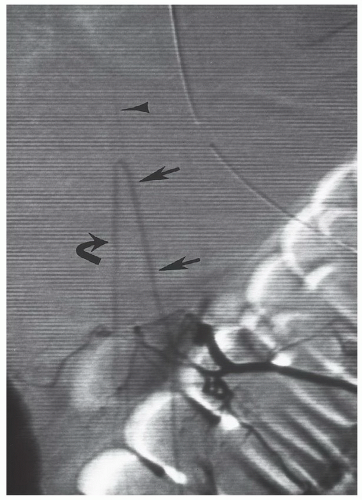 Figure 5.16 Artery of Adamkiewicz. Spinal arteriogram demonstrating the characteristic hairpin bend of Adamkiewicz (arrows), giving rise to the ascending (arrowhead) and descending (curved arrow) branches. |
Table 5.1 Routine Magnetic Resonance Spinal Pulse Sequences | |||||||||||||||||||||||||||||||||||||||||||||||||||||||||||||||||||||||||||||||||||||||||||||||||||||||||||||||||||||||||||||||||||||||
|---|---|---|---|---|---|---|---|---|---|---|---|---|---|---|---|---|---|---|---|---|---|---|---|---|---|---|---|---|---|---|---|---|---|---|---|---|---|---|---|---|---|---|---|---|---|---|---|---|---|---|---|---|---|---|---|---|---|---|---|---|---|---|---|---|---|---|---|---|---|---|---|---|---|---|---|---|---|---|---|---|---|---|---|---|---|---|---|---|---|---|---|---|---|---|---|---|---|---|---|---|---|---|---|---|---|---|---|---|---|---|---|---|---|---|---|---|---|---|---|---|---|---|---|---|---|---|---|---|---|---|---|---|---|---|---|
| |||||||||||||||||||||||||||||||||||||||||||||||||||||||||||||||||||||||||||||||||||||||||||||||||||||||||||||||||||||||||||||||||||||||
EXAMINATION TECHNIQUE
Surface coils are used for the evaluation of the spine because of the need for high signal-to-noise ratio and resolution. Today multiple configurations are available with coil arrays and multiple channels including special coils for the neck. The spine coil is configured into the table in our 1.5-T MR units (see Fig. 5.1). In the cervical region, a separate special neck coil works well (see Fig. 5.2). If this coil does not work due to the patient’s body habitus, a 7- by 11-in rectangular “license plate” coil or a 5-in round circular coil may be used.
Our 8-channel dual-mode matrix spine coil system can create composite images by combining signals along the spinal axis (Fig. 5.17). This versatile system gives the operator the choice of high-resolution imaging of the entire spinal axis or small spinal segments. The result is improved image quality in a shorter time because the need to move the patient or a single surface coil is eliminated.34,35,36,37 Software advances have further improved the ability to quickly survey the entire spinal axis by combining separate high-resolution data sets into a single composed image (Fig. 5.17). Pediatric multicoil array systems combine head and spine coils and are particularly advantageous in this patient population because these patients are often sedated (Fig. 5.18).
Spinal imaging has been most often performed on 1.5-T systems; 3.0-T units are also commonly used in clinical settings. However, except for brain imaging, our neuroradiologists prefer 1.5-T units for the spine.36
Pulse sequence selection varies with the indication and region of interest. Table 5.1 summarizes common protocols for MRI of the spine. Routine examinations of the cervical, thoracic, and lumbar spine include T1-weighted sagittal images. Both conventional T1-weighted and turbo fast spin-echo sequences may be used, but we prefer the latter in the spine. Additional turbo spin-echo T2-weighted sagittal images are also obtained. In the evaluation of degenerative disc disease, axial sequences are performed next, with the axial sections parallel to the interspaces (Fig. 5.19). In the lumbar spine, our routine series includes T1-weighted sagittal, T2-weighted turbo spin-echo, axial T1-weighted long block, oblique axial T2-weighted turbo spin-echo, axial T2-weighted turbo spin-echo short block, and T2-weighted turbo spin-echo with fat suppression short block sequences. In the lumbar region, turbo spin echo T1-weighted axial sequences are utilized to take advantage of the sharp contrast between intraspinal fat and disc material, nerve roots, and bone. The axial images are then repeated using fast spin echo to differentiate disc from CSF. Gradient-echo axial images are used in the cervical region, as they tend to differentiate spinal cord, dural sac, disc material, and bone37,38,39,40 and are free from the confusing flow artifact often seen with fast spin-echo axial sequences. Gradient-echo axial sequences can often confirm and further characterize intradural or intramedullary lesions seen on the sagittal sequences.37,41 Intravenous contrast is administered and T1-weightedsagittal and/or axial sequences are repeated if intradural pathology is found or if the clinical indication suggests a meningeal process or a spinal vascular malformation. Fat suppression technique and contrast enhancement are used in patients with suspected osseous metastasis. Sagittal short T inversion recovery (STIR) and gradient-echo sequences are added in patients with spinal trauma.
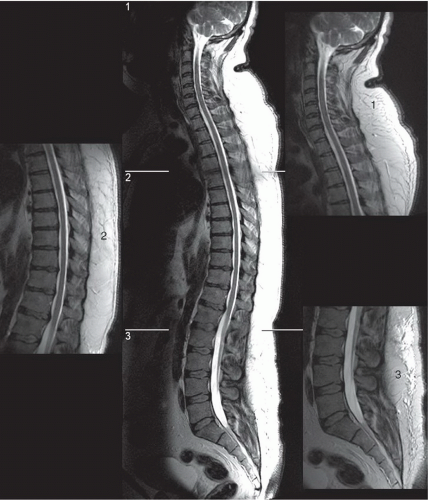 Figure 5.17 T2-weighted fast spin-echo composite image. This image was generated at a workstation by using a tool that combines three small field-of-view, high-resolution images. |
Patients with scoliosis require special imaging considerations. Only small portions of the spinal canal and cord are imaged on each slice. Intradural pathology may be obscured, with the pathology mimicking volume averaging. Repeating the T1-weighted sequences in the coronal plane usually provides additional information. Also, the coronal and sagittal planes may be angled to allow imaging of a larger portion of the spine on any one slice. Scoliosis often precludes the possibility of visualizing the intraspinal structures on a single or few adjacent scans. A curved reformatting feature is available on some scanning systems and most workstations,
which can be helpful in evaluating pathology or the discspinal canal interface in these problematic spines (Fig. 5.20). Contrast may be used more liberally to increase the conspicuity of intradural lesions in a patient with a documented myelopathy.
which can be helpful in evaluating pathology or the discspinal canal interface in these problematic spines (Fig. 5.20). Contrast may be used more liberally to increase the conspicuity of intradural lesions in a patient with a documented myelopathy.
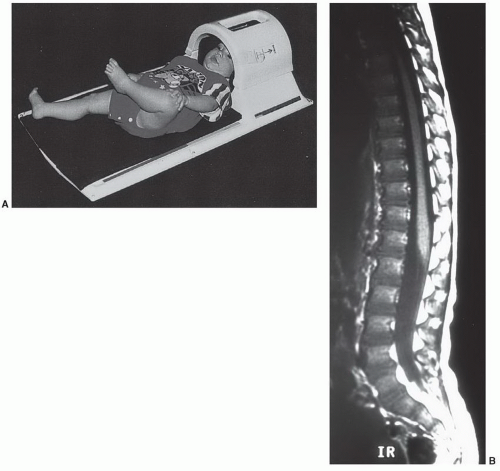 Figure 5.18 Pediatric phased array multicoil. A: Toddler positioned on the integrated head and spine coil. B: Sagittal T1-weighted image of the majority of the thoracolumbar spine obtained by selecting the middle and lower spinal portions of the array. |
There is no one correct way to image the spine. Multiple pulse sequences and imaging options are available. Presaturation pulses are routinely applied anteriorly to minimize artifacts from normal physiologic motion of the heart and great vessels, chest wall, and abdomen. Other motion compensation mechanisms (respiratory compensation, cardiac gating) may be used, but not all options are available on each system. The choice of repetition times, echo times, and flip angles to achieve optimum contrast between spinal cord and CSF on T2-weighted, turbo spin-echo T1-weighted, or gradient-echo sequences may vary depending on the motion compensation mechanisms available and the type of magnet. Routine protocols are included in Table 5.1. A “screening” examination is often supplemented with additional pulse sequences, discussed in other sections of this chapter. Each request for a spinal MR examination needs to be carefully reviewed in order to ensure that the optimal pulse sequences are being used to answer the proposed clinical question.
MAGNETIC RESONANCE CONTRAST AGENTS
There are currently five MR contrast agents approved for use in evaluation of spinal disease: Magnevist (gadopentetate dimeglumine; Berlex Laboratories, Wayne, NJ), Omniscan (gadodiamide; Amersham Health Inc., Princeton, NJ), Pro-Hance (gadoteridol) and MultiHance (gadobenate dimeglumine; Bracco Diagnostics, Princeton, NJ), and OptiMARK, (gadoversetamide; Mallinckrodt Inc., St. Louis, MO). All are gadolinium complexes. Gadolinium was chosen because it has strong paramagnetic properties.
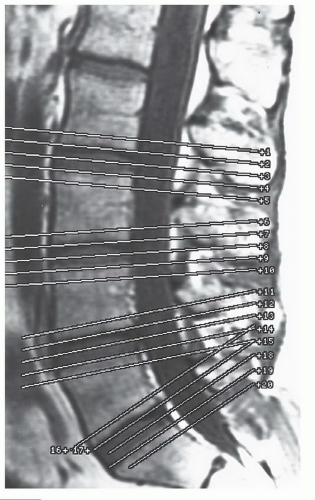 Figure 5.19 This scout view from a lumbar spine exam demonstrates the orientation of the axial slices along the disc plane. |
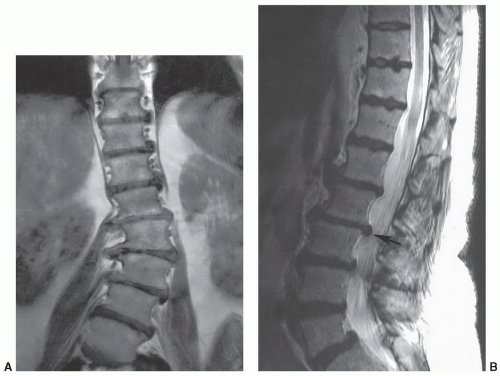 Figure 5.20 Scoliosis with curved reformatting. A: Coronal T1-weighted image demonstrating lumbar scoliosis. B: A small disc herniation (arrow) is demonstrated on a curved reformatted image, generated from a sagittal T2-weighted turbo spin-echo series. |
In contrast to conventional iodinated material where the agent itself is imaged, paramagnetic materials themselves do not produce signals. Rather, they alter the molecular environment of the tissue in which they reside, thus affecting the signal of the hydrogen nuclei present.42,43,44 The magnetic moment of a paramagnetic agent is considerably greater than the moment of the nearby hydrogen nuclei, due to the presence of unpaired electrons. Paramagnetic agents are also designed to bind water molecules. The large magnetic moment of a paramagnetic agent enhances relaxation or shortens the relaxation time of the bound water protons that are continually exchanging with free water. They enhance the T1 and T2 relaxation. At the clinically effective dosage used, the T1 relaxation effect predominates, resulting in an area of increased signal on T1-weighted sequences wherever the agent has accumulated.42,43,44
The volume of distribution of gadolinium compounds in the central nervous system (CNS) is similar to that of iodinated agents. Blood supply to the tissue and blood-brain barrier breakdown are required to allow accumulation of the agent. Gadolinium is excreted unchanged in the urine. Eighty percent is excreted within the first 6 hours, with 90% being eliminated by 24 hours. The biologic half-life is about 90 minutes.45
A more complete discussion of the uses and potential complications of gadolinium can be found in Chapter 3, General Technical Considerations in Musculoskeletal MRI.”
PATHOLOGIC CONDITIONS
Degenerative Disease
To facilitate clear communication of imaging and surgical findings, the American Society of Neuroradiology, the American Society of Spine Radiology, and the North American Spine Society developed a consensus nomenclature and classification of lumbar disc pathology.46 The definitions are based on anatomy and pathology and are not intended to imply etiology, relationship to symptoms, or need for specific treatment. This system of nomenclature and classification is used herein. The terminology was developed specifically for the lumbar spine; it may be reasonably extrapolated to describe similar anatomy and pathology in the cervical and thoracic regions.
Incidental MRI findings are a major confounder in the evaluation of patients with spinal pain. MRI commonly demonstrates degenerative interspace, disc, and facet joint abnormalities in asymptomatic persons, including high prevalence of herniated disc (20% to 70%), bulging disc (20% to 81%), degenerative disc (46% to 93%), anular tear (14% to 56%), and advanced spinal canal narrowing (1% to 21%), dependent on study population and definition of specific abnormalities.47,48 Teresi et al.49 observed asymptomatic “significant” cervical spinal cord impingement in 16% to 26% of patients referred for MR examinations of the larynx.49 These studies underscore the importance of careful correlation of the anatomic abnormalities with the specific clinical syndrome. Because of the ease in obtaining an MRI examination and its noninvasive nature, the MR examination may be performed in lieu of a detailed neurologic examination in patients with nonspecific symptoms. Caution is advised in interpreting MRI studies to avoid subjecting patients to unnecessary, potentially invasive therapies. To be most efficacious, spinal MRI for pain must be designed and interpreted in the context of the individual patient’s clinical syndrome.
American College of Radiology Appropriateness Criteria includes guidelines for imaging patients with chronic neck pain and acute low back pain.50 Despite the exquisite display of spinal anatomy, MR examination for these syndromes is best reserved for patients with clear neurologic signs or symptoms, warning signs of serious systemic disease, or evidence of bone or disc destructionon conventional radiographs.
Disc Disease (Nonsurgical)
Annular Degeneration
The most common finding for MR of the spine at our institution is degenerative disc disease. Age- and activityrelated degeneration of the disc spaces and facet joints is inevitable. Disc degeneration begins early in life as a loss of hydration resulting in loss of interspace height and diffuse bulging of the disc and annulus. Tears, or fissures, develop in the annulus fibrosis, with three distinct types identified at autopsy: concentric, radial, and transverse.51,52 Concentric and transverse tears are thought to have no clinical significance. The significance of radial tears remains controversial. Radial tears are defined as fissures extending through all layers of the annulus between the nucleus pulposus and the disc surface without herniation of the nucleus pulposus. Leakage of irritative nuclear material into the annulus fibrosis and epidural space has been implicated as a cause of chronic low back pain that has been termed “discogenic” pain.52 Small, discrete areas of increased T2 signal within the annulus fibrosis of cadavers have correlated with radial tears52 and similar areas of gadolinium enhancement in living patients have corresponded to vascularized granulation tissue within radial tears at surgery.53 Studies addressing the clinical relevance of these findings are lacking. It is important to note that the common usage of the term “anular tear” does not imply traumatic etiology.
Pfirrmann et al.54 classified disc degeneration using MRI features. Disc degeneration was graded using T2-weighted images. The grading system included structure, signal intensity, differentiation of the nucleus from the annulus, and disc height.54 A disc was considered grade I when the signal intensity was homogeneous and bright or isointense to spinal fluid, the distinction between the nucleus and annulus was clearly defined, and the disc height was normal. Grade II discs (Fig. 5.21) demonstrate inhomogeneous structure with or without horizontal bands. The distinction between the disc and annulus remains clear, signal intensity remains bright, and disc height is still normal. Grade III disc morphology loses the clear distinction between the annulus and nucleus and the disc is more intermediate in signal intensity. Disc height is also slightly decreased (Fig. 5.22). Grade IV discs are intermediate to low in signal intensity, with no distinction between the annlus and nucleus and disc height is moderately decreased. Grade V discs (Fig. 5.23) are collapsed with low signal intensity and the nucleus and the annulus cannot be differentiated.54
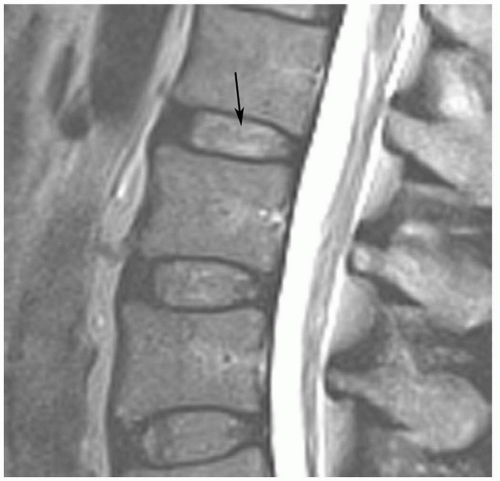 Figure 5.21 Grade II disc using MR criteria.54 There is normal disc height with clear differentiation of the disc and annulus, but there are horizontal striations (arrow). |
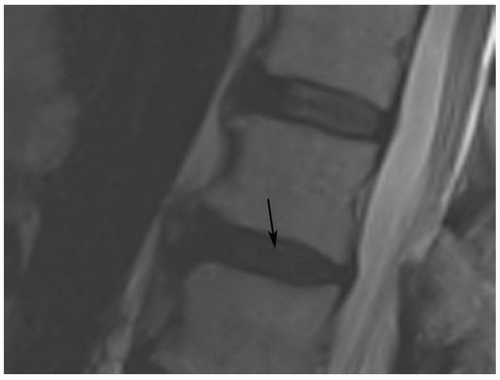 Figure 5.22 Grade III disc using MR criteria.54 The disc (arrow) is of lower signal intensity with slight loss of height, and the distinction of the nucleus and annulus is unclear. Note grade II disc one level above. |
Vertebral Body Marrow Changes
Vertebral body marrow changes are reactive modifications associated with active or chronic disc inflammation and degenerative disease. Three types of marrow signal patterns were classified by Modic et al.55 Type 1 changes are characterized by decreased signal intensity on T1-weighted images and by increased signal intensity on T2-weighted images, indicating marrow edema associated with acute or subacute inflammation and/or granulation tissue (Fig. 5.24).The granulation tissue is typically enhanced with intravenous gadolinium administration.55 Type 2 changes are characterized by increased signal on T1-weighted images and isointense or increased signal intensity on T2-weighted images, indicating reactive replacement of typical bone marrow with yellow fat (Fig. 5.25). Type 3 changes refer to decreased T1 and T2 signals due to chronic reactive osteosclerosis (Fig. 5.26). Both type 2 and type 3 findings indicate chronic vertebral changes and may be seen as sequelae to type 1 changes. While Modic changes are uncommon in asymptomatic patients, the significance in patients with spinal pain is uncertain.55 These signal changes can be quite exuberant, and it is important to recognize the degenerative etiology rather than neoplastic or infectious origins.
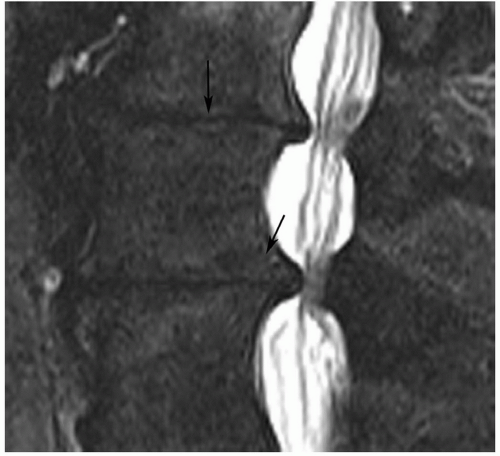 Figure 5.23 Grade V disc using MR criteria.54 Sagittal T2-weighted image demonstrates complete collapse of the disc spaces (arrow) with bony remodeling (lower arrow) and narrowing of the spinal canal. |
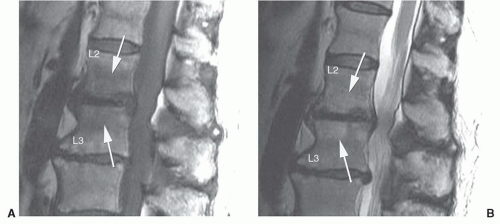 Figure 5.24 Type 1 vertebral marrow changes (Modic). A: Decreased T1 signal in the inferior aspect of L2 vertebral body and the superior aspect of L3 body. B: Corresponding T2 signal increase is seen on the T2-weighted fast spin-echo image. |
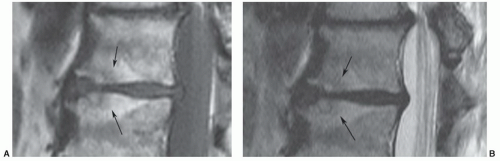 Figure 5.25 Type 2 vertebral marrow changes (Modic). A: Increased T1 signal (arrows) in inferior aspect of the L3 vertebral body and superior aspect of L4 body. B: Corresponding T2 signal increase (arrows) is seen on the T2-weighted fast spin-echo image. |
Recent reports using the Modic system have correlated changes with Modic types with patient symptoms and disc herniation.56,57,58 Type 1 changes are associated with disruption and fissuring of the end plates with granulation tissue. It is felt that type 1 disease is indicative of inflammation and more active symptomatology.56 Studies have demonstrated that 73% of patients with type 1 Modic changes are symptomatic whereas only 8% with type 2 changes have low back pain.56 Type 2 changes are usually chronic and more stable.56,57,58 Dynamic contrast-enhanced MRI changes correlate well with disc degeneration and the Modic changes, as expected.58
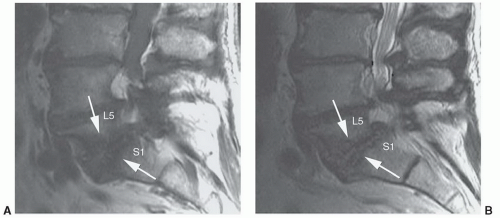 Figure 5.26 Type 3 vertebral marrow changes (Modic). A: Decreased T1 signal in the inferior aspect of L5 vertebral body and superior aspect of S1 body. B: Corresponding T2 signal decrease is seen on the T2-weighted image, characteristic of osteosclerosis. |
Disc Disease (Surgical)
Herniated Disc
Focal disc herniations result from rupture of the annulus fibrosis with protrusion or extrusion of the nuclear material into or through the annulus. In the lumbar region, herniations are most commonly posterior into the spinal canal, where they may be midline in location or paramedian to the right or left. Midline disc herniations are often asymptomatic, distorting the ventral surface of the thecal sac without impingement on individual nerve roots. Occasionally, large midline herniations will compromise the spinal canal, resulting in a cauda equina syndrome. Symptomatic posterior disc herniations typically are centered to the right or left of midline and distort the nerve root exiting the spinal canal at the next vertebral body segment. Irritation of the nerve
roots results in radiculopathy. Ten percent to 15% of all disc herniations are lateral, with extension of disc material within or beyond the neural foramen.30 These herniations can be subtle and may be confused with diffuse bulging of the annulus fibrosis. Close inspection of the neural foramina and paraspinal fat immediately lateral to the foramen may increase sensitivity. Lateral disc herniations typically cause a radiculopathy of the nerve root of the same vertebral body segment. Other locations of herniations include intravertebral herniations with extensionof disc material into adjacent vertebral bodies (Schmorl’s nodes) (Fig. 5.27) and anterior locations with extension of disc material anterior to the vertebral bodies.59,60,61 Whether or not these categories of disc herniations are clinically or surgically significant remains controversial. Currently, intravertebral and anterior herniations have no surgical significance.
roots results in radiculopathy. Ten percent to 15% of all disc herniations are lateral, with extension of disc material within or beyond the neural foramen.30 These herniations can be subtle and may be confused with diffuse bulging of the annulus fibrosis. Close inspection of the neural foramina and paraspinal fat immediately lateral to the foramen may increase sensitivity. Lateral disc herniations typically cause a radiculopathy of the nerve root of the same vertebral body segment. Other locations of herniations include intravertebral herniations with extensionof disc material into adjacent vertebral bodies (Schmorl’s nodes) (Fig. 5.27) and anterior locations with extension of disc material anterior to the vertebral bodies.59,60,61 Whether or not these categories of disc herniations are clinically or surgically significant remains controversial. Currently, intravertebral and anterior herniations have no surgical significance.
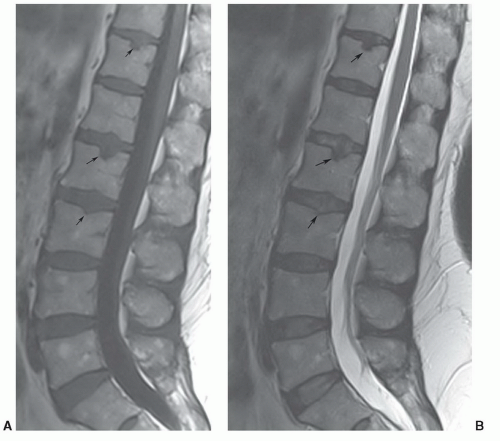 Figure 5.27 Sagittal T1-weighted (A) and T2-weighted fast spin-echo (B) images demonstrating multiple Schmorl’s nodes (arrows). |
The term herniated disc refers to localized displacement of nucleus, cartilage, fragmented apophyseal bone, or fragmented anular tissue beyond the intervertebral disc space. The disc space is defined both by the vertebral body end plates and by the edges of the vertebral ringapophyses, exclusive of osteophyte formations. To be considered herniated, disc material must be displaced from its native location in association with disruption of the annulus, or in the case of intravertebral herniation, an acquired defect of the vertebral body end plate. Subcategorization of herniation into protrusion or extrusion is based on the geometry of the displaced disc material. A disc is considered protruded (Fig. 5.28A) if the greatest distance between the edge of the native disc margin and the edge of the displaced disc material is smaller than the distance between the edges at the base of the herniation. The term extruded disc (Fig. 5.28B) is reserved for herniations in which the extension of displaced disc material beyond the native disc margin is greater than the width of the base of the herniation in any plane. Migrated disc material is an extruded disc that is displaced away from the site of extrusion, typically cranially or caudally in the anterior epidural space. A sequestered or “free” disc fragment (Fig. 5.28C) is a migrated disc material that has no evident continuity with the parent disc.
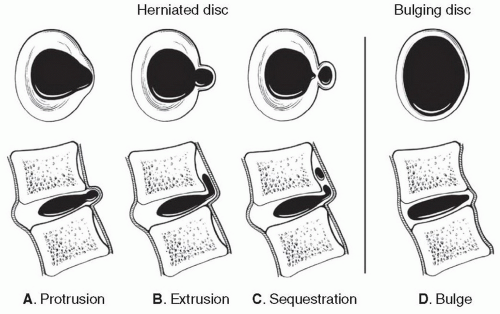 Figure 5.28 Schematic of disc herniation and bulging annulus based on consensus nomenclature. A: Disc protrusion, defined as relatively short, broad extension of disc material into the annulus fibrosis. B: Disc extrusion, defined as a taller, more narrow extension of disc material through the radial thickness of the annulus. C: Disc sequestration, defined as a migrated fragment of extruded disc that has lost continuity with the disc of origin. D: Disc bulge, defined as broad expansion of the circumference of the disc due to shortening of the interspace height and radial spreading of the nucleus and annulus. |
The term bulge refers to generalize extension of disc tissues beyond the native edges of the ring apophyses (Fig. 5.28D). Bulging of the annulus involves at least 50% of the disc circumference and extends a few millimeters beyond the apophyses in a relatively uniform manner. By definition, bulging is not a herniation because there is no radial disruption of the annulus fibrosis.
Not all disc herniations are surgical lesions.62,63,64 Anular tears and disc protrusions are frequent findings in asymptomatic patients. Disc extrusions, sequestrations, and nerve root compression are uncommon in asymptomatic volunteers.48,55,65,66 Up to 50% of interobserver variations occur due to disagreement regarding bulging discs.64 To be considered a true positive finding, the herniated disc must be large enough and in the correct location to distort or compress the specific nerve root or roots that correspond to the clinical syndrome.
On MRI, lumbar disc herniations may be suspected on sagittal images but must be confirmed on axial sequences. Posterior disc herniations result in a focal bulge in the disc contour, resulting in compression of epidural fat and mass effect upon the adjacent thecal sac or traversing nerve root sleeves. Herniations are visible typically as foci of decreased T1 and decreased T2 signal effacing the bright epidural fat on T1-weighted images and distorting the bright CSF on T2-weighted images (Fig. 5.29). Relatively acute disc extrusions (Fig. 5.30) may demonstrate signal intensity isointense or brighter than the parent disc on T2-weighted sequences, presumably secondary to local inflammatory response.64,67 Post-contrast T1-weighted axial images may better delineate the herniated disc fragment from dural sac as the peripheral portion of the disc may be enhanced, presumably secondary to ingrowth of new vessels in an attempt at repair. However, administration of intravenous gadolinium is not a standard practice in the evaluation of the unoperated spine.68 Lateral disc herniations are more challenging to detect. Sagittal or axial views often show a soft tissue mass within, or lateral to, the neural foramen that obliterates the perineural fat plane (Fig. 5.31). MRI has been shown to be equal to computed tomography (CT) myelography in the diagnosis of disc herniations in the lumbar region.69 However, MR examinations can be suboptimal for a number of reasons, including patient motion, body habitus, and asymmetric positioning. Also, patients with moderate or advanced degenerative changes typically have effacement of epidural fat, making disc herniation more difficult to recognize against a background of similar signaling structures. Up to 20% of clinically significant herniations may escape detection and a CT myelogram may be indicated in a patient with a clear radiculopathy and a discordant MR examination.70
In the cervical spine, simple disc herniation is less common than in the lumbar regions. Osteophytes and disc-osteophyte complexes are the more common cause of nerve root irritation and radiculopathy. Many earlier studies showed MRI to be more or less equal to CT myelography in diagnosing disc herniations, particularly if the herniated fragment is large or has a midline component(Fig. 5.32).71,72
Today, MRI has become the technique of choice for imaging of the majority of causes of cervical myelopathy.71,72,73,74,75,76 However, effective MRI of degenerative disease in the cervical spine (specifically differentiating hard and soft cervical disc disease) is remains a challenge. Treatment approaches may dictate the imaging technique that is required. For example, chemonucleolysis is only successful for treatment of soft disc disease. Surgical decompression is usually required for hard disc (calcified or osteophytes).74
Structures are smaller in the cervical spine than in the lumbar spine; there is limited soft tissue contrast because of a relative lack of epidural fat; and patient swallowing motion requires relatively short scan times. Recent studies have demonstrated that MRI using sagittal T2-weighted fast spin-echo, sagittal gadolinium-enhanced T1-weighted, and axial gradient-echo sequences could effectively demonstrate disc disease (Fig. 5.33). Using these sequences, 94% of anular tears demonstrated enhancement on post-contrast T1-weighted images.75 However, differentiation of hard (calcified or osteophytes) from soft discs may still be inconsistent. Sengupta et al.74 found sensitivity of 87% for the diagnosis of a hard disc but the specificity was only 44%.
CT myelography also has limitations, but the spatial resolution is higher and the combination of a cervical myelogram and high-resolution CT can afford the best opportunity to diagnose clinically significant small cervical herniations and separate hard from soft discs.74 Therefore, depending upon preferred treatment methods, CT may be required to assist in differentiating the type of disc disease.74,75,76
Disc herniations may also occur in the thoracic region. However, of the three spinal segments, the incidence of symptoms from disc disorders is the lowest in the thoracic spine.77,78 There are no large meta-analyses on imaging features of thoracic disc disorders.78 However, many of these lesions have no clinical or surgical significance, unless large and causing spinal cord compression and myelopathy symptoms.77
A recent review of 480 thoracic disc levels by Girard et al.,78 demonstrated disc herniation at 10% of all levels, with most herniations (75%) occurring from T6 to T9. Disc herniation on follow-up studies was stable in 67% and improved in 27% of disc levels reviewed. Disc degeneration was noted at 14% of levels occurring most commonly from T6 to T10. Modic type marrow changes occur less commonly in the thoracic spine (2.3%).78
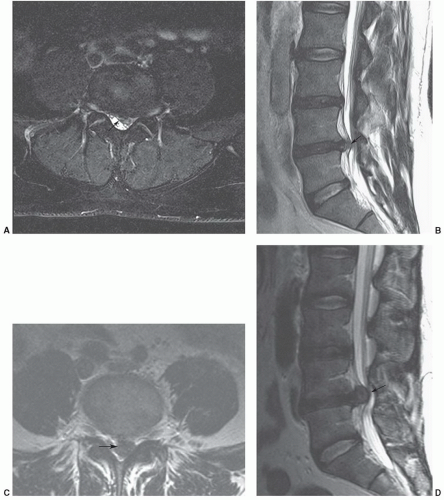 Figure 5.29 Lumbar disc protrusion. Axial T2-weighted (A) and turbo spin-echo fat-suppressed sagittal T2-weighted (B) images demonstrate a paramidline disc herniation (arrows). Axial (C) and sagittal (D) T2-weighted images 10 months later demonstrate dramatic progression (arrows) with near complete effacement of the thecal sac. |
Similar MRI criteria, as used in the cervical or lumbar region, are applied in the thoracic spine.77 Axial images are necessary to determine the degree of cord compression. Most often, we use sagittal T1- and T2-weighted fast spin-echo sequences and axial T2-weighted fast spin-echo sequences for initial screening of the thoracic spine (Fig. 5.34).
Spinal Stenosis
Spinal stenosis is due to narrowing of the spinal canal, lateral recesses, or foramina due to progressive hypertrophy of the surrounding soft tissue and osteocartilaginous structures (Fig. 5.35). The process may affect multiple levels, involve one or more of these anatomic regions, and most commonly involves the lumbar and cervical spine.79,80,81,82,83,84 The thoracic
spine is uncommonly involved.82 Patients with lumbar spinal stenosis most commonly present in the fifth and sixth decades.83 Clinical symptoms may include neurogenic claudication (the classic presentation), nerve root compression, central low back pain, and nonradicular lower extremity pain.83
spine is uncommonly involved.82 Patients with lumbar spinal stenosis most commonly present in the fifth and sixth decades.83 Clinical symptoms may include neurogenic claudication (the classic presentation), nerve root compression, central low back pain, and nonradicular lower extremity pain.83
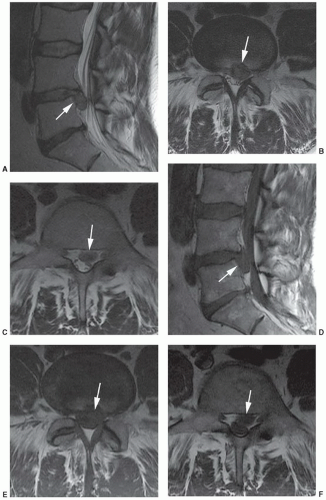 Figure 5.30 Lumbar disc extrusion. L4 disc herniation with the distance from the edge of the extruded fragment greater than the width of the base. Inferior migration of disc material caudal to the superior end plate of L5. A and D: The disc material has T2 and T1 signal intensities similar to the parent disc. Axial views establish the central and left central location of the extrusion with distortion of the thecal sac and left L5 root sleeve origin on the T2-weighted images (B and C) and effacement of epidural fat on the T1-weighted images (E and F). |
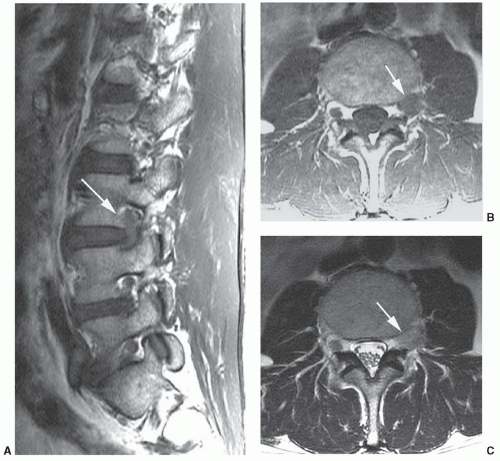 Figure 5.31 Lateral disc extrusion. A: Sagittal T1-weighted image shows abnormal soft tissue mass in left L3 foramen (arrow). B: Axial T1-weighted image immediately cranial to L3 end plate shows abnormal soft tissue that effaces the normal fat plane surrounding the L3 nerve root sleeve (arrow). C: Axial T2-weighted image at the same level as B shows the extruded disc material (arrow) between edge of the L3 end plate and displaced L3 nerve root (arrow). |
The characteristic degenerative process involves loss of interspace height associated with degenerative disc disease that may result in malalignment and altered mechanical stresses upon the facet joints and ligaments. Reactive remodeling of the interfaces can result in bone hypertrophy manifested as ridges of very low-signal cancellous bone and redundancy of the ligamentum flavum. Facet joint hypertrophy and diffuse bulging of the annulus fibrosis can result in narrowing of the spinal canal, lateral recesses, or neural foramina. This process may affect multiple levels and may progress to spinal cord or cauda equina compression, resulting in the clinical syndrome known as spinal stenosis. These degenerative changes are manifested on MRI as ventral and dorsolateral extradural impressions at the level of the interspaces (Fig. 5.36). Axial T1-weighted and T2-weighted images, preferably parallel to the interspaces in question, are essential for characterizing the degree of spinal canal narrowing, as sagittal images can be misleading. T1-weighted sequences tend to underestimate the degree of spinal and foraminal narrowing, whereas T2-weighted or gradient-echo images tend to overestimate it. Similar changes occur in the cervical region, and rarely in the thoracic region, which can be asymptomatic or cause a compressive myelopathy (Fig. 5.37). The incidence of myelopathy increases as the cord becomes more deformed and compressed.79,84 As in the lumbar spine, these changes usually involve multiple levels and predominantly involve the mid and lower cervical interspaces. In acute or subacute cord compression, edema may be seen as an increase in T2 signal closely related to the level of cord distortion, with indistinct transition to normal cord signal above and below the compression. With chronic
compression, relatively shorter segments of increased T2 signal and cord atrophy may be demonstrated, representing cystic necrosis and volume loss from myelomalacia.80,81,84 This finding has prognostic significance, as patients with myelomalacia respond less favorably to surgical or medical management than those without.81,84 These patients have a poor prognosis regardless of management. When the imaging findings do not correlate with the patient’s specific signs and symptoms, a CT myelogram may provide valuable additional information.82
compression, relatively shorter segments of increased T2 signal and cord atrophy may be demonstrated, representing cystic necrosis and volume loss from myelomalacia.80,81,84 This finding has prognostic significance, as patients with myelomalacia respond less favorably to surgical or medical management than those without.81,84 These patients have a poor prognosis regardless of management. When the imaging findings do not correlate with the patient’s specific signs and symptoms, a CT myelogram may provide valuable additional information.82
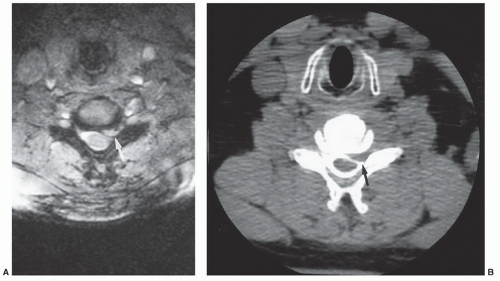 Figure 5.32 Cervical disc extrusion. A: Gradient-echo axial image showing a focal disc extrusion at C6 on the left that effaces the subarachnoid space and partially fills the neural foramen (white arrow). B: Post-computed tomography myelography image at the same level confirms these findings (arrow). |
Synovial Cyst
Synovial cysts arise from periarticular tissues and may arise in any joint, including the facet joints of the spine. The majority of cysts (90%) occur in the lumbar spine, with the remaining 10% in the cervical spine.82 They are typically associated with facet joint degeneration and are an uncommon cause of radiculopathy or spinal stenosis syndromes. Synovial cysts present as a posterolateral epidural mass, intimately associated with the ligamentum flavum, with signal similar to CSF on T1- and T2-weighted sequences. Their appearance is variable because the cysts may contain calcium, air, or hemorrhage byproducts (Fig. 5.38).85,86,87,88,89
Related posts:

Stay updated, free articles. Join our Telegram channel

Full access? Get Clinical Tree


