techniques should be used to reduce motion artifact in the upper pelvis. Thinner slices can be used if a more defined area of the anatomy is to be studied.
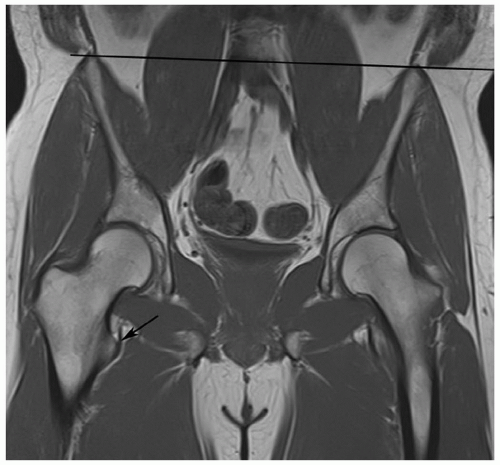 Figure 6.1 Coronal T1-weighted image of the pelvis demonstrating rotation of the patient such that the lesser trochanter on the right (arrow) is seen but cannot be compared on the section with the left femur. The pelvis is also tilted (black line across the iliac crests). |
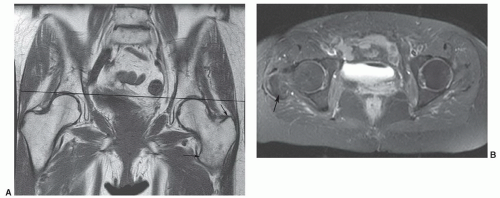 Figure 6.2 A: Coronal T1-weighted image demonstrates pelvic tilt (black line) and patient rotation with the trochanters (arrows) evident on the left, but at a different level on the right. B: Fat suppressed fast spin-echo T2-weighted axial image demonstrates that the femoral heads are at different levels. The greater trochanter on the right (arrow) is visible and the upper portion of the contralateral femoral head is partially visualized. |
flip angle 40°).22 Thin section fast scan three-dimensional techniques can be reformatted in multiple planes to more easily assess subtle changes in articular cartilage.23 Axial and coronal or sagittal T1-weighted spin-echo and T2-weighted turbo spin-echo sequences provide initial screening of the thighs (Table 6.1).
Table 6.1 MR Examinations of the Pelvis, Hips, and Thighs (based upon 1.5 T units) | ||||||||||||||||||||||||||||||||||||||||||||||||||||||||||||||||||||||||||||||||||||||||||||||||||||||||||||||||||||||||||||||||||||||||||||||||||||||||||||||||||||||||
|---|---|---|---|---|---|---|---|---|---|---|---|---|---|---|---|---|---|---|---|---|---|---|---|---|---|---|---|---|---|---|---|---|---|---|---|---|---|---|---|---|---|---|---|---|---|---|---|---|---|---|---|---|---|---|---|---|---|---|---|---|---|---|---|---|---|---|---|---|---|---|---|---|---|---|---|---|---|---|---|---|---|---|---|---|---|---|---|---|---|---|---|---|---|---|---|---|---|---|---|---|---|---|---|---|---|---|---|---|---|---|---|---|---|---|---|---|---|---|---|---|---|---|---|---|---|---|---|---|---|---|---|---|---|---|---|---|---|---|---|---|---|---|---|---|---|---|---|---|---|---|---|---|---|---|---|---|---|---|---|---|---|---|---|---|---|---|---|---|
| ||||||||||||||||||||||||||||||||||||||||||||||||||||||||||||||||||||||||||||||||||||||||||||||||||||||||||||||||||||||||||||||||||||||||||||||||||||||||||||||||||||||||
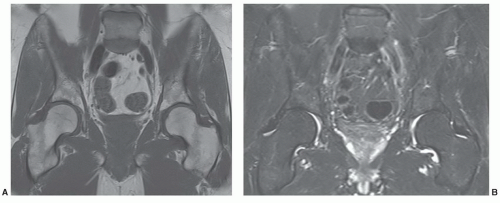 Figure 6.3 3.0 T coronal images of the pelvis and hips. A: Coronal 650/10 image with 1 echo train. B: Coronal turbo spin-echo 3800/62 with 7 ET. |
changes in articular cartilage and synovium.19,21,24,25 Conventional sequences are usually performed followed by fat-suppressed T1-weighted sequences after contrast injection (Fig. 6.7).
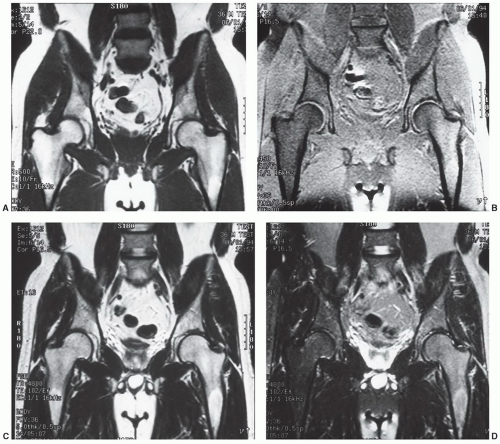 Figure 6.4 1.5 T coronal images of the pelvis and hips. Coronal SE 500/10 (A) and fat-suppressed SE 450/10 (B) images. Coronal fast T2 (4800/102) (C) and fat-suppressed fast spin-echo T2 (4800/102) (D) sequences. There are contrast differences and there is less fat suppression with fast spin-echo T2-weighted sequences compared to conventional spin-echo T2-weighted sequences. Note the uneven suppression of fat signal and signal intensity loss on the left compared to right on these images. Uniform fat suppression is important to prevent errors in image interpretation. |
that radial imaging does not add significant new information to the study.30 Therefore, we do not perform radial imaging at our institution. T1-weighted fat-suppressed spin-echo and turbo spin-echo T2-weighted sequences are most commonly used with MR arthrography.20,27 Three-dimensional gradient-echo sequences (30/9, 45° flip angle) can also be utilized.26,31
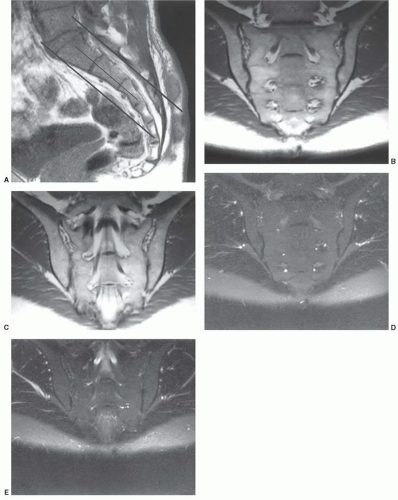 Figure 6.5 Scout sagittal image (A) to select image planes and sections for evaluation of the sacrum and sacroiliac joints. Oblique coronal images of the sacrum and sacroiliac joints using T1-weighted (B, C) images and fat-suppressed, T2-weighted (D, E) images at similar levels. |
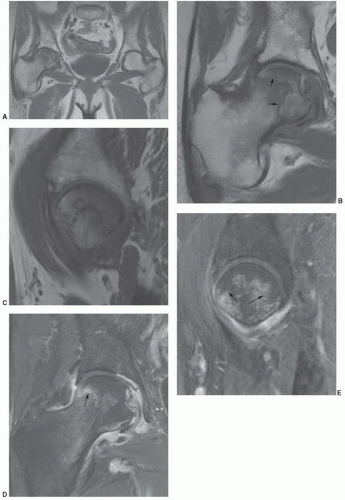 Figure 6.6 Osteonecrosis of the right femoral head. A: Coronal T1-weighted image of both hips using the torso coil and a large field of view (42 cm). Small field of view (16 cm) surface coiled images using T1-weighted coronal (B) and sagittal (C) and fast spin-echo T2-weighted coronal (D) and sagittal (E) sequences show the necrotic interface (arrows) to better detail. |
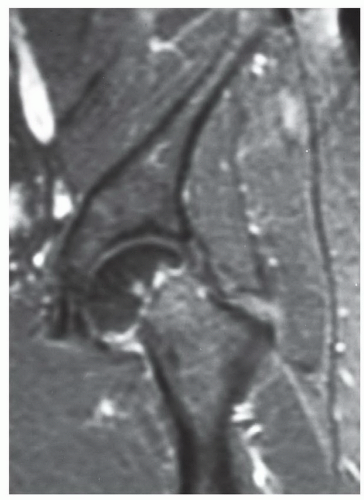 Figure 6.7 Coronal post-contrast fat-suppressed T1-weighted image demonstrates a femoral neck fracture with no enhancement of the femoral head due to vascular injury. |
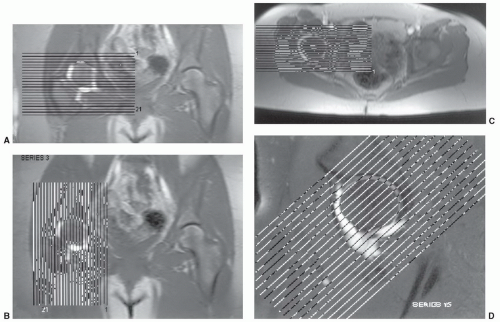 Figure 6.8 Normal MR arthrogram. Scout axial (A), sagittal (B), coronal (C), oblique coronal (D), and oblique sagittal (E) images. Normal axial (F), coronal (G), and sagittal (H) arthrogram images. The joint capsule attaches several millimeters proximal to the superior labrum (arrow in G) creating the superior acetabular recess. |
T1-weighted images are useful for evaluating subtle changes.2,10
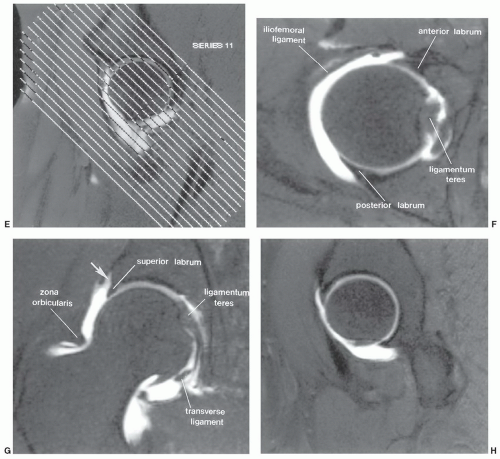 Figure 6.8 (Continued) |
pubic and arcuate ligaments that encase a fibrocartilaginous disc. The disc lies between the two pubic bones (Figs. 6.9 and 6.12).37,38 The sacroiliac joint is a synovial joint with posterior and anterior ligamentous support (Fig. 6.12). The posterior ligaments are stronger than the anterior ligaments, which allow some anterior motion. In addition, there are several accessory ligaments that assist in the support of the sacroiliac joint. These include the sacrotuberous ligament, which extends from the inferolateral margin of the sacrum to the ischial tuberosity; the sacrospinous ligament, which extends from the lower margin of the sacrum to the ischial spine; and the iliolumbar ligament, which extends from the anterior inferior transverse process of L5 and passes inferiorly to blend with the anterior sacroiliac ligament along the base of the sacrum. These ligamentous structures appear dark or have no signal intensity on MR images. The synovial cavity of the sacroiliac joint contains only a small amount of fluid. Joint fluid is most easily identified on axial T2-weighted or contrast-enhanced MR images (Fig. 6.7).37,38
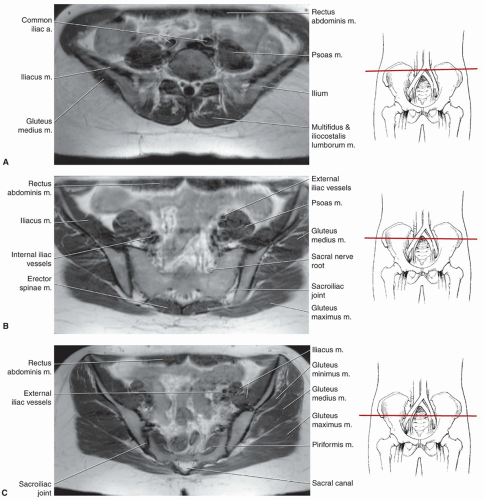 Figure 6.9 Axial MR images (SE 405/16) of the pelvis, hips, and upper thighs with accompanying illustration of the section levels to demonstrate MR anatomy of the pelvis and hips. A: Axial image through the upper pelvis. B: Axial image through the upper sacrum. C: Axial image through the lower sacroiliac joint. D: Axial image through the sciatic notch. E: Axial image through the anterior inferior iliac spine. F: Axial image through the upper femoral head. G: Axial image through the femoral head and greater trochanter. H: Axial image through the femoral neck. I: Axial image through the lesser trochanter. J: Axial image through the upper femur. K: Axial image through the upper thigh. |
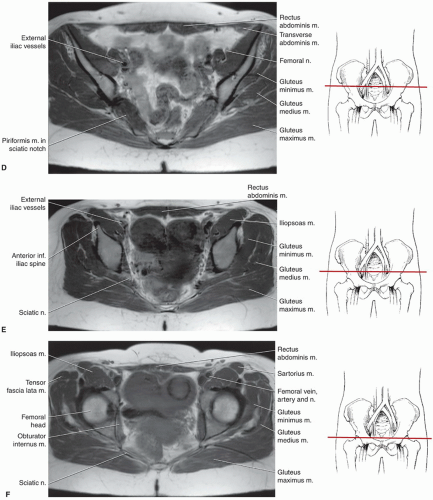 Figure 6.9 (Continued) |
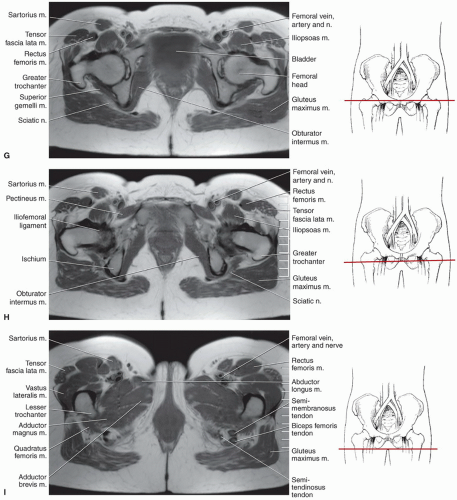 Figure 6.9 (Continued) |
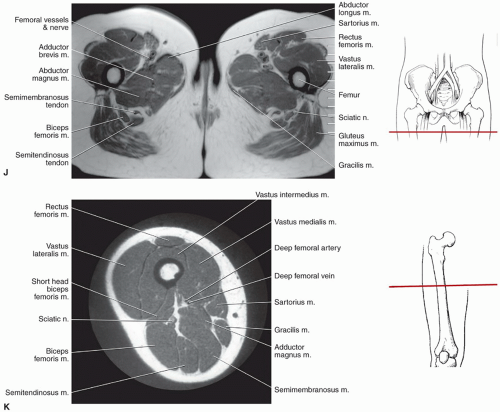 Figure 6.9 (Continued) |
to the lower part of the anterior inferior iliac spine and body of the ilium. The base of this triangular ligament attaches to the intertrochanteric lines (Fig. 6.15). The ischiofemoral ligament, the thinnest of the three major ligaments, arises from the ischium behind and below the acetabulum. Its upper fibers are horizontal; its lower fibers extend upward and laterally and attach to the upper posterior neck at the junction of the greater trochanter. The vascular supply of the hip and femoral head is important, especially in the etiology of osteonecrosis. This is discussed in depth in the section on osteonecrosis.34,38,41,42
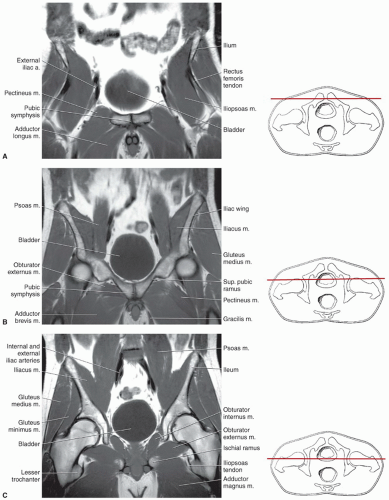 Figure 6.10 Coronal MR images (SE 450/15) and accompanying illustrations of section levels of the pelvis, hips, and thighs. A: Coronal image through the pubic symphysis. B: Coronal image through the anterior aspect of the hips. C: Coronal image through the midjoint space of the hip. D: Coronal image through the greater trochanteric level of the hips. E: Coronal image through the ischium. |
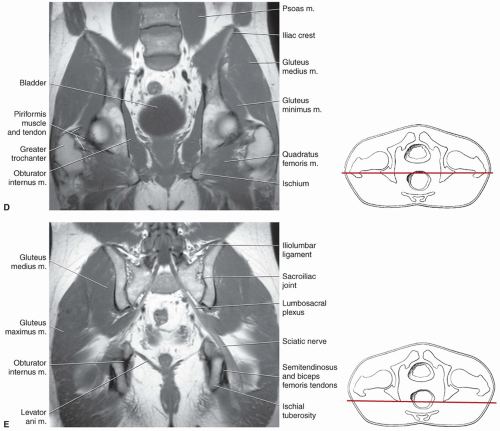 Figure 6.10 (Continued) |
images.44,45 The bulk of the iliacus muscle run parallel to the iliopsoas tendon and attach to the proximal femur. In some cases, a small iliacus tendon runs parallel to the iliopsoas tendon as it attaches to the lesser trochanter. The iliopsoas tendon is separated from the iliacus muscle and tendon by a small amount of fatty tissue (Fig. 6.18).44,45
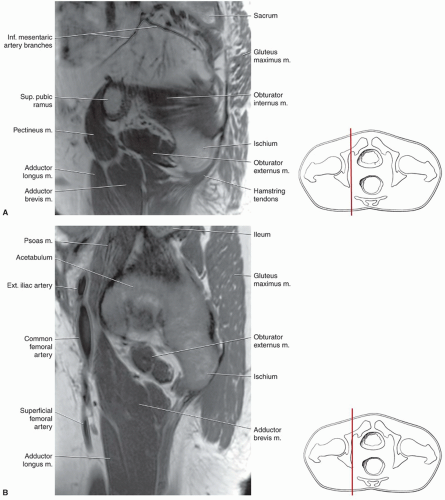 Figure 6.11 Sagittal MR images (SE 450/15) and accompanying anatomic illustrations section levels of the pelvis, hips, and thighs progressing from medial to lateral. A: Sagittal image through the medial ilium near the sciatic notch. B: Sagittal image through the level of the iliopectineal imminence. C: Sagittal image through the medial joint space. D: Sagittal image through the medial femoral head. E: Sagittal image through the femur. F: Sagittal image through the level of the greater trochanter. |
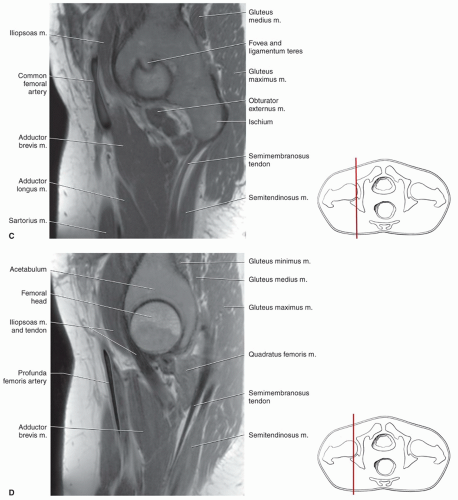 Figure 6.11 (Continued) |
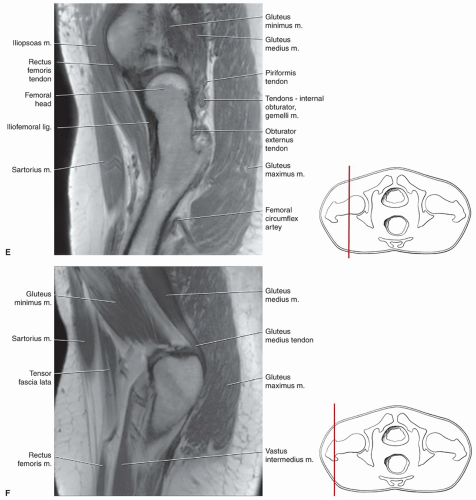 Figure 6.11 (Continued) |
internal rotation. External rotation of the hip is accomplished by the gluteus maximus and the short rotators of the gluteal region including the piriformis, obturator internus, and the gemelli muscles (Fig. 6.19).34,38,44
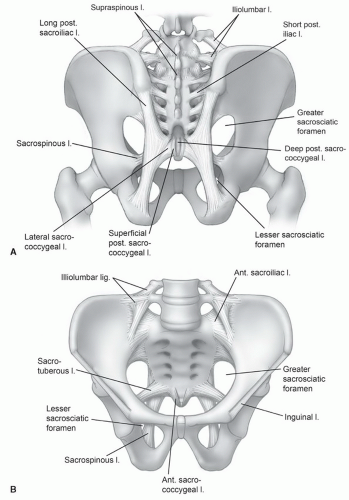 Figure 6.12 Illustration of the ligaments of the posterior sacroiliac region (A) and anterior sacroiliac region (B) and symphysis. |
these bursae are seen as well defined, high intensity lesions near the insertions (T2-weighted sequences).10,47
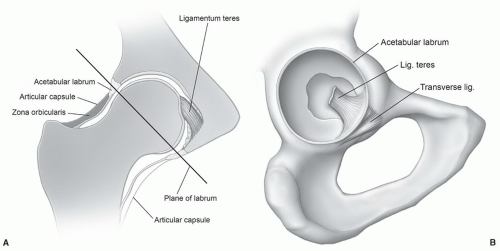 Figure 6.13 A: Coronal illustration of the hip demonstrating the major articular components and capsule and the plane (line) of the labrum. B: Enface illustration of the acetabular fossa and labrum. |
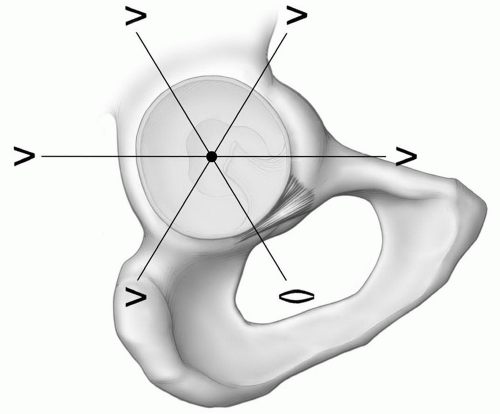 Figure 6.14 Illustration of radial planes and labral configurations. |
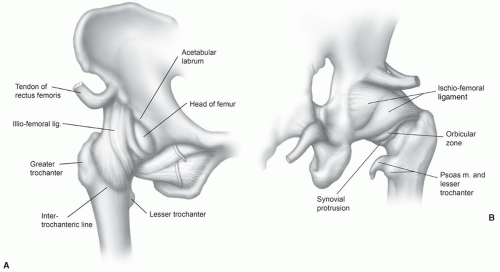 Figure 6.15 Illustration of the supporting ligaments of the hip from anterior (A) and posterior (B). |
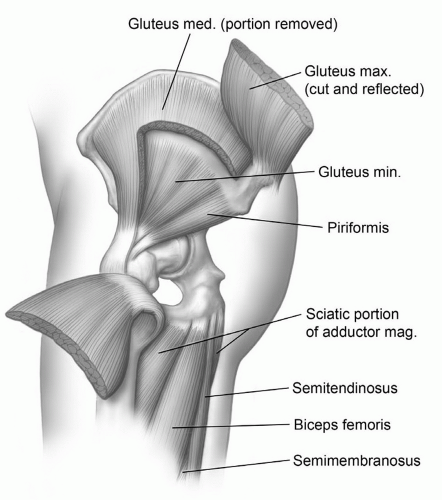 Figure 6.16 Illustration of the extensors of the thigh. |
arises from the adjacent borders of the last thoracic and first lumbarvertebrae and extends along the anterolateral margin of the psoas major to insert on the iliopectineal eminence of the innominate bone. The iliacus takes its origin from the internal surface of the ilium below the iliac crest and passes slightly obliquely anterior to the hip joint, inserting with the psoas muscle in the lesser trochanter (Fig. 6.21). An important bursa (can cause clinical symptoms and local hip pain) is the iliopsoas bursa, which lies beneath the iliopsoas muscle just as it crosses the anterior surface of the hip joint. This bursa may approach 3 to 7 cm in length and 2 to 4 cm in width. The bursa communicates with the hip joint in up to 15% of patients (Fig. 6.22).34,38,44,46
Table 6.2 Muscles of the Pelvis, Hips, and Thigh | |||||||||||||||||||||||||||||||||||||||||||||||||||||||||||||||||||||||||||||||||||||||||||||||||||||||||||||||||||||||||||||||||||||||||||||||||||||||||||
|---|---|---|---|---|---|---|---|---|---|---|---|---|---|---|---|---|---|---|---|---|---|---|---|---|---|---|---|---|---|---|---|---|---|---|---|---|---|---|---|---|---|---|---|---|---|---|---|---|---|---|---|---|---|---|---|---|---|---|---|---|---|---|---|---|---|---|---|---|---|---|---|---|---|---|---|---|---|---|---|---|---|---|---|---|---|---|---|---|---|---|---|---|---|---|---|---|---|---|---|---|---|---|---|---|---|---|---|---|---|---|---|---|---|---|---|---|---|---|---|---|---|---|---|---|---|---|---|---|---|---|---|---|---|---|---|---|---|---|---|---|---|---|---|---|---|---|---|---|---|---|---|---|---|---|---|
| |||||||||||||||||||||||||||||||||||||||||||||||||||||||||||||||||||||||||||||||||||||||||||||||||||||||||||||||||||||||||||||||||||||||||||||||||||||||||||
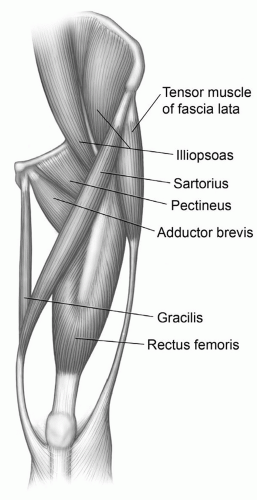 Figure 6.17 Illustration of the flexors of the thigh. |
is from the femur just below the greater trochanter and posterolaterally along the margin of the linea aspera and intermuscular septum. The vastus intermedius inserts along the upper lateral margin of the patella forming a portion of the quadriceps tendon. The vastus medialis makes its origin anteriorly from just below the lesser trochanter and the medial and posterior aspect of the femur. It extends inferiorly and inserts into the medial aspect of the rectus femoris tendon. The vastus intermedius covers a major portion of the front and medial and lateral aspects of the femur (Fig. 6.21).34,37,48 It is completely covered superficially by the vastus lateralis and medialis on its sides and the rectus femoris anteriorly. Distally, its fibers fuse with the vastus medialis and lateralis to insert in the posterior upper surface of the patella.33,34,37,38
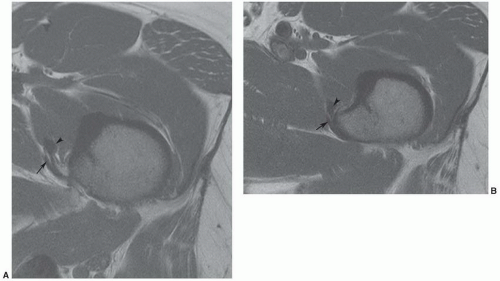 Figure 6.18 Axial T1-weighted MR images (A and B) demonstrating the relationship of the iliacus intermuscular tendon (arrowhead) and the iliopsoas tendon (arrow) medially as they attach to the lesser trochanter. |
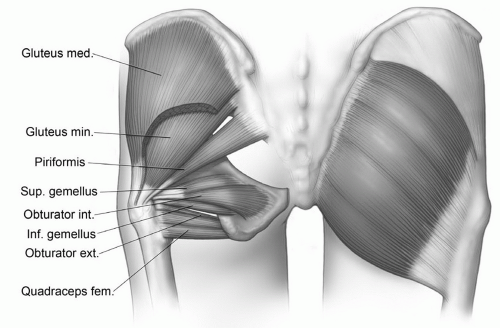 Figure 6.19 Illustration of the external rotators of the hip. |
femur that extends inferiorly from the lesser trochanter to the linea aspera (Fig. 6.21).37,38 Anatomists often include the adductor brevis, adductor longus, adductor magnus, gracilis, and obturator externus in the anterior medial muscle group, as all of these muscles are innervated by the obturator nerve (Table 6.2).38 In the axial plane, the adductor longus is the most anterior of the adductor muscles in the upper thigh (Fig. 6.9). The adductor longus takes its origin from the pubic bone superiorly near the pubic symphysis and extends in a triangular fashion inferiorly and laterally to insert along the medial aspect of the linea aspera at the level of the mid femur. This muscle forms the floor of the femoral triangle along with the pectineus and iliopsoas muscle. The adductor brevis arises from a broad tendon from the body and inferior ramus of the pubis and expands in a triangular fashion to insert in the upper half of the linea aspera. It is typically seen between the adductor longus and magnus on the axial views with the gracilis running along its medial aspect (Figs. 6.9 and 6.21).10,33,34,37,38
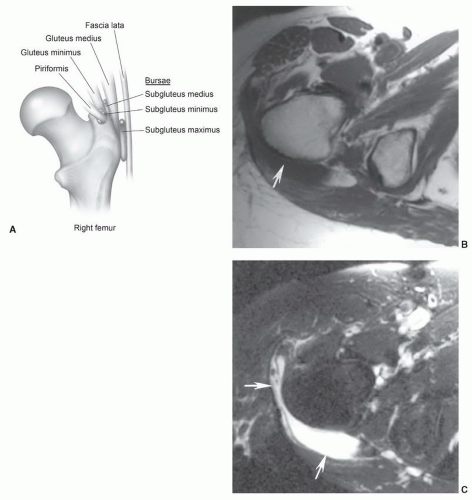 Figure 6.20 A: Illustration of bursae near the greater trochanter. Axial T1- (B) and T2-weighted (C) images demonstrating trochanteric bursitis (arrows). |
(Figs. 6.9, 6.10, and 6.21). It passes medially along the thigh, superficial to the adductor muscles (Fig. 6.10). Near the knee, it lies first between the sartorius and semimembranosus and then between the sartorius and semitendinosus. Below the knee, the tendon curves anteriorly and inserts in the upper medial anterior tibia with a bursa termed the anserine bursa intervening between gracilis, sartorius, and semitendinosus tendons and the tibia.10,34
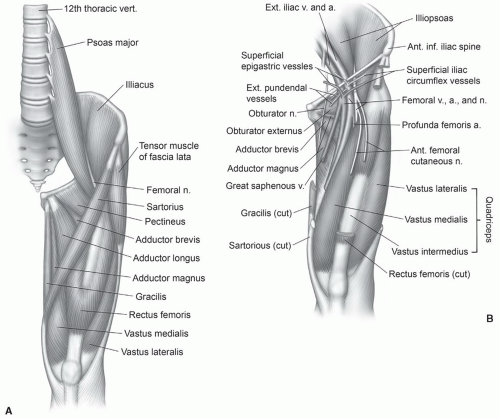 Figure 6.21 Illustration of the anterior musculature (A) and neurovascular structures of the thigh (B). |
lateral to the common origin of the biceps femoris and semitendinosus (Fig. 6.23). The muscle becomes tendinous posterior to the medial meniscus as it crosses the knee. At the level of the joint, it gives off an oblique expansion that also attaches to the medial collateral ligament. Its insertion is the posterior medial aspect of the upper tibia just below the knee.33,34,37,43,44
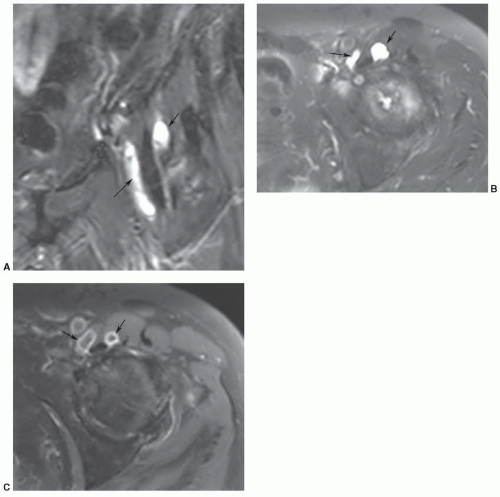 Figure 6.22 Bi-lobed iliopsoas bursa in a patient with advanced degenerative arthritis of the left hip. Coronal (A) and axial (B) T2-weighted images and post-contrast fat suppressed T1-weighted image (C) demonstrate a bursa (arrows) extending on both sides of the iliopsoas tendon. |
circumflex arteries and branches of the obturator artery (via ligamentum teres) supply the hip. The superficial femoral and deep femoral (profunda) arteries form slightly distal to this level (Fig. 6.24).2,38,41; they branch at about the same level as the superficial femoral and saphenous veins (Fig. 6.24). The course of the major arteries and companion veins is easily followed on contiguous axial MR images (Fig. 6.9). In the upper thigh (Fig. 6.24), the superficial femoral artery lies anterior to the adductor longus and deep to the sartorius. The profunda femoris artery and vein lie more laterally between the adductor longus and magnus near the linea aspera of the femur (Fig. 6.9). Perforating branches are usually identifiable between the adductor magnus and hamstring muscles just posterior and slightly lateral to the linea aspera of the femur.34,38 Today, MR angiography is capable of demonstrating all major vessels (Fig. 6.27).
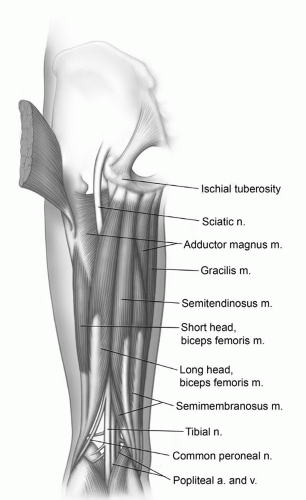 Figure 6.23 Illustration of the hamstring muscle group. |
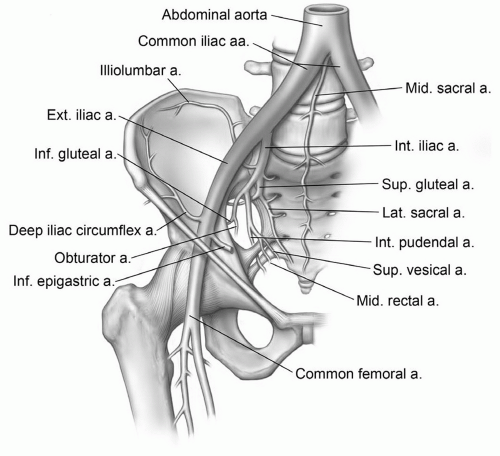 Figure 6.24 Illustration of the major vessels to the pelvis and thighs. |
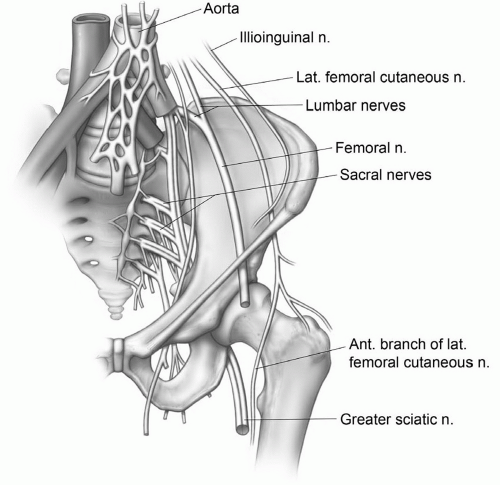 Figure 6.25 Illustration of the major neural structures of the pelvis and hips. |
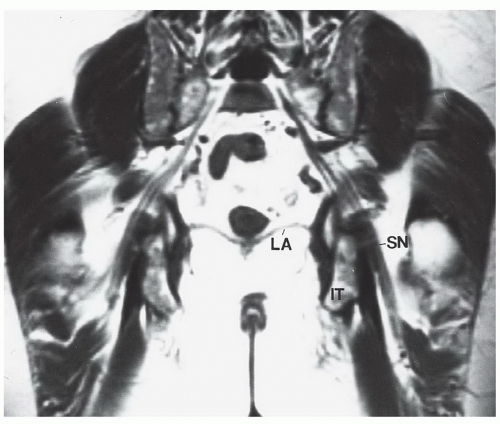 Figure 6.26 Coronal SE 450/15 image of the pelvis demonstrating the course of the sacral plexus and sciatic nerve. Note the relationship of the sciatic nerve to the ischium. SN, sciatic nerve; IT, ischial tuberosity; LA, levator ani. |
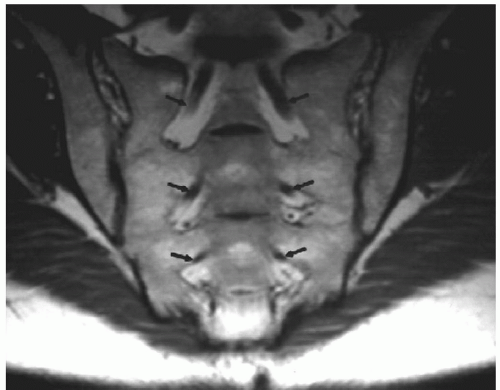 Figure 6.27 Oblique T1-weighted coronal images demonstrating the sacral nerve roots (arrows) surrounded by fat as they exit the ventral foramina. The sacroiliac joints are also well demonstrated. |
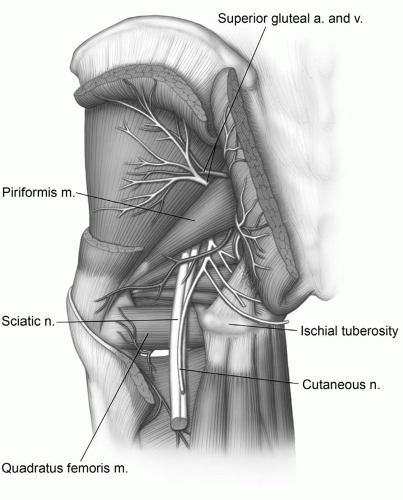 Figure 6.28 Neurovascular anatomy of the gluteal region. |
other parameters. There are new work-in-progress processing techniques that have dramatically improved the utility of MR imaging in the presence of orthopedic implants (Fig. 6.32). Titanium implants produce less artifacts than cobaltchromium alloys due to reduced ferromagnetic content.52,53 This section focuses on bone and soft tissue variants, which require further discussion.54,55
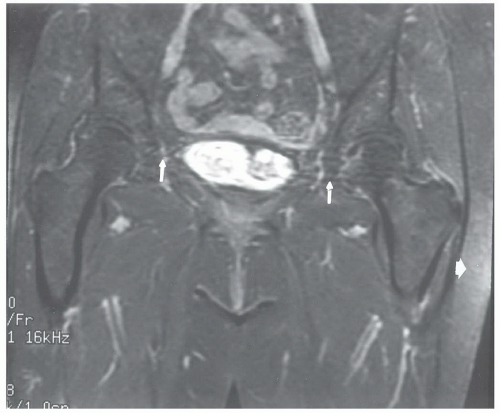 Figure 6.29 Coronal T2-weighted, fat-suppressed MR image of the pelvis demonstrating motion artifact (upper arrows) and asymmetric fat suppression (large white arrow). |
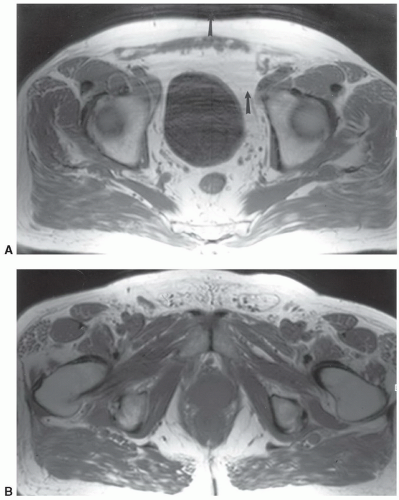 Figure 6.30 Respiratory motion artifact in the phase encoding direction. Axial T1-weighted images of the upper pelvis (A) and more inferiorly at the level of the ischial tuberosities (B). There is considerable artifact in A (arrows) due to respiratory and bowel motion. |
changes vary with the extent, eccentric nature, and time since the activity occurred.58 Typically, the entire muscle is involved and changes usually are not similar to neoplasms or other soft tissue pathology.
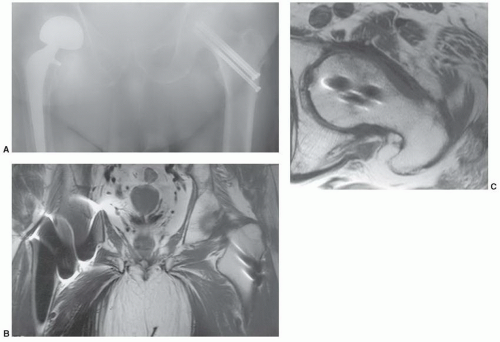 Figure 6.31 A: Anteroposterior view of the pelvis in a patient with a bipolar implant on the right and three cannulated screws on the left. Coronal (B) T1-weighted image shows artifact bilaterally, greater on the right. Axial T1-weighted image of the left hip (C) shows minimal artifact around the hip pins. The marrow is clearly demonstrated. |
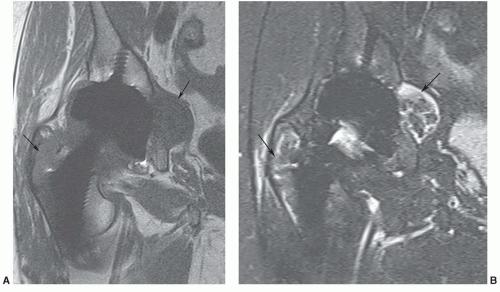 Figure 6.32 Work in progress sequence demonstrating minimal artifact about the total hip implants. Coronal T1-weighted (A) and turbo STIR with echo train length of 17 (B) images demonstrating osteolysis about the femoral and acetabular components (arrows). |
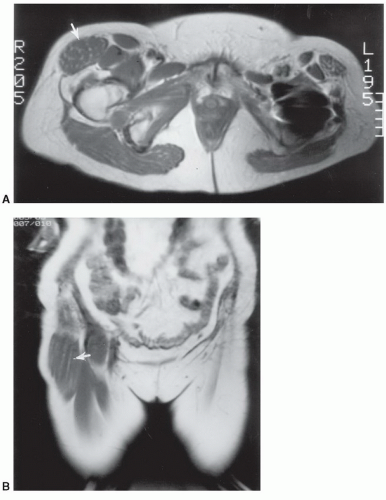 Figure 6.33 Hypertrophy of the tensor fascia lata. Axial (A) and coronal (B) T1-weighted images demonstrate marked enlargement of the muscle that was felt to be a soft tissue mass clinically. |
and femur can lead to a false-positive diagnosis such as osteonecrosis or metastasis (Fig. 6.39).64
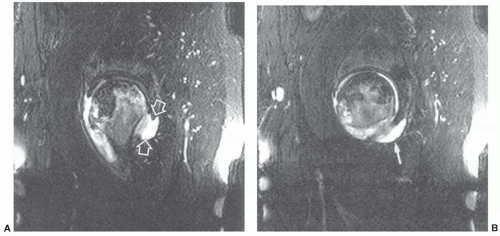 Figure 6.34 Sagittal T2-weighted fat-suppressed fast spin-echo images (A, B) in a patient with osteonecrosis demonstrate a joint effusion with an obturator externus bursa. A: Posterior communication with the joint (open arrows). B: The bursa extending medially. (From Robinson P, White LM, Agur A, et al. Obturator externus bursa: Anatomic origin and MR imaging features of pathologic involvement. Radiology 2003;228:230-234.) |
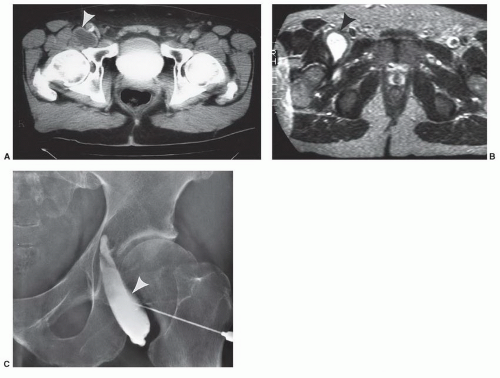 Figure 6.35 Enlarged iliopsoas bursa (arrowhead) mistaken for a mass. CT (A) and T2-weighted (B) MR images demonstrate a characteristic enlarged bursa (arrowhead). The bursa was injected with contrast medial (C) and aspirated for diagnosis and treatment. Aspiration is usually not successful for long-term treatment. |
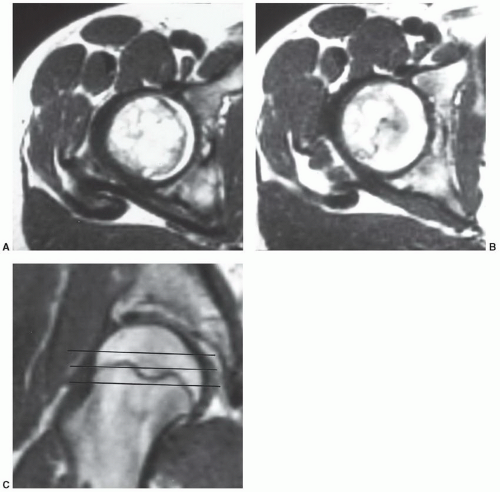 Figure 6.36 Axial T1-weighted images (A, B) through the normal physeal region of the femoral head. These bizarre signal intensity changes should not be confused with pathology. Coronal t1-weighted image (C) shows the irregular course of the growth plate. Lines demonstrate the axial image planes. |
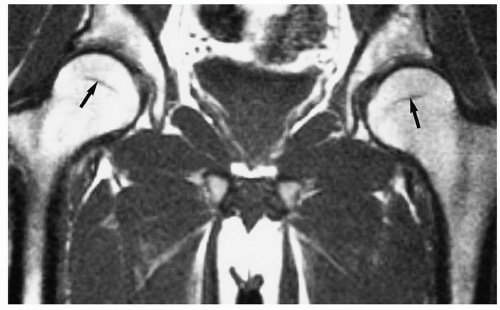 Figure 6.37 Adult hips. T1-weighted image of the pelvis and hips demonstrating predominantly fatty marrow in the femoral heads and necks. The physeal scars (arrows) should not be confused with osteonecrosis. |
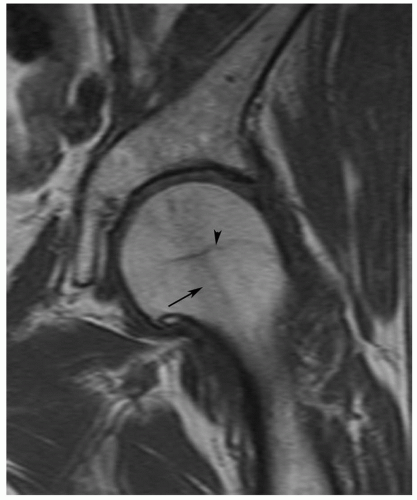 Figure 6.38 Coronal T1-weighted image of the hip demonstrating linear low signal intensity in the femoral neck (arrow) due to the normal trabecular pattern. There is also a physeal scar (arrowhead). |
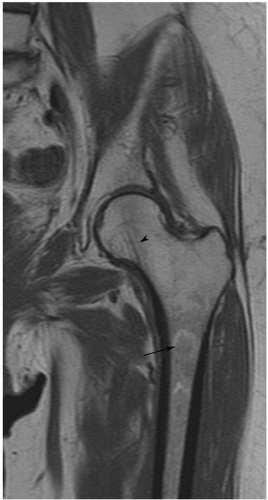 Figure 6.39 Coronal T1-weighted image of the left hip and femur shows a target-like area in the marrow (arrow) of the femur in the subtrochanteric regions. This is a normal area of marrow transition. Note also the trabecular pattern in the femoral neck (arrowhead). |
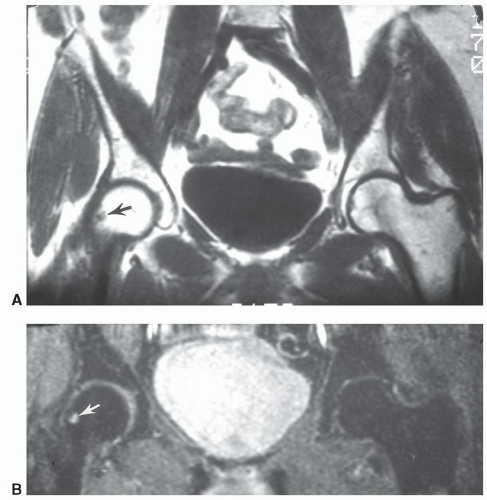 Figure 6.40 Coronal T1- (A) and axial T2-weighted (B) images of the pelvis demonstrating a typical herniation pit (arrow). |
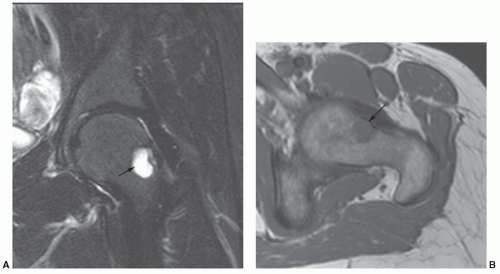 Figure 6.41 Large herniation pit. Coronal T2- (A) and axial T-weighted (B) images demonstrating a large herniation pit (arrow) on the left. |
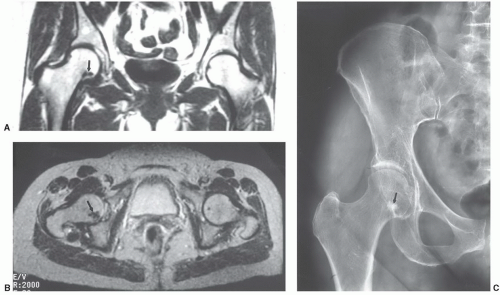 Figure 6.42 Benign bone island. Coronal T1- (A) and axial T2-weighted (B) images demonstrate an area of low signal intensity in the right femoral neck (arrow). Anteroposterior (C) radiograph demonstrates faint chondrocalcinosis, degenerative arthritis, and a sclerotic bone island (arrow), which created the signal abnormality on the MR images. |
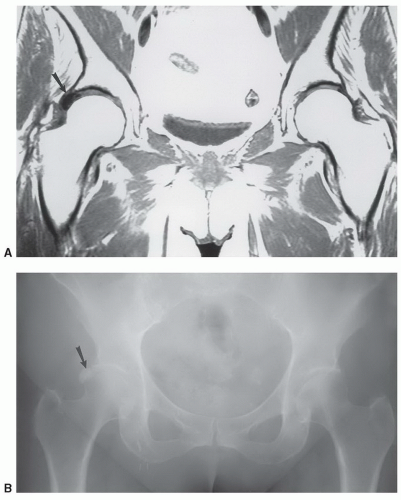 Figure 6.43 Coronal T1-weighted image (A) demonstrates a low signal intensity area in the perilabral region. Anteroposterior radiograph (B) shows obvious dense calcification (arrow) due to hydroxyapatite deposition disease. |
Table 6.3 Etiology of Osteonecrosis | |||||||||||
|---|---|---|---|---|---|---|---|---|---|---|---|
|
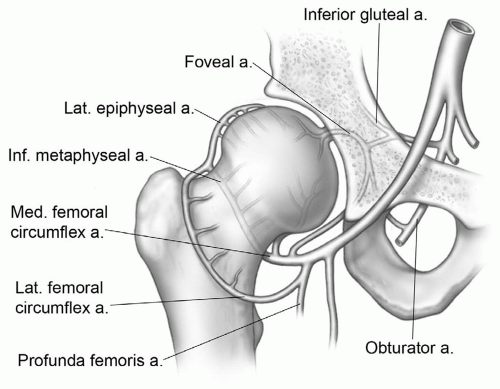 Figure 6.44 Illustration of the vascular anatomy of the hip. |
Table 6.4 Staging of Osteonecrosis of the Femoral Head | |||||||||||||||||||||||||||||||||||
|---|---|---|---|---|---|---|---|---|---|---|---|---|---|---|---|---|---|---|---|---|---|---|---|---|---|---|---|---|---|---|---|---|---|---|---|
| |||||||||||||||||||||||||||||||||||
quickly (2 to 4 minutes) using a 30- to 42-cm FOV, 4-mm-thick sections, 1 NEX, and a 256 × 256 or 192 × 256 matrix. This approach may provide a simple screening technique for high-risk patients.10 Tervonen et al.126 detected occult osteonecrosis in 6% of asymptomatic high-risk patients. More recently, Iida et al.75 demonstrated that 85% of high-risk patients (steroid, transplant, etc.) progressed from marrow edema to advanced osteonecrosis.
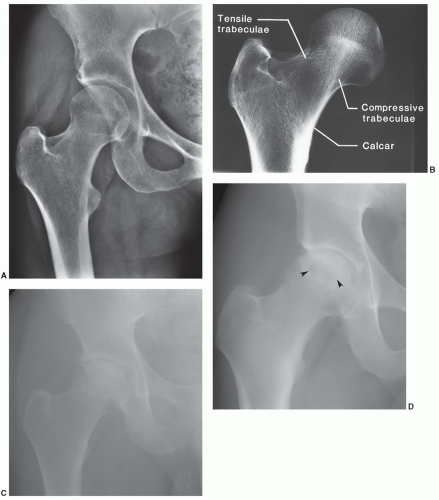 Figure 6.45 Radiographic features of osteonecrosis of the femoral head. A: Normal anteroposterior view of the hip. B: Specimen demonstrating normal femoral head contour and trabecular pattern. C: Stage II osteonecrosis: AP radiograph demonstrating mixed lucent and sclerotic areas (arrows) in the femoral head without articular collapse. Stage III osteonecrosis: Anteroposterior (D) and frogleg oblique (E) radiographs demonstrating lucent area (arrowheads) with articular collapse (arrows). F: Ficat stage IV or modified stage V osteonecrosis: Anteroposterior radiograph of the right hip demonstrating advanced osteonecrosis (arrows) with articular collapse and complete loss of joint space. |
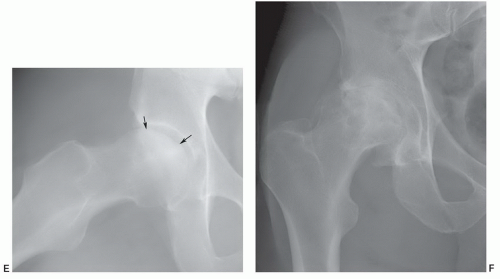 Figure 6.45 (Continued) |
Table 6.5 Classification of Femoral Head Osteonecrosis | ||||||||||||||||||||||||||||||||||||||||||||||||
|---|---|---|---|---|---|---|---|---|---|---|---|---|---|---|---|---|---|---|---|---|---|---|---|---|---|---|---|---|---|---|---|---|---|---|---|---|---|---|---|---|---|---|---|---|---|---|---|---|
| ||||||||||||||||||||||||||||||||||||||||||||||||
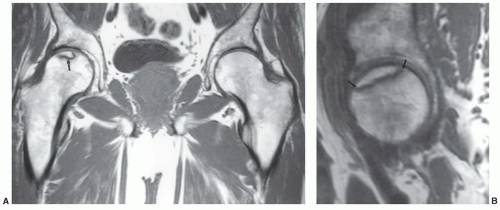 Figure 6.46 T1-weighted images of the hips in a patient with early osteonecrosis of the right femoral head. Radiographs were normal. A: Coronal image demonstrating a small linear subchondral defect (arrow). B: Sagittal image of the right hip more clearly defines the extent of involvement (arrow). |
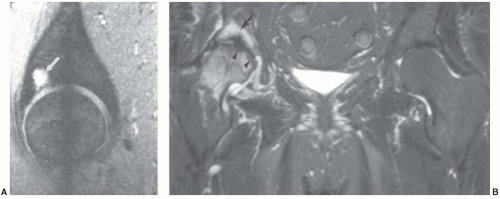 Figure 6.47 A: Sagittal gradient echo T2*-weighted image demonstrating an acetabular geode (arrow). B: Coronal fat suppressed fast spin-echo T2-weighted image demonstrates marrow edema, osteonecrosis (arrowheads) and an acetabular insufficiency fracture (arrow). |
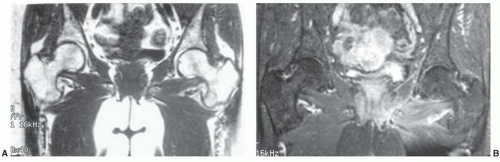 Figure 6.48 Patient with systemic disease on steroids. A: Coronal T1-weighted image is normal. B: Post-gadolinium fat-suppressed T1-weighted image shows no increased signal in the femoral heads bilaterally, suggesting decreased flow. Compare to the signal intensity of the intertrochanteric and acetabular regions. |
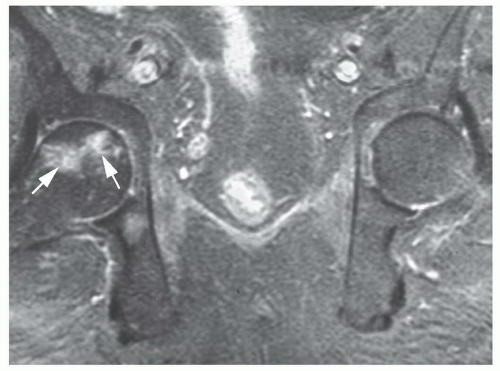 Figure 6.49 Coronal post-contrast fat-suppressed T1-weighted image demonstrates a focal area of necroses in the femoral head with surrounding enhancement or hyperemia (arrows). |
prior to fat cell necrosis.91,92 Osteocytes show necrotic changes shortly after hemopoietic cells.85 It is not unusual to demonstrate mixed necrosis and survival if changes are early. Early animal studies show MR images remain normal until about the seventh day. Beginning on the seventh day, an inhomogeneous loss of signal intensity can be demonstrated onT1-weightedimages. These changes correspondhistologically to lymphocytic infiltration.96,111 This inhomogeneity progresses over the first 16 days until day 20, when a more homogeneous loss of signal intensity in the femoral head becomes evident (Fig. 6.52). This correlates with increased lymphocyte infiltration and early fibrosis. As expected, radiographs remain normal during this time period (Table 6.4).10,114,115 Early uniform loss of signal intensity in the femoral head and neck on T1-weighted images that is similar to transient bone marrow edema has also been reported (Fig. 6.52).10,74,122,124,134,138,139 Conservative management is employed with either condition. However, follow-up studies are important in clarifying which disorder is present and to exclude other inflammatory diseases, specifically infection.74,131,134
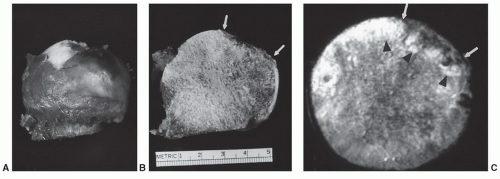 Figure 6.50 Gross (A) and coronal cut section (B) in a patient with osteonecrosis and articular collapse (white arrows). Axial section (C) shows the articular defect (white arrows) with reactive changes (arrowheads) at the necrotic interface and in the adjacent subchondral bone. |
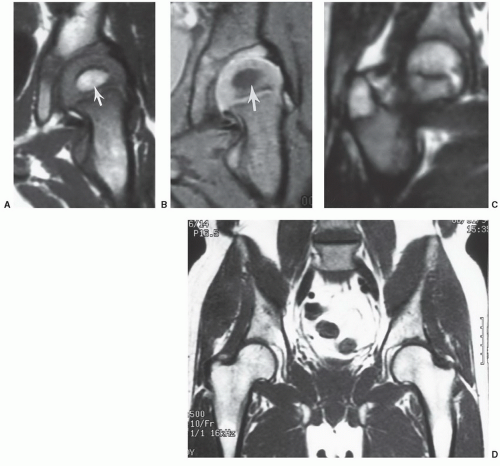 Figure 6.51 Marrow patterns in the hip at different ages: T1- (A) and T2- (B) weighted coronal images of the hip on a young child showing fat signal in the developing epiphysis during ossification (arrow). Coronal T1-weighted image (C) in an adolescent with fatty marrow in the femoral head and greater trochanter. Coronal T1-weighted image (D) of the hips in a 60-year-old with fatty marrow in both upper femurs. |
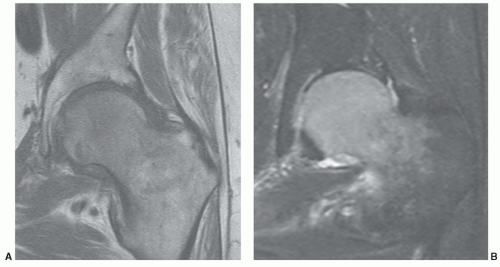 Figure 6.52 Coronal T1- (A) and T2- (B) weighted images demonstrating abnormal signal intensity in the femoral head and upper neck due to marrow edema. |
space changes are definitely more easily assessed with radiographs (Fig. 6.45D-F
Related posts:

Stay updated, free articles. Join our Telegram channel

Full access? Get Clinical Tree


