Imaging Techniques Relative to Rehabilitation
Edgar Colón
Eduardo Labat
Gory Ballester
Jorge Vidal
Angel Gomez
A brief presentation of imaging techniques of interest to the physiatrist must necessarily be selective. Because the diagnosis and initial treatment of fractures are primarily the responsibility of the orthopedic surgeon, with the rehabilitation professional typically involved only later in the course, a full discussion of fractures is not presented in this chapter. Only those fractures that bring patients under the long-term care of the physiatrist are included (e.g., vertebral fractures with the potential to damage the spinal cord). Similarly, tumors and infectious processes are de-emphasized. Rather, emphasis is placed on imaging degenerative musculoskeletal processes, spine and head trauma, stroke, and degenerative central nervous system (CNS) diseases commonly seen by the physiatrist. We will also cover imaging in sport medicine as this is a rapidly changing area in radiology and review the current applications of diagnostic ultrasound in the evaluation of musculoskeletal disorders.
In the past two decades, computed tomography (CT) and magnetic resonance imaging (MRI) have become the most sophisticated imaging modalities for evaluating the musculoskeletal system and the CNS. Therefore, this chapter focuses mainly on the recent applications of CT and MRI in the imaging of musculoskeletal and neural pathology of interest to the physiatrist. In the final section, we will introduce some relatively new imaging technologies of interest to the physiatrist, including advanced MRI methods and ultrasound imaging (USI).
The role of plain film examinations in the assessment of abnormalities of specific joint disorders is well established in the medical literature. A brief review of the most commonly performed radiographic examinations of the extremities will be done when addressing the specific subject.
MUSCULOSKELETAL IMAGING
The advent of the multidetector CT (MDCT) scanner has increased the applicability of this imaging technique for the assessment of the musculoskeletal system. This technology allows for the acquisition of large data set in the axial plane that can be reconstructed in multiple planes of imaging with the use of multiplanar reconstruction (MPR) algorithm. Any anatomical part in the human body can now be scanned in the axial plane and the anatomical information can later be reconstructed in the sagittal, coronal, or any orthogonal plane desired in order to better assess complex anatomical structures such as the joints of the axial skeleton and the spine (1).
CT provides poor contrast resolution to evaluate the musculoskeletal system. Since the relative soft-tissue density of cartilage, tendons, and muscle is similar, we cannot resolve adequate soft-tissue differences between these structures. For example the articular cartilage can only be assessed with CT after a positive contrast is introduced in the joint space such as is the case with CT arthrography. CT however provides a superb spatial resolution that allows for the accurate evaluation of fine soft-tissue and bone trabecular details.
CT images may be displayed with various windows suitable to resolve different structures. Bone window images provide the highest resolution of compact and cancellous bone. Soft-tissue window offers moderate resolution of muscle, tendon, ligament, fat, cartilage, and neural structures.
The good resolution and enhanced contrast of MRI for soft-tissue structures, together with its direct multiplanar imaging capability, make it a superb modality for evaluating all the principal constituents of the musculoskeletal system. Although a technical discussion of the physics of MRI is beyond the scope of this chapter, the physiatrist should know the normal and abnormal MRI appearance of various tissues to be able to look at an MR image with confidence and explain the findings to a patient. The MRI signal intensity of any tissue primarily reflects its proton density, its T1 relaxation time, and its T2 relaxation time. Various techniques, including manipulating the repetition time (TR) between the application of radiofrequency pulses or the echo time (TE) between the radiofrequency pulse and the recording of a signal (i.e., echo) produced by the tissue, can emphasize the proton density, T1 relaxation time, or T2 relaxation time features of any tissue (2). The TR and TE are expressed in milliseconds. The most commonly used technique is spin echo, in which short TR and TE will emphasize the T1 relaxation time of a tissue, the so-called T1-weighted image. In general, an image is said to be T1 weighted if TR is less than 1,000 ms and TE is less than 30 ms (e.g., TR = 500 ms, TE = 20 ms). A T2-weighted image
generally is accomplished with a TR longer than 1,500 ms and a TE greater than 60 ms (e.g., TR = 2,000 ms, TE = 85 ms). Proton density images are obtained with a long TR and a short TE (e.g., TR = 2,000 ms, TE = 20 ms).
generally is accomplished with a TR longer than 1,500 ms and a TE greater than 60 ms (e.g., TR = 2,000 ms, TE = 85 ms). Proton density images are obtained with a long TR and a short TE (e.g., TR = 2,000 ms, TE = 20 ms).
Most normal tissues demonstrate similar signal intensities on both T1- and T2-weighted images. Compact bone, fibrocartilage, ligament, tendon, and the rapidly flowing blood within the blood vessel typically produce very low signal intensity, referred to as a signal void, and appear black both on T1 and T2 (Fig. 6-1). Muscle demonstrates moderately low signal intensity and appears dark gray. Peripheral nerves demonstrate slightly higher signal intensity than muscle because of the fat content of their myelinated fibers. Hyaline cartilage produces moderate signal intensity and appears light gray. Fat produces very high signal intensity and appears bright on T1 and T2. Because fat is frequently situated adjacent to ligaments and tendons, it can provide a high-contrast interface for evaluating the integrity of these structures. Adult bone marrow also shows high signal intensity because of its high fat content. Most normal body fluids that are not flowing show low signal intensity on T1-weighted images and high signal intensity on T2-weighted images.
Pathologic processes such as tumor, infection, and abnormal fluids (e.g., edema, joint effusion) show intermediate signal intensity on T1-weighted images and become very hyperintense on T2-weighted images. Pathologic calcifications
demonstrate very low signal intensity on both T1- and T2-weighted images.
demonstrate very low signal intensity on both T1- and T2-weighted images.
The direct multiplanar imaging capability of MRI is particularly useful in evaluating obliquely oriented musculoskeletal structures such as the supraspinatus tendon, the cruciate ligaments, and the lateral collateral ligaments of the ankle.
MRI has proved useful in evaluating traumatic, degenerative, inflammatory, and neoplastic pathology of the limbs and spine. It is useful in detecting acute or chronic traumatic injuries and degenerative conditions involving bones, muscles, tendons, ligaments, fibrocartilage, and nerves. Bone pathology, particularly well detected by MRI, includes contusions, osteochondral injuries, stress fractures, marrow replacement by neoplastic cells, and ischemic necrosis. Muscle lesions that MRI is especially sensitive at identifying include strain or contusion, complete rupture, compartment syndrome, myopathies, and atrophy (3). Tendon conditions well depicted by MRI include partial and complete tear, tendinitis, and tenosynovitis. MRI is also very sensitive for detecting partial or complete ligament tears. Fibrocartilaginous injuries or diseases well delineated by MRI include pathology of the menisci, the glenoid labrum, the triangular fibrocartilage of the wrist, and the intervertebral disc. Nerve entrapments well visualized by MRI include spinal nerve encroachment by disc disease or spinal stenosis and carpal tunnel syndrome (CTS) or other entrapment syndromes. Enhanced imaging of normal and injured peripheral nerves can be obtained using a short-tau inversion recovery (STIR) excitation-emission sequence due to the increased sensitivity to free water content associated with tissue edema using this MR recording protocol. The increased signal generated by injured nerves using STIR pulse sequences probably reflects an increase in free water content of the nerve due to altered axoplasmic flow, axonal and/or myelin degeneration, and endoneurial or perineurial edema due to a breakdown in the blood-nerve barrier (4). MRI imaging of denervated skeletal muscle shows increased MR signal using the STIR protocol when there is significant muscular weakness and well-defined changes indicating muscle denervation on needle electromyography (5).
Osteomyelitis causes a reduction in bone marrow signal intensity on T1-weighted images because of the replacement of normal fatty marrow by inflammatory exudate. In T2-weighted images, these areas of active infection become hyperintense.
MRI has particular value in evaluating both bone and soft-tissue neoplasms. Most of them demonstrate moderately low signal intensity on T1-weighted images and very high signal intensity on T2-weighted images.
Emphasis will now be directed to the application of imaging modalities to common regional pathologic conditions of the musculoskeletal system. Particular focus will be given to MRI because of its superb soft-tissue imaging capabilities and its rapidly expanding diagnostic applications.
The important role played by radiology in the diagnosis of diseases has come at the expense of increased radiation exposure to the general population. With the advent of new technology, such as Positron Emission Tomography (PET) studies and MDCT technology, there has been a sharp increase in the number of radiographic examinations performed to the general population and as a consequence an increase in the cumulative radiation dose to the individual patient and the general population. It is an expected outcome for increase in radiation exposure to lead to an increased rate of malignancy. Therefore, increased awareness is needed in issues concerning radiation safety.
Ionizing radiation, especially at high doses, is known to increase the risk of developing cancer. It is estimated that medical exposure might be responsible for 1% of cancer diagnosis in the United States. This rate is expected to increase in the coming years due to the increased number of examinations performed today.
The scientific measurement for the effective dose of radiation is the millisievert (mSv). The background radiation dose for the average person in the United States is about 3 mSv. This is secondary to cosmic radiation and naturally occurring radioactive materials. By comparison, the effective radiation dose for a spinal CT is equivalent to 6 mSv or 2 years of natural background radiation. Radiation exposure is particularly important in pregnant women and pediatric patients due to the cumulative life effect of radiation exposure at a younger age. In nuclear medicine examinations, special precautions are needed. Some of the radiopharmaceuticals used in nuclear medicine can pass into the milk of lactating women (6).
The relative radiation level (RRL) is a radiation measurements used to calculate effective dose. This is the dose used to estimate population total radiation risk associated to an imaging procedure. This takes into account the sensitivity of different body organs and tissues. This estimate cannot assess the specific risk of an individual patient.
Every effort should be made to order examination, which is best indicated to address the clinical concern of the patient. To aid in this regard, the American College of Radiology (acr. org) has established guidelines for the appropriate use of imaging to answer specific clinical questions. The appropriateness criteria can be of help when deciding which imaging study to order to answer a clinical question.
Shoulder
Plain film radiographic evaluation of the shoulder should include frontal examinations with internal and external humeral rotation. If there is a question of instability or dislocation, an axillary view, a scapular Y view, or both should be obtained. There have been several reports that recommend the use of a 30-degree caudad-angled radiograph or a suprascapular outlet view for the assessment of the anterior acromion in cases of suspected shoulder impingement. Since these are special views, they must be ordered as routine shoulder radiographs do not include axillary or suprascapular outlet views. The RRL for plain film radiographic examinations of the shoulder is less than 0.1 mSv, which is considered minimal.
MRI has become valuable in evaluating a host of shoulder abnormalities very familiar to the physiatrist. These include impingement syndrome, other rotator cuff abnormalities, instability syndrome, and bicipital tendon abnormalities. It is
also useful in demonstrating arthritic changes, occult fractures, ischemic necrosis, and intra-articular bodies. MRI with intraarticular contrast is now considered the modality of choice for the evaluation of labral and capsular pathology. The use of MRI for shoulder evaluation avoids radiation exposure to the nearby thyroid gland, which can occur with CT examinations. The excellent visualization of marrow by MRI permits early diagnosis of ischemic necrosis, infection, and primary or metastatic tumors.
also useful in demonstrating arthritic changes, occult fractures, ischemic necrosis, and intra-articular bodies. MRI with intraarticular contrast is now considered the modality of choice for the evaluation of labral and capsular pathology. The use of MRI for shoulder evaluation avoids radiation exposure to the nearby thyroid gland, which can occur with CT examinations. The excellent visualization of marrow by MRI permits early diagnosis of ischemic necrosis, infection, and primary or metastatic tumors.
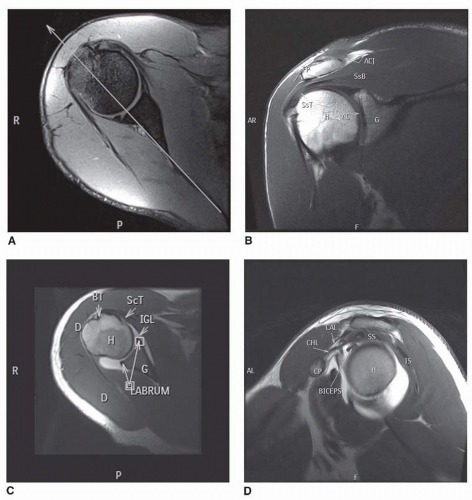
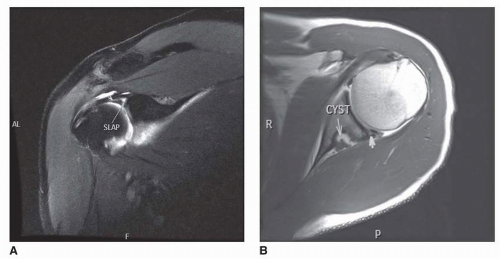
Because of the oblique orientation of the scapula on the chest wall and the consequent anterolateral facing direction of the glenoid, the direct multiplanar imaging capability of MRI provides optimal visualization of all the important shoulder structures. An oblique coronal image parallel to the plane of the scapula provide full-length views of the rotator cuff musculature, especially the supraspinatus and is the best plane for the evaluation of injuries to the biceps-labral complex (BLC) (Fig. 6-1A and B). Coronal oblique images can also provide information about the presence of impingement upon the supraspinatus by the acromion and osteophytes in the presence of acromioclavicular joint osteoarthritis. Oblique sagittal imaging planes parallel to the glenoid provide cross-sectional views of the rotator cuff apparatus and evaluates the anatomical configuration of the coracoacromial arch and the presence of impingement (Fig. 6-1D). Axial imaging planes provide good visualization of the anterior and posterior capsular apparatus, glenoid labrum, bony glenoid rim, and humeral head (Fig. 6-1C).
SHOULDER IMPINGEMENT SYNDROME AND SUPRASPINATUS INJURY
The MRI findings of shoulder impingement syndrome and its associated supraspinatus injury are best seen on oblique coronal MR images that visualize the full length of the supraspinatus muscle belly and tendon (Fig. 6-1B). The normal muscle belly displays moderately low signal intensity. The tendon is visualized as an intermediate-signalintensity structure that blends with the low signal intensity of the superior capsule as it courses to its insertion on the greater tubercle of the humerus. The tendon demonstrates smooth tapering from medial to lateral into its insertion in the greater tuberosity. The inferior aspect of the tendon is delimited below by the moderate signal intensity of the hyaline cartilage on the superior aspect of the humeral head. The superior aspects of both the muscle belly and tendon are delimited by a high-signal-intensity subacromial and subdeltoid fat plane. The normal subacromial-subdeltoid bursa is not specifically visualized because its walls are separated only by monomolecular layers of a synovial-type fluid, but it is situated between the supraspinatus tendon and the fat plane. Above the fat plane, the clavicle, acromioclavicular joint, acromion, and deltoid muscle are demonstrated on different oblique coronal sections.
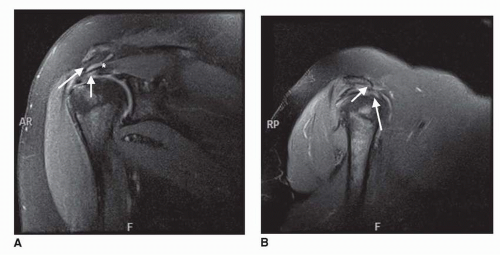
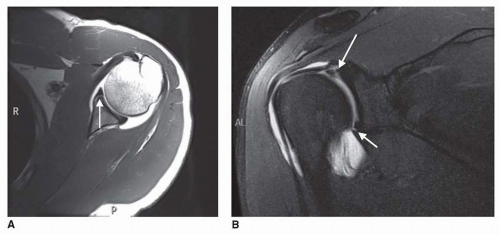
Although rotator cuff impingement is a clinical diagnosis, MRI can provide direct visualization of the constituents to the coracoacromial arch and their relationship to the supraspinatus (Fig. 6-2A and B). Downward slanting of the acromion in the coronal or the sagittal plane, a thickened coracoacromial ligament or inferior osteophytosis within the acromioclavicular joint can exert mass effect upon the supraspinatus. This has been implied as being in part responsible for chronic tears of the supraspinatus.
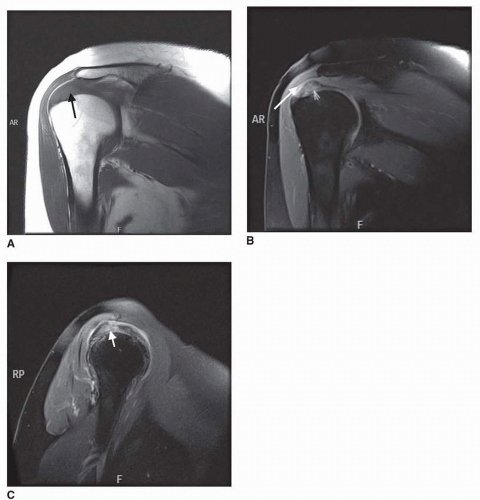
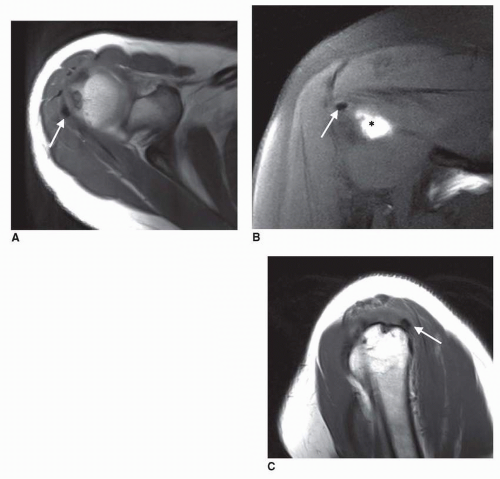
Neer stated that 95% of rotator cuff tears are associated with chronic impingement syndrome (7) and described three stages in the progression of rotator cuff injury. These can be visualized by MRI (6, 7, 8, 9, 10). Stage 1 is characterized by edema and hemorrhage within the supraspinatus tendon characteristic of an early tendinitis. On MRI, there is focal tendon
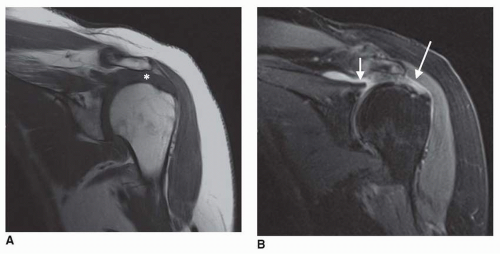
thickening and diffuse moderate increase in signal intensity within the tendon (Fig. 6-3A-C). In stage 2, Neer described both inflammation and fibrosis within the tendon. MRI shows this as thinning and irregularity of the tendon. Stage 3 is a frank tear of the supraspinatus tendon. On MRI, complete tears are noted by a discontinuity of the tendon with a well-defined focus of high signal intensity on T2-weighted images (Fig. 6-4). The most susceptible area is the critical zone of hypovascularity, located about 1 cm from the insertion (11). With small or partial tears, there is no retraction of the muscle-tendon junction, the subacromial-subdeltoid fat plane is commonly obliterated, and fluid may accumulate in the subacromial-subdeltoid bursa, which becomes hyperintense on T2-weighted images. There also may be effusion of the shoulder joint, which may extend inferiorly along the tendon sheath about the long head of the biceps. With a complete supraspinatus tendon tear, the muscle belly may retract medially, and atrophy may occur as the tear becomes chronic (Fig. 6-5A,B). Muscle atrophy appears as areas of high signal
intensity because of fatty replacement within the muscle belly and decreased muscle mass. Finally, the acromiohumeral interval narrows as the humeral head migrates superiorly, because of the loss of supraspinatus restraint to the deltoid’s tendency to sublux the humerus superiorly during abduction.
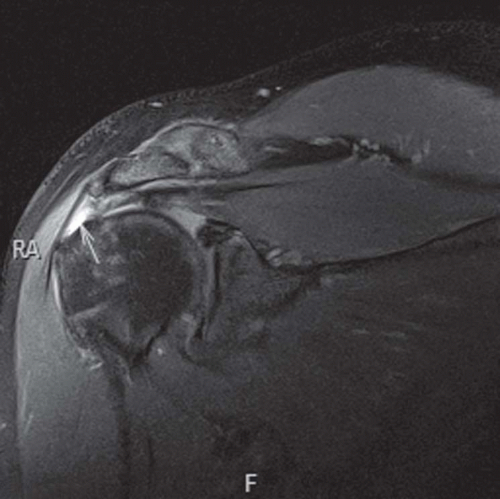 FIGURE 6-4. Complete rupture of the supraspinatus tendon is seen in a T2-weighted MRI. There is fluid filling the gap (arrow) and there is retraction to the tendon fibers underneath the acromion. |
SHOULDER INSTABILITY AND DISRUPTION OF THE ANTERIOR CAPSULAR MECHANISM
For the assessment of shoulder instability and labral tears, it is imperative that intra-articular contrast medium be injected in order to be able to evaluate the entire articular labrum, glenoid fossa, and capsular mechanism (12). Axial MR images provide the best visualization of the anterior and posterior glenoid labra, capsule, and lower rotator cuff muscles (Fig. 6-1). Anteriorly, the moderate-signal-intensity subscapularis muscle belly and its low-signal-intensity tendon are visualized. The tendon fuses with the low-signal-intensity anterior capsule as it courses to its insertion on the lesser tubercle. The fibrocartilaginous anterior and posterior labra appear as low-signal-intensity triangular or rounded areas attached to the glenoid rim. The higher-signalintensity intra-articular contrast opposed the hyaline cartilage surfaces of the glenoid and humeral head. The posterior capsule is visualized as a low-intensity area blending with the deep surface of infraspinatus and teres minor muscles as they extend to their insertions on the greater tubercle of the humerus. The long tendon of the biceps is demonstrated as a round, low-signal-intensity area within the bicipital groove.
Shoulder instability and the associated disruption of the anterior capsular mechanism can cause chronic shoulder pain and disability. The instability may be caused by an acute traumatic episode or can occur with no history of a traumatic event. Both recurrent traumatic subluxation and nontraumatic instability are typically associated with disruption of the anterior capsular mechanism. Anteriorly, where most instability occurs, this mechanism includes the subscapularis muscle and tendon, the anterior joint capsule, three underlying glenohumeral ligaments, the synovial lining, and the anterior labrum. With instability, the labrum shows tears, separation from the glenoid rim, or degeneration (13). Also frequently present are medial stripping of the capsule from its normal attachment to the labrum and glenoid rim, an enlarged fluid-filled subscapular bursa secondary to joint effusion, attenuation of the glenohumeral ligaments, and injury or laxity of the subscapularis muscle or tendon.
By MRI, labral tears may be visualized as discrete linear areas of increased signal intensity within the normal signal void of the labrum (Figs. 6-6 and 6-7). These areas show moderate intensity on T1-weighted images and high intensity on T2-weighted images. With recurrent dislocation or subluxation, the labrum can become fragmented or attenuated.
Capsular detachment from the scapula (i.e., stripping) is visualized by T2-weighted MRI as an area of high-signal-intensity fluid dissecting medially from the glenoid rim. With trauma to the subscapularis tendon, there can be medial retraction of the muscle-tendon junction when the tendon is completely ruptured. Chronic atrophy of the subscapularis muscle belly is identified by high-signal-intensity fatty replacement. The glenoid marrow underlying a labral detachment may show pathologically decreased signal intensity even before the plain film radiograph shows an osseous Bankart lesion. MRI and CT can be used to visualize Bankart fractures of the anterior glenoid and the Hill-Sachs compression deformity of the posterolateral humeral head (14, 15) and are both useful in the assessment
of the extent of a Hill-Sachs defect in patients with engaging lesions. Patients with the rarer posterior instability show similar posterior labral, capsular, and muscular defects.
of the extent of a Hill-Sachs defect in patients with engaging lesions. Patients with the rarer posterior instability show similar posterior labral, capsular, and muscular defects.
TENDINITIS OR RUPTURE OF OTHER SHOULDER MUSCLES
Tendinitis and rupture also can involve the subscapularis, infraspinatus, and teres minor, or biceps tendons, although far less commonly than the supraspinatus. Early tendinitis involves an increased signal intensity area within the tendon. This can progress to frank rupture of the tendon with a high-signal-intensity area at the site of the tear on T2-weighted images and may be associated with joint effusion. A complete tear will eventually cause muscle retraction and later atrophy.
Calcific tendinosis (Fig. 6-8) of the supraspinatus is a common clinical entity most commonly affecting middle age persons. It is slightly more common in females and can affect multiple tendons in the body. It is however far more frequently in the supraspinatus. Although the exact etiology is unknown, it is felt to be secondary to chronic ischemia of the tendon fibers.
Increased high-intensity fluid about the biceps tendon on T2-weighted MR images can be produced by either a biceps tenosynovitis or a shoulder joint effusion because the tendon sheath normally communicates with the shoulder. Rupture of the biceps tendon is demonstrated by absence of the biceps tendon within the intertubercular sulcus and by distal retraction of the muscle, which is seen on imaging the arm (16). Dislocation of the biceps tendon is identified by medial displacement of the biceps tendon out of the intertubercular sulcus.
ISCHEMIC NECROSIS OF THE HUMERAL HEAD
As in other joints, ischemic necrosis of the humeral head is depicted as an area of decreased signal intensity within the subarticular bone marrow in T1-weighted images. On T2-weighted images, curvilinear bright bands surrounding areas of decreased signal intensity, the so-called tram track sign, represent reactive marrow surrounding the core of dead bone. Ischemic necrosis is more fully described with the hip, where its incidence is higher.
ELBOW
Plain film radiographic examination of the elbows should be the initial evaluation for patients with chronic elbow pain. Radiographs can be useful for the assessment of calcium within the joint compartment or periarticular soft tissues. Standard frontal and lateral radiographs are used for the routine evaluation of the elbow joint. Radiographic examination of the elbow has a minimal RRL.
MRI has not been applied to the evaluation of elbow pathology as extensively as it has been to other large joints (17). However, improving imaging techniques and the use of surface coils permit superb visualization of the bony, ligamentous, muscular and neurovascular structures around the elbow. Common elbow injuries evaluated with MRI are usually related to sports (weightlifting, throwing, and racquet sports) or compartmental nerve entrapment.
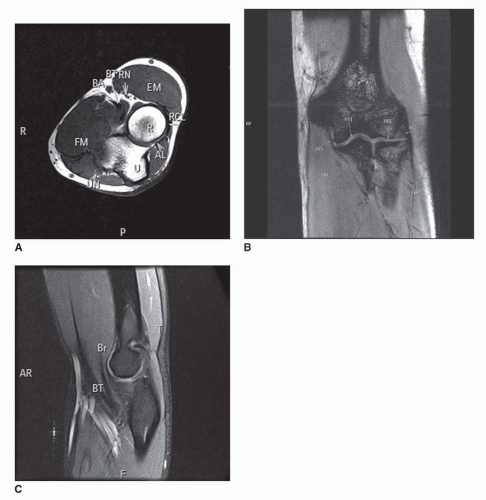
Axial MRI views of the elbow region permit good visualization of the biceps, brachialis, triceps, and all the extensor and flexor muscles of the forearm (Fig. 6-9A). High-signal-intensity fat planes and low-signal-intensity intermuscular septa permit clear delineation of each muscle and their tendons of insertion or origin. Axial images clearly depict brachial, ulnar, and radial arteries and all the subcutaneous and deep veins. They also allow identification of the ulnar nerve within the cubital tunnel and the radial nerve in the brachioradialisbrachialis interval and under the supinator muscle’s arcade of Frohse, where it is commonly entrapped. The median nerve is visualized at all its common elbow entrapment sites, including under the bicipital aponeurosis, between the heads of the pronator teres, and under the fibrous arch of the flexor digitorum superficialis.
The humeroulnar, humeroradial, and proximal radioulnar joint spaces and articular cartilages are well visualized on both coronal and sagittal MR images (Fig. 6-9B and C). The low-signal-intensity ulnar collateral, radial collateral, and annular ligaments are depicted on both axial and coronal MR images. Sagittal images delineate the anterior and posterior subsynovial fat pads.
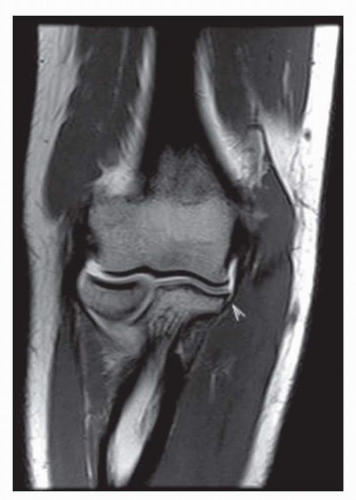
MRI has the capability of directly visualizing degenerative or traumatic abnormalities of the annular and the radial and ulnar collateral ligamentous complexes. A sprain appears in MRI as thickened or thinned ligament with surrounding highT2 signal intensity. The collateral ligaments may show degeneration in association with adjacent epiocondylosis. The affected ligament commonly shows thickening and intermediate signal intensity. Full thickness of avulsion ligamentous tears appears as discontinuities of the low-signal-intensity ligament. The T2-weighted images disclose hyperintense edema and hemorrhage between the torn ends of the ligament extending into the joint interval and adjacent soft tissues. A partial thickness tear appears as high T2 fluid signal intensity within an uninterrupted ligament (Fig. 6-10).
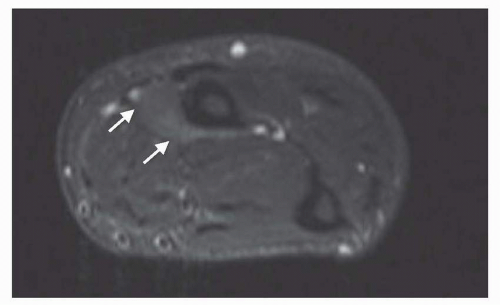
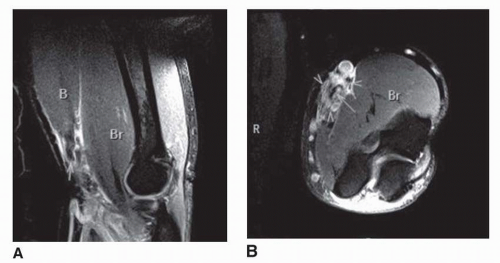
MRI also provides good visualization of the sites of muscle injury and denervation about the elbow (18) (Fig. 6-11A,B). Acute muscle denervation is demonstrated by increased T2-weighted signal intensity within the specific muscle
group supplied by the injured or the affected nerve. Increased intramuscular T2-weighted signal intensity is due to muscle edema. Chronic muscle denervation is demonstrated by increased intramuscular T1-weighted signal intensity, related to muscle atrophy and fatty infiltration. Acute muscle injuries presents with intramuscular edema and hemorrhage. Increased thickening, increased signal intensity, and discontinuity of tendon fibers are the findings commonly observed in tendon tears (Fig. 6-12A,B).
group supplied by the injured or the affected nerve. Increased intramuscular T2-weighted signal intensity is due to muscle edema. Chronic muscle denervation is demonstrated by increased intramuscular T1-weighted signal intensity, related to muscle atrophy and fatty infiltration. Acute muscle injuries presents with intramuscular edema and hemorrhage. Increased thickening, increased signal intensity, and discontinuity of tendon fibers are the findings commonly observed in tendon tears (Fig. 6-12A,B).
MRI has the ability to demonstrate tendinosis involving the common extensor and flexor tendon origins from the lateral and medial aspects of the humerus with findings similar to those described in tendinosis about the shoulder. It also can display abnormalities of the radial and ulnar collateral ligament complexes.
Wrist
Plain film radiography and CT provide good visualization of the osseous structures of the wrist. Most physicians agree that the imaging evaluation of a painful hand and wrist should begin with radiographs. This inexpensive study may establish a specific diagnosis in arthritis, injury, infection, and wrist instability. Standard anteroposterior (AP) and lateral radiographs of the wrist are enough for most clinical presentations (19). Additional views can be ordered to assess specific clinical problems, such as scaphoid views in patients with trauma and pain in the snuffbox. In the specific setting of wrist trauma, further imaging studies should be considered in the presence of negative radiographic examinations due to the high incidence of missed occult fractures. The relative radiation dose for radiographic examinations of the wrist is low. The ability of MRI to visualize soft-tissue pathology already has been shown to be of great value in assessing CTS and may prove useful in imaging cases of unexplained wrist pain (20, 21, 22). MR arthrography provides detailed information about ligamentous disorders in and about the wrist.
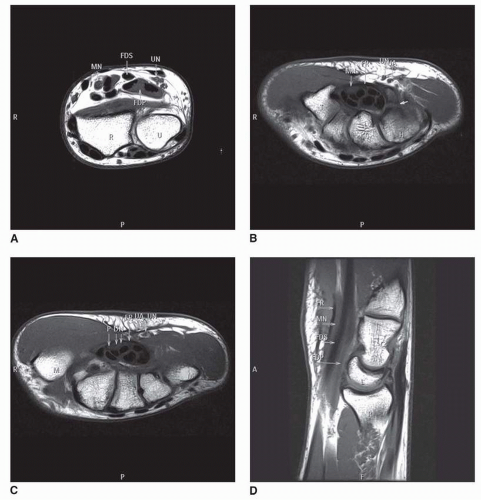
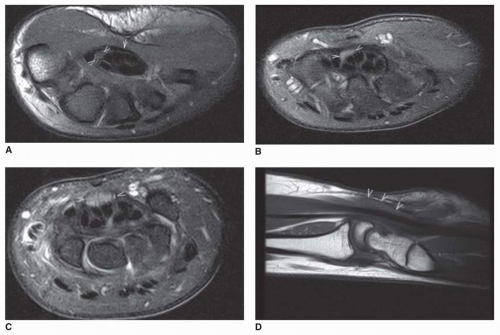
Axial MR images through the wrist from the distal radioulnar joint to the metacarpals provide excellent visualization of all the bones, joints, ligaments, muscles, tendons, nerves, and vessels in the wrist area (Fig. 6-13A-D). They also clearly display all the boundaries and contents of the carpal tunnel and Guyon’s canal.
CARPAL TUNNEL SYNDROME
MRI can serve as an adjunct diagnostic tool for CTS when the clinical or neurophysiologic findings are equivocal. The carpal tunnel is a fibro-osseous space with little fat that contains the flexor tendons and the median nerve. The flexor retinaculum composes the volar aspect of the tunnel and normally shows slight palmar bowing. The median nerve courses through the tunnel within its volar and radial aspect, and it can be differentiated from the adjacent tendons because it shows relative higher signal intensity. The carpal tunnel and its contents are best evaluated in the axial plane and should be scrutinized at three standard locations.
Distal radioulnar joint before the median nerves enter the tunnel.
Proximal tunnel, at the level of the pisiform.
Distal tunnel, at the level of the hook of the hamate.
There are four universal findings of CTS visible by MRI regardless of etiology (21):
Swelling of the median nerve (i.e., pseudoganglion) in the proximal part of the carpal tunnel at the level of the pisiform. Best evaluated by comparing the size of the median nerve at the level of the distal radioulnar joint with its size at the proximal tunnel.
Increased signal intensity of the edematous median nerve on T2-weighted images.
Palmar bowing of the flexor retinaculum, determined by a bowing ratio of more than 15%. The bowing ratio is calculated by drawing a line from the trapezium to the hook of the hamate on the axial plane. The distance from this line to the flexor retinaculum is divided by the previously calculated length.
Flattening of the median nerve in the distal carpal tunnel at the level of the hamate (Fig. 6-14A-D).
MRI also has the potential to establish the cause of CTS. Some of the etiologies visualized by MRI include traumatic tenosynovitis, rheumatoid tenosynovitis, a ganglion cyst of a carpal joint, excessive fat within the carpal tunnel, a hypertrophied adductor pollicis muscle in the floor of the carpal tunnel, and a persistent median artery (23).
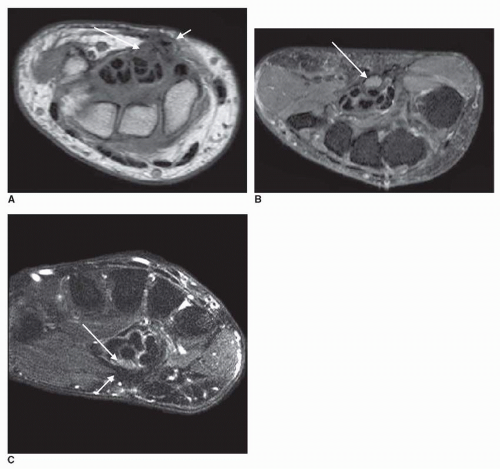
MRI also provides a means of postoperative evaluation of those patients in whom the symptoms persist, to ensure that the flexor retinaculum has been completely incised and that there are no other complicating postoperative factors producing continuing discomfort. When the flexor retinaculum has been completely incised, the incision site is well documented by MRI and the contents of the carpal tunnel are typically displaced forward (Fig. 6-15A). If the distal part of the flexor retinaculum has been incompletely incised, this can be demonstrated by MRI, and the preoperative MRI findings of CTS will persist (Fig. 6-15B and C).
OTHER WRIST ABNORMALITIES
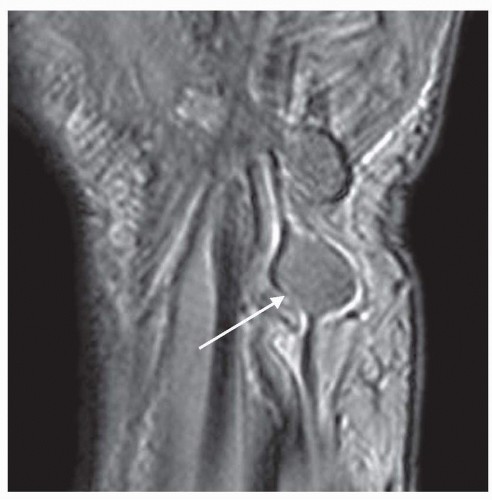
MRI can visualize postincisional neuromas as lobulated masses in the typical location of the palmar cutaneous branches of the median nerve. Other peripheral nerve tumors such as schwanomas (Fig. 6-16) and neurofibromas can be well recognized as well. It can also demonstrate tenosynovitis involving any of the tendons crossing the wrist. MRI also displays marrow abnormalities such as ischemic necrosis of the proximal fragment of a scaphoid fracture and avascular necrosis of the lunate, where the marrow shows reduced signal intensity (24). MRI has the ability to evaluate the integrity of the intrinsic/extrinsic ligaments of the wrist and the triangular fibrocartilage complex (TFCC) (25). The TFCC, scapholunate, and lunotriquetral ligaments are best evaluated with MR arthrography (Fig. 6-17).
Hip
Similar to the remaining joints in the body, plain film radiographic examinations should be the first diagnostic test in patients with chronic hip pain. Frontal and frog leg views
are the standard radiographs performed for the assessment of hip joint abnormalities (26). The presence of osteoarthritis, bone tumors, and soft-tissue calcifications can be assessed with plain films. Special radiographic views are useful in the assessment of particular clinical problems. Patients suspected of femoroacetabular impingement can benefit from cross table lateral radiographs of the hip joint.
are the standard radiographs performed for the assessment of hip joint abnormalities (26). The presence of osteoarthritis, bone tumors, and soft-tissue calcifications can be assessed with plain films. Special radiographic views are useful in the assessment of particular clinical problems. Patients suspected of femoroacetabular impingement can benefit from cross table lateral radiographs of the hip joint.
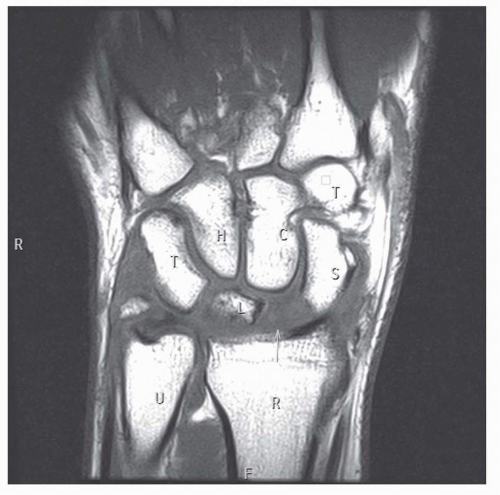 FIGURE 6-17. A coronal T1-weighted image of the wrist shows intermediate signal intensity and increased distance to the scapholunate interval (arrow), representing a scapholunate ligament tear. |
MRI of the hip is usually performed in standard axial, coronal, and sagittal planes; although oblique axial images are commonly used in routine protocols. The normal marrow of the femoral head epiphysis and the greater trochanter displays very high signal intensity and is surrounded by a thin layer of compact bone that appears as a signal void. However, in children and young adults, the marrow of the femoral neck and shaft normally shows lower signal intensity, because it contains some residual hematopoietic marrow. The acetabulum has imaging characteristics similar to those of the femoral neck. The periphery of the hip joint interval displays the moderate signal intensity of the apposed hyaline cartilage surfaces of the femoral head and acetabulum, whereas the centrally situated acetabular notch contains high-signal-intensity fat. The thick, very-low-signal-intensity hip joint capsule blends with the acetabular labrum proximally and the cortex of the femoral neck distally. All the muscles, nerves, and blood vessels crossing the hip are well visualized.
ISCHEMIC NECROSIS
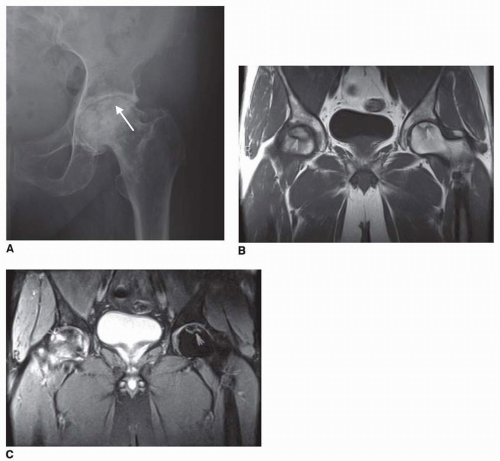
One of the common indications for MRI of the hip is to determine the presence of ischemic necrosis. This is bone death produced by a compromised blood supply. It also has been called avascular necrosis, osteonecrosis, or aseptic necrosis. Predisposing factors that should raise the physician’s index of suspicion include corticosteroid therapy, alcoholism, known hip trauma, chronic pancreatitis, Gaucher’s disease, sickle cell disease, exposure to hypobaric conditions, subcapital fractures, childhood septic arthritis or osteomyelitis of the hip, and congenital hip dislocation (27). If undetected early, the disease can progress and finally undergo irreversible collapse of the femoral head. MRI has been demonstrated to be even more sensitive and specific than bone scintigraphy for the early diagnosis of ischemic necrosis of the femoral head (28, 29, 30, 31).
On T1-weighted MRI, the foci of ischemic necrosis of the femoral head appear as homogeneous or heterogeneous well-delimited or diffuse areas of decreased signal intensity in the shape of rings, bands, wedges, or crescents, or in an irregular configuration (Fig. 6-18A-C) (32, 33). The low signal intensity is caused by death of marrow fat and replacement of the marrow by a fibrous connective tissue. Some cases show a lower signal band surrounding the lesion, and this has been attributed to healing sclerotic bone at the interface between normal and necrotic bone. On T2-weighted images, many cases show a double-line sign with a high-signal-intensity zone just inside of a low-signal-intensity margin. This is thought to be produced by granulation tissue surrounded by sclerotic bone (31, 32, 33).
FEMOROACETABULAR IMPINGEMENT
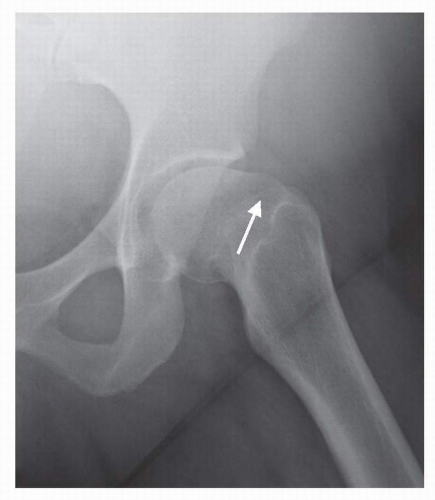
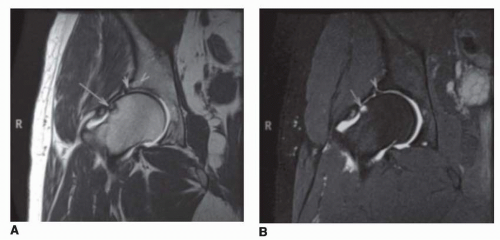
Femoroacetabular impingement is another cause of hip pain that may initially have a non-specific clinical presentation; however, a thorough physical evaluation should be able to identify this condition. Pain can be elicited on physical exam by passive movement of the thigh into full flexion, adduction, and internal rotation (34). Radiographs often help to identify anatomical variations such as dysplasia of the femoral neck (Fig. 6-19) or acetabular overcoverage. MR arthrography (Fig. 6-20) can be a helpful imaging study for evaluating the consequences of femoroacetabular impingement as well as thoroughly evaluating the abnormal anatomy. Intra-articular contrast helps to better delineate hyaline cartilage defects as well as labral tears. These findings, along with the clinical evaluation, help guide the appropriate treatment plan.
OTHER HIP ABNORMALITIES
Transient regional osteoporosis presents with a low-signal-intensity lesion on T1-weighted images that is similar to ischemic necrosis, but it typically involves both femoral head and
neck and becomes hyperintense on T2-weighted images, suggesting the presence of edema. MRI demonstrates osteoarthritic subchondral sclerosis as low-signal-intensity zones in the subchondral marrow of both the femoral head and acetabulum. MRI also has been found to be very useful for identifying stress or occult fractures. These appear as low-signal-intensity areas containing an oblique or wavy line of still lower signal intensity, representing the actual fracture site. On T2-weighted images, these areas become hyperintense, suggesting that they are edema. MRI also can identify many types of soft-tissue abnormalities about the hip, including synovial cysts, periarticular bursitis, soft tissue masses and articular abnormalities such as synovial chondromatosis.
neck and becomes hyperintense on T2-weighted images, suggesting the presence of edema. MRI demonstrates osteoarthritic subchondral sclerosis as low-signal-intensity zones in the subchondral marrow of both the femoral head and acetabulum. MRI also has been found to be very useful for identifying stress or occult fractures. These appear as low-signal-intensity areas containing an oblique or wavy line of still lower signal intensity, representing the actual fracture site. On T2-weighted images, these areas become hyperintense, suggesting that they are edema. MRI also can identify many types of soft-tissue abnormalities about the hip, including synovial cysts, periarticular bursitis, soft tissue masses and articular abnormalities such as synovial chondromatosis.
Another hip region imaging application of potential interest to physiatrists involves the use of technetium bone scanning to evaluate recently described “thigh splints” caused by exaggerated stride length by short female basic trainees in the unisex-oriented military (34). Seven cases of thigh pain in female recruits at one military base were imaged after administration of technetium-99, with the expectation of finding stress fractures. Instead, the scans showed longitudinal linear accentuation sites in the upper or middle femur that were consistent with periosteal elevation and corresponded with the sites of insertion of one or more of the adductor muscles (Fig. 6-21). The reason these findings occur only in female trainees is explained by a Saunders and colleagues’ classic description of pelvic rotation as the first of their six determinants of gait (35). Because the shorter female recruits had to march with taller males, their stride had to be lengthened to maintain straight lines of march, and exaggerating the normal pelvic rotation lengthens stride. The adductor muscles are important pelvic rotators, and their overuse apparently produced avulsion and elevation of the periosteum adjacent to their femoral insertions.
Knee
Patients complaining of traumatic or nontraumatic knee pain should undergo plain film radiographic examination with AP and lateral (Lat) knee radiographs. Patients, who complain of anterior knee pain, should undergo an additional axial (Merchant) view to the patella. In elderly patient, where degenerative osteoarthritis is highly prevalent, standing views of the knees should be order. Standing views with the knee flexed can better predict the degree of cartilaginous loss within the posterior medial and lateral knee compartments (36, 37).
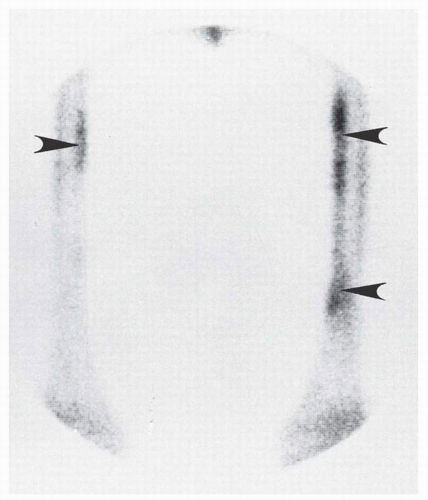 FIGURE 6-21. Thigh splint sites demonstrated by technetium-99 scintigraphy. The accentuation sites (arrowheads) correspond to the insertions of the adductor longus and magnus muscles. |
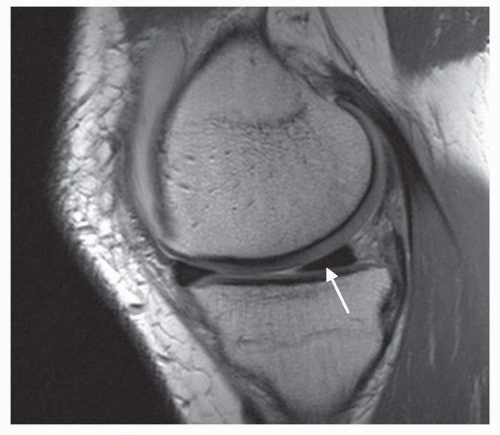 FIGURE 6-22. Sagittal MR images through a normal peripheral menisci. The anterior and the posterior (arrow) horns appear wedge (triangular) in shape. |
The use of MRI in the evaluation of osseous and soft-tissue derangements of the knee has increased substantially in recent years. MRI of the knee is the most commonly performed nonneurologic MRI study. At most institutions, it has completely replaced knee arthrography as a diagnostic tool (38).
MENISCAL INJURIES
All parts of both menisci are well visualized by MRI. Sagittal MR images provide good views of the anterior and posterior horns and a fair view of the body of both menisci. In more central sections, both horns of the menisci appear as wedge-shaped signal voids contrasted on their superior and inferior surfaces by the moderate signal intensity of the hyaline cartilage on the articular surfaces of the femur and tibia. In more peripheral sections, where the images are tangential to the circumference of the menisci, they appear bow tie shaped (Fig. 6-22). Coronal MR images provide the best visualization of the bodies of both menisci.
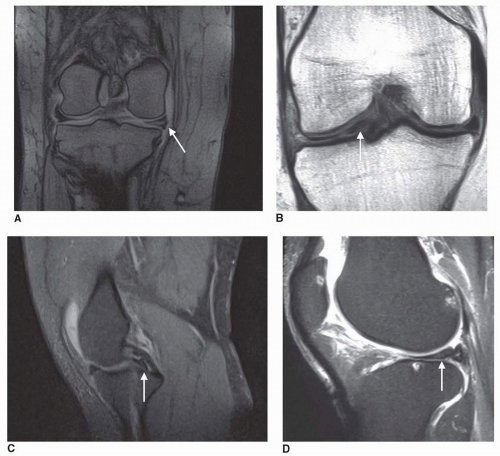
There are three types of meniscal findings visualized by MRI (16, 39, 40). One is the presence of small globular or irregular high-signal-intensity foci confined to the interior of the meniscus. This is considered to be an early type of mucoid degeneration. A second type of meniscal MRI finding is the presence of a linear region of increased signal intensity within the meniscus that does not extend to either the femoral or tibial articular surface of the meniscus but may extend to the meniscocapsular junction. Histologically, this represents fragmentation and separation of the fibrocartilage and is considered by many to be an intrameniscal tear. The significance of the globular or linear signals that do not extend to either articular surface of the meniscus is not fully agreed on (41). Frank meniscal tears are demonstrated by MRI as linear or irregular areas of signal intensity that extend to one or both articular surfaces of the meniscus (Fig. 6-23). The high signal intensity is produced by synovial fluid in the crevices within the meniscus. These meniscal tears can be horizontal, vertical, or complex. Bucket-handle tears are vertical tears where the inner meniscal fragment is displaced toward the intercondylar notch (Fig. 6-23C,D). At times, repeated trauma or chronic degeneration may cause a gross distortion of meniscal shape, and the meniscus may then appear to have a truncated apex or to be grossly small with a free fragment.
Other meniscal abnormalities well visualized by MRI include discoid meniscus, meniscal cysts, and abnormalities involving the postoperative meniscus. In discoid meniscus, typically involving the lateral meniscus, there is a continuous bridge of meniscal tissue between the anterior and the posterior horns in the central part of the joint. Meniscal cysts are usually associated with underlying horizontal meniscal tears through which synovial fluid collects at the meniscocapsular junction (42). They show high signal intensity on T2-weighted images. MRI also can be used to evaluate the postmeniscectomy patient with continuing or recurrent symptomatology (39). It can detect an incompletely excised meniscal tear, retained meniscal fragments, or a tear developing within the residual part of the meniscus. MR arthrography with gadolinium can be helpful to distinguish between retears and old healed tears that might still show increased signal intensity on T2-weighted images (43).
CRUCIATE LIGAMENT INJURIES
The cruciate ligaments are best visualized by sagittal or oblique sagittal MR images that display the full length of the ligaments (Fig. 6-24A). On straight sagittal images, the slender nature of the anterior cruciate ligament and its oblique course cause a volume-averaging effect that averages fat signal intensity about the ligaments with the normal low signal intensity of the ligament so that the anterior cruciate ligament frequently does not appear as a complete signal void. Furthermore, straight sagittal images typically fail to demonstrate the anterior cruciate ligament’s femoral attachment because of its oblique orientation in both sagittal and coronal planes. Oblique sagittal images that parallel the ligament show the full thickness and length of the anterior cruciate ligament without subjecting it to partial volume averaging (44). In the extended position of the knee, which is typically used for MR images, the anterior cruciate ligament is normally taut. The posterior cruciate ligament is a thicker ligament and is therefore well visualized on straight sagittal MR images (Fig. 6-24B). It can be visualized as a signal void structure from its attachment to the posterior tibial intercondylar area to its attachment on the medial femoral condyle. With the knee extended, the posterior cruciate ligament is visualized as thick and posteriorly bowed. It straightens with knee flexion. Axial images can be very helpful to evaluate the femoral insertion of the anterior and the posterior cruciate ligaments.
The MRI appearance of an anterior cruciate ligament injury depends on the site and degree of disruption, as well as on the age of the tear. A complete tear may be visualized as a discontinuity of the ligament (Fig. 6-25A-D). In the acute complete tear, the interval between the torn ends of the ligament is often occupied by a mass of intermediate signal intensity on T1-weighted images that appears hyperintense on T2-weighted images (45). At other times, the torn ligament may present as a fusiform or irregular soft-tissue mass of intermediate signal intensity on T1-weighted images that appears hyperintense on T2-weighted images. These fluid masses are usually a combination of edema and hemorrhage, and there may be an associated joint effusion. If the ligament tears from its femoral attachment, the axial images will show fluid signal between the lateral femoral condyle and the expected ligament insertion. In partial tears there is no complete discontinuity, but the ligament that appears intact on a T1-weighted image may show a hyperintense signal on T2-weighted images, or the ligament may display an interrupted or concave anterior or posterior margin when the knee is extended (42). In chronic anterior cruciate ligament deficiency, there may be a complete absence of the ligament, or there may be only remnants remaining in its usual location. Some secondary signs of anterior cruciate ligament injury may be present. These include a forward shift of the tibia and an anterior bowing or buckling of the posterior cruciate ligament caused by the position of the
knee within the coil, which duplicates the knee position of an anterior drawer or Lachman test (39).
knee within the coil, which duplicates the knee position of an anterior drawer or Lachman test (39).
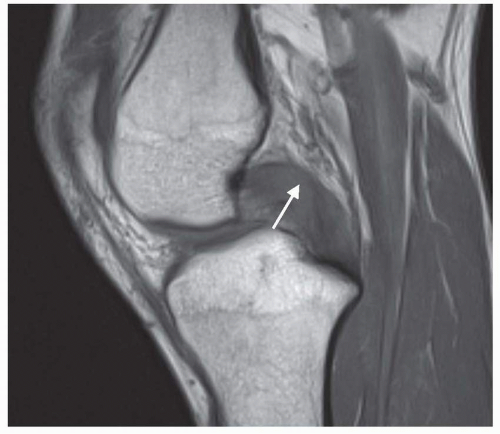
On T1-weighted MR images, partial tears of the posterior cruciate ligament typically appear as foci of increased signal intensity within the normal black signal void of the ligament. These appear hyperintense on T2-weighted images. With complete tears, a frank discontinuity is visualized with an intervening fluid mass that becomes hyperintense on T2-weighted images (Fig. 6-26). The gap between the ends of a completely torn posterior cruciate ligament can be exaggerated by imaging the knee in flexion, which tenses the posterior cruciate ligament.
COLLATERAL LIGAMENT INJURIES
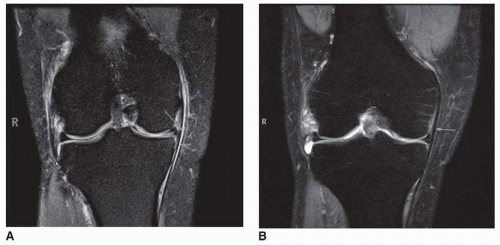
The collateral ligaments are best visualized by coronal MR images (Fig. 6-27). The medial collateral ligament appears as a narrow low-signal-intensity band extending from the medial epicondyle of the femur to an attachment on the anteromedial aspect of the tibia 5 to 6 cm below the joint line. It is overlaid at its tibial attachment by the tendons of the pes anserinus, which are separated from it by an intervening anserine bursa that is not visualized unless it is inflamed. Deep to the tibial collateral ligament, the medial capsular ligament, sometimes called the deep portion of the tibial collateral ligament, has femoral and tibial attachments close to the joint interval and deep attachments to the medial meniscus, referred to as the meniscofemoral and meniscotibial or coronary ligaments. Valgus and rotary stresses can injure the medial capsular ligament or the tibial collateral ligament, usually in that order (39). In a complete rupture (i.e., grade III injury), MRI can show discontinuity, serpentine ligamentous borders, and edema within adjacent connective tissues. In a partial tear (i.e., grade II injury) or in the case of microtears confined to the ligament substance (i.e., grade I injury), the ligament may show no discontinuity, but the overlying subcutaneous fat typically demonstrates edema and hemorrhage, which is indicated by moderate signal intensity on T1-weighted images and high signal intensity on T2-weighted images. Injury to the tibial collateral ligament is commonly associated with injuries to the anterior cruciate ligament and medial meniscus.
The lateral collateral complex commonly refers to the lateral supporting structures of the knee, whose main components are the iliotibial tract, the lateral collateral ligament, the long head of the biceps femoris, and the popliteofibular ligament. These structures are best seen on axial and coronal MR images as a low-signal-intensity band extending somewhat obliquely from the lateral femoral epicondyle to the fibular head. The lateral collateral ligament is usually injured by varus and rotary stresses to the knee, although its frequency of injury is less than that of the tibial collateral ligament. The MRI findings of the injured fibular collateral ligament are similar to those for the tibial collateral ligament.
OTHER KNEE ABNORMALITIES
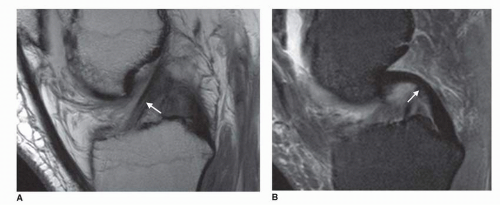
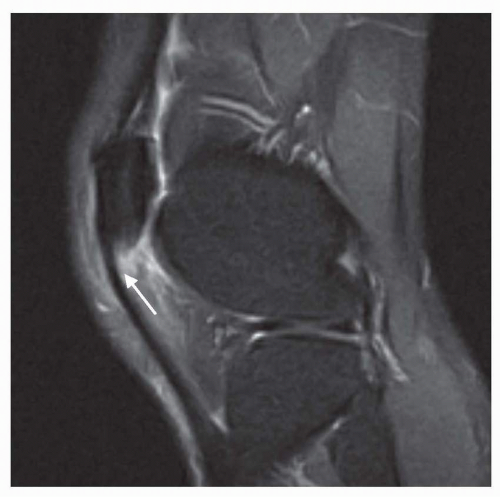
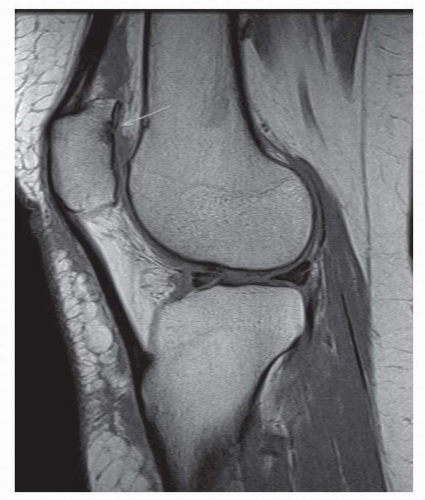
Patellar tendinitis (jumper’s knee) is demonstrated by MRI as an area of edema within the patellar ligament (i.e., tendon) at its patellar (Fig. 6-28) or tibial tuberosity attachment. There is also associated edema in the adjacent subcutaneous fat or the infrapatellar fat pad.
Ischemic necrosis about the knee most commonly involves the weight-bearing surface of the medial femoral condyle, and its MRI findings are as described for the hip.
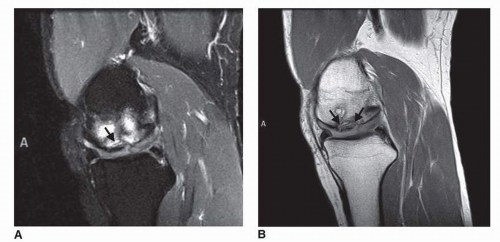
Osteochondritis dissecans occurs mainly in adolescents and involves a partial or total separation of a segment of articular cartilage and subchondral bone from the underlying bone (39). It commonly involves the intercondylar portion of the medial femoral condyle articular surface. It is visualized on T1-weighted MR images as a low-signal-intensity region in the subchondral bone with or without disruption of the overlying articular cartilage (Fig. 6-29A,B). If the involved osteochondral segment becomes completely separated from the underlying bone, it becomes an intra-articular loose body. The role of MRI in osteochondritis dissecans is mainly to determine the stability of the fragment, because the treatment hinges on that.
Chondromalacia patella can be diagnosed and graded noninvasively by MRI (40). In stage I, the posterior patellar articular cartilage demonstrates local areas of cartilage swelling with decreased signal intensity on both T1- and T2-weighted images. Stage II is characterized by irregularity of the patellar articular cartilage with areas of thinning. Stage III demonstrates complete absence of the articular cartilage with synovial fluid extending through this cartilaginous ulcer to the subchondral bone (Fig. 6-30).
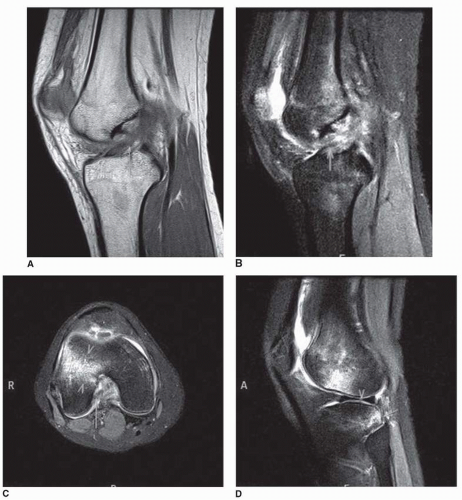
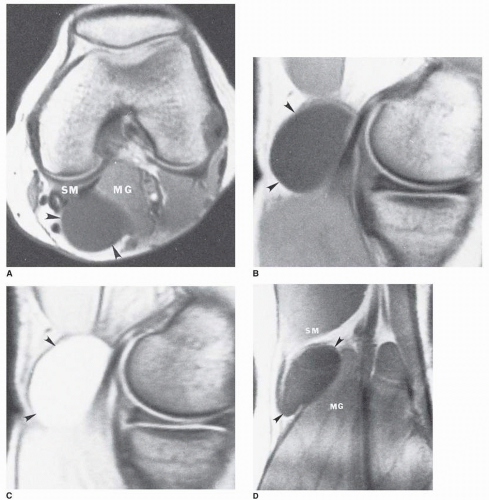
Popliteal (i.e., Baker’s) cysts and other synovial cysts about the knee appear hyperintense on T2-weighted images (Fig. 6-31A-D). They can be visualized on axial, sagittal, or coronal images. Popliteal cysts are usually an enlargement of the semimembranosus-gastrocnemius bursa, which is located between the tendon of insertion of the semimembranosus and the tendon of origin of the medial head of the gastrocnemius. Popliteal cysts may communicate with the knee joint and therefore may be caused by chronic knee joint pathology that
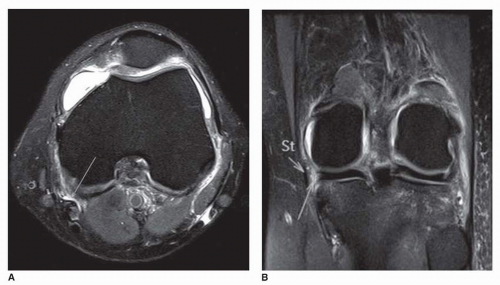
produces effusion. A previously undescribed bursa is now known to be consistently present be tween the tibial collateral ligament and a major slip of the semimembranosus tendon that extends beneath it, and may serve to clarify many cases of previously unexplained medial knee pain (46). Inflammation of this bursa is well demonstrated by MRI (Fig. 6-32A,B).
produces effusion. A previously undescribed bursa is now known to be consistently present be tween the tibial collateral ligament and a major slip of the semimembranosus tendon that extends beneath it, and may serve to clarify many cases of previously unexplained medial knee pain (46). Inflammation of this bursa is well demonstrated by MRI (Fig. 6-32A,B).
LIGAMENT INJURIES
Previously, arthrography and tenography were the primary means of imaging ankle ligament injuries. They had the limitations of being invasive, providing only an indirect depiction of ankle ligament disruption, and yielding potentially false-negative results. MRI provides a noninvasive means of directly imaging all the ligaments in the vicinity of the ankle as well as all the other osseous and soft tissues.
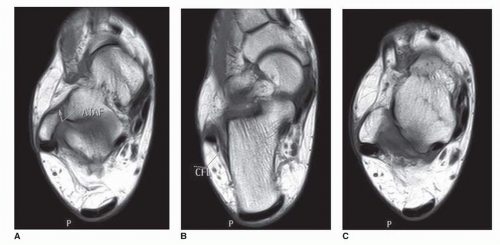
Axial MR images provide good visualization of the tibiofibular ligaments of the tibiofibular mortise. All the lateral collateral ligaments of the ankle have an oblique orientation, and to image these ligaments in full length, either an oblique imaging plane that parallels their length must be chosen or the foot must be placed in sufficient dorsiflexion or plantar flexion to bring the ligaments into one of the standard imaging planes. With the imaging plane parallel to the anterior talofibular ligament, it is displayed as a low-signal-intensity band extending anteromedially from the lateral malleolus to gain attachment to the talus just anterior to its fibular articular surface (Fig. 6-33A) (50). The calcaneofibular ligament is visualized as a low-signal-intensity structure extending from the lateral malleolus to the calcaneus, with the peroneus longus and brevis tendons situated superficial to its fibular end (Fig. 6-33B). The posterior talofibular ligament is visualized as a wide low-signal-intensity structure extending from the deep surface of the lateral malleolus to a broad attachment on the talus from its fibular articular surface to its posterior process (Fig. 6-33C).
MRI of ankle ligament injuries offers promise for the noninvasive evaluation of the site and severity of both acute ankle ligament injuries and chronic ankle instability (51).
The mechanism of injury of the lateral collateral ligaments typically involves plantar flexion and inversion, and they are usually injured in a predictable sequence from anterior to posterior. The anterior talofibular ligament is the most commonly
injured, followed in sequence by injury to the calcaneofibular and posterior talofibular ligaments. The major MRI finding in a complete rupture (i.e., grade III sprain) of the anterior talofibular ligament is a complete discontinuity of the ligament visualized at all imaging levels (Fig. 6-34A,B). This is accompanied by periarticular edema or hemorrhage and joint effusion because this ligament is a thickening of the ankle joint capsule. The edema and effusion are visualized with moderate signal intensity on T1-weighted MR images and hyperintensity on T2-weighted images. A partial tear (i.e., grade II sprain) of the anterior talofibular ligament is visualized on MRI as a discontinuity of the upper part of the ligament, with the lower portion remaining intact. Again, there is periarticular edema, hemorrhage, and joint effusion. Grade II sprains of the
calcaneofibular ligament may appear as a longitudinal splitting or waviness of the ligament with fluid accumulation within the tendon sheath of the overlying peroneal tendons (Fig. 6-35).
In contrast to the three discrete lateral collateral ligaments, the medial collateral or deltoid ligament is a continuous ligamentous sheet with an apical attachment to the tibial
malleolus, and a broad base attaching below to the navicular, talar neck, spring ligament, sustentaculum tali of the calcaneus, and posterior talus. The posterior tibiotalar part of the deltoid ligament is its thickest and strongest (52). The deltoid ligament can be visualized by either axial or coronal MRI. Axial images allow simultaneous visualization of all parts of the deltoid ligament, the overlying flexor retinaculum, and the walls and contents of the tarsal tunnel (Fig. 6-36A


malleolus, and a broad base attaching below to the navicular, talar neck, spring ligament, sustentaculum tali of the calcaneus, and posterior talus. The posterior tibiotalar part of the deltoid ligament is its thickest and strongest (52). The deltoid ligament can be visualized by either axial or coronal MRI. Axial images allow simultaneous visualization of all parts of the deltoid ligament, the overlying flexor retinaculum, and the walls and contents of the tarsal tunnel (Fig. 6-36A
Stay updated, free articles. Join our Telegram channel

Full access? Get Clinical Tree


