Diffuse Marrow Diseases
William A. Murphy Jr.
James B. Vogler III
As one of the larger and more important organs in the human body, bone marrow plays important physiologic roles in both health and disease. In healthy individuals, its function is to provide a continual supply of red cells, platelets, and white cells to meet the body’s demands for oxygenation, coagulation, and immunity. As such, bone marrow frequently becomes a target, either directly or indirectly, of many varied disease processes. The way in which marrow responds, can, at times, be dramatic.
Until recently, in vivo imaging of certain physiologic functions and anatomic features of the bone marrow has been limited. Historically, many methods have been utilized and still remain useful, despite shortcomings. Plain film radiography provides an excellent anatomic overview but is limited in detecting even considerable amounts (30% to 50%) of trabecular bone loss that might result from an intramedullary process. More importantly, a radiograph does not detect cellular changes in marrow. Scintigraphy using 99m-technetium phosphate or sulfur colloid tracers affords a physiologic survey of either marrow constituents themselves or the surrounding osseous elements. Physiologic processes such as hematopoiesis and phagocytosis can be evaluated.1 Lack of spatial resolution and low specificity, however, are recognized shortcomings. Fluorine-18-fluorodeoxyglucose positron emission tomography (FDG PET) relies on increased glucose metabolism of tumor cells to identify early bone marrow infiltration by malignant neoplasms.2,3 Sensitivities of this modality rival or exceed those of routine MR pulse sequences;2 however, specificity has yet to be established. Computed tomography (CT) provides excellent in-plane spatial resolution (on the order of 0.35 mm) and contrast resolution (on the order of 0.5%).4 These capabilities provide excellent definition of cortical bone, trabecular bone, and, to a lesser degree, the intramedullary space.
By combining multiplanar images, excellent spatial resolution, superior contrast discriminationandhigh sensitivity, magnetic resonance imaging (MRI) has greatly improved the ability for in vivo assessment of normal and abnormal bone marrow. With this imaging method, the continuous modulation of normal bone marrow patterns throughout life, the varied responses of marrow cell populations to disease, and the introduction of non-marrow cell populations can be monitored.5
NORMAL BONE MARROW
Anatomy and Physiology
The basic microstructure of bone marrow consists of an osseous framework housing fat cellsandhematopoietic cells, both supported by a system of reticulum cells, nerves, and vascular sinusoids.6 The trabecular or cancellous bone is composed of primary and bridging secondary trabeculae. By volume, this osseous tissue occupies 15% of the bone cavity and provides both architectural support and a mineral depot.7 Cellular constituents of marrow occupy the remaining 85%. These constituents include all stages of erythrocytic and leukocytic development, as well as fat cells and reticulum cells.8 Erythrocytic, granulocytic, and megakaryocytic cell lines replenish the body’s supply of red cells, white cells, and platelets. The role of fat cells in marrow function is unclear. Speculation suggests that fat cells provide surface and nutritional support and possibly growth factors for hematopoiesis.6,9 Reticulum cells consist of both phagocytic cells (macrophages) that play a role in immunity and undifferentiated non-phagocytic cells10 whose role is yet to be fully defined. In red marrow, these non-phagocytic reticulum cells occur in greater abundance in perivascular locations and form a reticular meshwork that provides nutritional and mechanical support to the hematopoietic cells.11,12 These reticular cells appear to have the capacity to accumulate lipid and transform into the fat cells of red and yellow marrow. The capability of these cells to become either red or yellow marrow components aids in explaining the capacity of red marrow to expand or retract in response to various physiologic stimuli as will be discussed later.12,13 The various components of normal marrow (fat cells, hematopoietic cells, reticulum cells, trabeculae, vessels, and
nerves) may be simplified into a unifying concept—that of red and yellow marrow. That fraction of bone marrow actively involved in the production of blood cells is termed hematopoietic or “red marrow.” The remaining fraction, which is hematopoietically inactive, is termed “yellow marrow.” Important anatomic and compositional differences exist between these two types of marrow.8 On average, the chemical composition of red marrow is approximately 40% water, 40% fat, and 20% protein.8 The cellular composition of red marrow is 60% hematopoietic cells and 40% fat cells.8,14 Red marrow has a rich, arborized vascular network. Yellow marrow’s chemical composition is approximately 15% water, 80% fat, and 5% protein.8 Its cellular composition is 95% fat cells and 5% nonfat cells.8,14 Physiologically, the fat cells in yellow marrow are relatively stable, whereas those in red marrow appear to be labile.15 Yellow marrow has a sparse vascular network.
nerves) may be simplified into a unifying concept—that of red and yellow marrow. That fraction of bone marrow actively involved in the production of blood cells is termed hematopoietic or “red marrow.” The remaining fraction, which is hematopoietically inactive, is termed “yellow marrow.” Important anatomic and compositional differences exist between these two types of marrow.8 On average, the chemical composition of red marrow is approximately 40% water, 40% fat, and 20% protein.8 The cellular composition of red marrow is 60% hematopoietic cells and 40% fat cells.8,14 Red marrow has a rich, arborized vascular network. Yellow marrow’s chemical composition is approximately 15% water, 80% fat, and 5% protein.8 Its cellular composition is 95% fat cells and 5% nonfat cells.8,14 Physiologically, the fat cells in yellow marrow are relatively stable, whereas those in red marrow appear to be labile.15 Yellow marrow has a sparse vascular network.
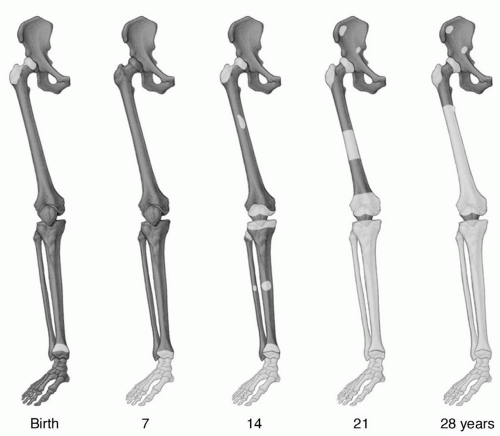 Figure 14.1 Age-related changes in red/yellow marrow distribution based on histologic studies. The natural conversion of red to yellow marrow is illustrated by drawings of the right lower extremity at 7-year increments. At birth, virtually the entire ossified skeleton contains red marrow. Conversion of red to yellow marrow begins shortly after birth and is first evident in the distal appendicular skeleton (hands and feet). Through the ensuing years, the process gradually progresses from distal to proximal with respect to the skeleton as a whole and from diaphyseal to epiphyseal in individual long bones. (Adapted from Hashimoto M. Pathology of bone marrow. Acta Haematol. 1962;27:193-216, ChenW, Shih TT, Chen R, et al. Vertebral bone marrow perfusion evaluated with dynamic contrast-enhanced MR imaging: Significance of aging and sex. Radiology. 2001;220:213-218, and Kricun ME. Red-yellow marrow conversion: Its effect on the location of some solitary bone lesions. Skeletal Radiol. 1985; 14:10-19.) |
At birth, virtually the entire marrow space contains red marrow. During growth and development, conversion of red to yellow marrow occurs throughout the skeleton. This is a normal physiologic process and has a predictable and orderly pattern. This conversion begins in the immediate postnatal period and is first evident in the terminal phalanges of the hands and feet.16 The process then progresses from peripheral (appendicular) toward central (axial), with respect to the skeleton as a whole, and from diaphyseal to metaphyseal in individual long bones (Fig. 14.1). Within the marrow cavity of long bones, conversion is seen first in the central medullary space from where it progresses toward the diaphyseal and then the metaphyseal subcortical bone. Flat bones and vertebral bodies show similar patterns with conversion moving from the central medullary space toward the metaphyseal equivalents. Although generally symmetric, the rate and extent of conversion is not uniform but varies according to site in a particular bone as well as among bones (Fig. 14.2).
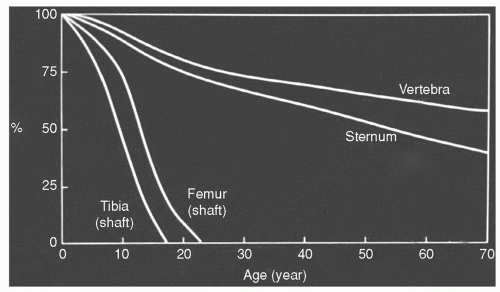 Figure 14.2 Conversion of red to yellow marrow. Changes in the red marrow fraction (percentage cellularity red marrow) at specific anatomic sites are illustrated on this graph. The rate and extent of conversion differs between axial (vertebra and sternum) and appendicular (tibia and femur) sites. The axial skeleton demonstrates a more gradual decline in the red marrow fraction with substantial amounts of red marrow persisting throughout life. The rate of red to yellow marrow conversion in the appendicular skeleton is more rapid with little red marrow persisting in the tibial and femoral shafts beyond 25 years of age. (Adapted from Custer RP. Studies on the structure and function of bone marrow. I. Variability of the hemopoietic pattern and consideration of method for examination. J Lab Clin Med. 1932;17:951-959.) |
Epiphyses and apophyses must be considered independently. These structures lack marrow until they begin to
ossify. What remains unclear is how much red marrow appears at these sites and how long it persists. Undoubtedly, any red marrow contained in these structures undergoes rapid, although not necessarily complete, conversion to yellow marrow. The conversion begins in the central marrow cavity and progresses toward the subchondral or peripheral subcortical bone. Thus, as a general rule, epiphyseal and apophyseal ossification centers can be thought of as containing yellow marrow from very early in growth and development. Yellow marrow persists in epiphyses and apophyses throughout life, with the proximal femoral and proximal humeral epiphyses/apophyses being limited exceptions to this rule. Other exceptions may exist; however, to date they remain unidentified.
ossify. What remains unclear is how much red marrow appears at these sites and how long it persists. Undoubtedly, any red marrow contained in these structures undergoes rapid, although not necessarily complete, conversion to yellow marrow. The conversion begins in the central marrow cavity and progresses toward the subchondral or peripheral subcortical bone. Thus, as a general rule, epiphyseal and apophyseal ossification centers can be thought of as containing yellow marrow from very early in growth and development. Yellow marrow persists in epiphyses and apophyses throughout life, with the proximal femoral and proximal humeral epiphyses/apophyses being limited exceptions to this rule. Other exceptions may exist; however, to date they remain unidentified.
Usually by 25 years of age, the process of primary red marrow conversion to yellow marrow is complete and a balanced distribution of red and yellow marrow has been achieved.17,18,19,20 This balance will vary from person to person as it is influenced by at least age, gender, and health. Similarly, the balance between redand yellow marrow achieved in individual bones varies by location. Red marrow is predominately concentrated in the axial skeleton (skull, vertebrae, ribs, sternum, and pelvis) and the proximal appendicular skeleton (proximal femora and humeri) (Fig. 14.3). Yellow marrow dominates the remaining portion of the appendicular skeleton and is variably admixed throughout the axial skeleton. Physiologic conversion of red to yellow marrow continues after 25 years of age, albeit at a slower pace, as evidenced by the declining fraction of red marrow at axial sites throughout adult life (Fig. 14.2).21 This process can also be observed in the proximal femoral and humeral metaphyses.22 In men, most of the red marrow conversion that will occur at these sites is nearly complete by 35 years of age, whereas women may display predominantly red marrow at these locations until 55 years of age.23,24,25
The boundaries of red and yellow marrow are not absolute and variations in this generally accepted adult pattern do exist. Islands of hematopoietic tissue may be found in areas dominated by fatty marrow and vice versa. Likewise, it is considered normal to find red marrow occupying up to two-thirds of the proximal femoral and humeral shafts.8,18,26,27
The red/yellow marrow distribution continues to change slowly with advancing age as the red marrow fraction in individual bones declines.28 Factors modulating this conversion of red to yellow marrow are largely unknown; however, temperature,29 vascularity,20 and low oxygen tension30 have been implicated.
The red/yellow marrow distribution continues to change slowly with advancing age as the red marrow fraction in individual bones declines.28 Factors modulating this conversion of red to yellow marrow are largely unknown; however, temperature,29 vascularity,20 and low oxygen tension30 have been implicated.
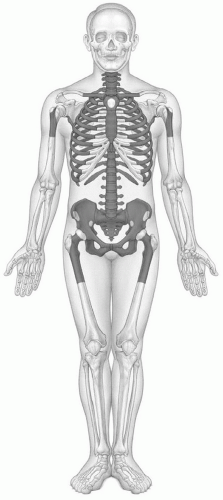 Figure 14.3 Adult pattern of red/yellow marrow based on histologic studies. The primary conversion of red to yellow marrow has been accomplished and the adult distribution of red/yellow marrow established usually by 25 years of age. Red marrow is concentrated in the axial and proximal appendicular skeleton while yellow marrow occupies the remainder of the appendicular skeleton. (Adapted from Hashimoto M. Pathology of bone marrow. Acta Haematol. 1962;27:193-216, Chen W, Shih TT, Chen R, et al. Vertebral bone marrow perfusion evaluated with dynamic contrast-enhanced MR imaging: Significance of aging and sex. Radiology. 2001;220:213-218, and Kricun ME. Red-yellow marrow conversion: Its effect on the location of some solitary bone lesions. Skeletal Radiol. 1985;14:10-19.) |
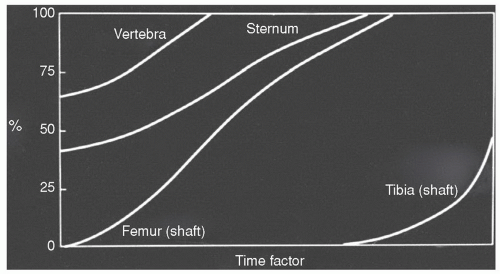 Figure 14.4 Reconversion of yellow to red marrow. Yellow marrow is reconverted to red marrow in response to the body’s demand for increased hematopoietic capacity. This reconversion process is first evident in the axial skeleton (vertebra and sternum), where the rate and extent of the process usually exceeds that of the appendicular skeleton (femur and tibia). The extent of axial and appendicular involvement is influenced by the severity and duration of the inciting stimulus. (Adapted from Custer RP. Studies on the structure and function of bone marrow. I. Variability of the hemopoietic pattern and consideration of method for examination. J Lab Clin Med. 1932;17:951-959.) |
The process of red to yellow marrow conversion is, at times, halted or reversed as alterations in the body’s demand for hematopoiesis provoke a “reconversion” of yellow marrow to red marrow. During this reconversion, yellow marrow is transformed to red marrow throughout the skeleton in the reverse sequence of the primary red to yellow marrow conversion described above. Thus, the process occurs first in the axial skeleton followed by the appendicular skeleton in a proximal to distal sequence (Fig. 14.4).19,20,21,31 Within individual bones, reconversion is first seen at endosteal locations in metaphyses or epiphyses or their equivalents. From there, it progresses toward the central marrow space and toward the diaphyseal subcortical bone, ultimately extending into the central diaphyseal marrow cavity. Temperature,29 low oxygen tension,30 and elevated erythropoietin32 are again implicated in initiating and modulating this process, although the actual mechanisms and controlling factors remain largely unknown.
MAGNETIC RESONANCE FEATURES
Red and Yellow Marrow
Fat, water, protein, and minerals are the basic constituents of bone marrow that contribute to the formation of its MR image.27 As relative amounts of these constituents change, the signal intensity of marrow is altered accordingly. Fat cells are responsible for the greatest fraction of marrow signal on T1-weighted images. Most protons in fat are contained in hydrophobic CH2 groups and demonstrate very efficient spin-lattice relaxation, resulting in a particularly short T1 relaxation time and thus high signal intensity on T1-weighted spin-echo images.33,34 Spin-spin relaxation of fat is less efficient, resulting in some prolongation of its T2 relaxation time and thus moderate signal intensity on T2-weighted spin-echo images.
Water in tissue is thought to exist in different forms. Tissues rich in free water (extracellular water) show longer T1 and T2 relaxation times, whereas those having greater amounts of bound (intracellular) water demonstrate a shortening of T1 and T2 relaxation values.35 The relative contribution of each type of water to overall marrow signal is not clearly defined. Nevertheless, as the amount of marrow water increases, it is logical to expect lower signal intensity on T1-weighted images and higher signal intensity on T2-weighted images.
The contribution of protein to marrow signal intensity is poorly understood. Protein in general has a long T1 relaxation time due to the large size of the molecules.35 Yet, protein in solution will result in a shortening of the T1 relaxation time of that solution. The individual contribution of these competing signal patterns to overall marrow signal intensity remains unclear.
Mineral contributes in a negative fashion to bone marrow signal intensity through two different mechanisms. First, due to a lack of mobile protons, the mineral matrix produces little or no signal; second, inhomogeneous susceptibility where mineral matrix interfaces with water or fat results in local field gradients and signal loss. The mineral matrix of bone marrow is contained in trabecular bone. Since metaphyses and epiphyses contain greater amounts of trabecular bone, signal intensity at these sites is altered accordingly.
Signal characteristics of red and yellow marrow will vary among the different pulse sequences. The vast majority of clinical studies and most of the basic knowledge of MR marrow patterns to date have been based on routine spin-echo pulse sequences with T1- and T2-weighted images. More recently, fast spin-echo techniques have gained popularity in clinical MRI and have replaced conventional proton density and T2-weighted sequences in many routine protocols. Because of these considerations, spin-echo pulse sequences (both conventional and fast) will be used to describe typical signal patterns of yellow and red marrow in this chapter.17,27,36,37 These T1 and T2 signal patterns also form the basis for understanding many of the newer pulse sequences discussed later in this chapter.
Yellow marrow, owing to its high fat chemical composition (80%), displays signal intensity comparable to that of subcutaneous fat on T1- and T2-weighted images using both conventional and fast techniques without fat saturation (Fig. 14.5). For comparison purposes, yellow marrow is higher in signal intensity than muscle on both pulse sequences. Having larger fractions of water (40%) and protein (40%) with a smaller fraction of fat (20%), red marrow displays signal intensity lower than that of yellow marrow on T1-weighted images (Figs. 14.6, 14.7, 14.8). As a reference, red marrow signal intensity is generally slightly higher than normal muscle or non-degenerated intervertebral disks on T1-weightedimages.38 The only exception to this rule occurs in infants. At birth, red marrow contains very little fat. As a result, red marrow signal intensity on T1-weighted images is lower than that of muscle or intervertebral disk until approximately 2 months of age.39 As cellularity of red marrow decreases, its T1 signal intensity rises such that at 1 year of age it is roughly equal to the signal intensity of intervertebral disk. Above 1 year of age, the T1 signal intensity of red marrow should not be lower than that of intervertebral disk, and by 5 years of age, red marrow signal intensity should exceed that of intervertebral disk.39 On proton density and T2-weighted images, the signal intensity of red marrow increases (probably as a result of its water fraction) and approaches that of yellow marrow on both conventional and fast spin pulse sequences (Figs. 14.7 and 14.8). With short TI inversion recovery (STIR) imaging
or heavy T2-weighting (repetition time exceeding 3,000 ms and echotimemore than 90 ms), redmarrowsignal intensity may even exceed that of yellow marrow (Fig. 14.9). Similarly, adding fat saturation techniques to either conventional or fast spin pulse sequences causes red marrow to appear higher in signal intensity than yellow marrow on proton density and T2-weighted images (even with TRs as low as 1,500 ms and TEs as low as 60 ms) (Fig. 14.8). Red marrow will appear approximately equal to or slightly lower in signal intensity than muscle on proton density images with fat saturation, and will typically appear higher in signal intensity than muscle on T2-weighted images with fat saturation. Thus, on T1-weighted pulse sequences in normal individuals 5 years of age or older, yellow marrow will be higher in signal intensity than red marrow, which in turn is higher in signal intensity than muscle or non-degenerated intervertebral disks. With increasing repetition times and echo delays on conventional sequences without fat saturation, the signal intensity of red marrow approaches that of yellow marrow and both remain higher in signal than muscle, but lower in signal than fluid. The relative signal intensities of red marrow, yellow marrow, muscle, and fluid remain the same on both conventional and fast spin-echo techniques. On fast spin-echo proton density and T2 sequences without fat saturation, however, the difference in signal intensity between red and yellow marrow can appear higher than that on conventional sequences, since yellow marrow maintains much of its high signal on fast spin-echo proton density and T2 images (Figs. 14.7 and 14.8). Adding fat saturation to either conventional or fast spin-echo techniques causes red marrow to become more conspicuous against the black background of fatty marrow.
or heavy T2-weighting (repetition time exceeding 3,000 ms and echotimemore than 90 ms), redmarrowsignal intensity may even exceed that of yellow marrow (Fig. 14.9). Similarly, adding fat saturation techniques to either conventional or fast spin pulse sequences causes red marrow to appear higher in signal intensity than yellow marrow on proton density and T2-weighted images (even with TRs as low as 1,500 ms and TEs as low as 60 ms) (Fig. 14.8). Red marrow will appear approximately equal to or slightly lower in signal intensity than muscle on proton density images with fat saturation, and will typically appear higher in signal intensity than muscle on T2-weighted images with fat saturation. Thus, on T1-weighted pulse sequences in normal individuals 5 years of age or older, yellow marrow will be higher in signal intensity than red marrow, which in turn is higher in signal intensity than muscle or non-degenerated intervertebral disks. With increasing repetition times and echo delays on conventional sequences without fat saturation, the signal intensity of red marrow approaches that of yellow marrow and both remain higher in signal than muscle, but lower in signal than fluid. The relative signal intensities of red marrow, yellow marrow, muscle, and fluid remain the same on both conventional and fast spin-echo techniques. On fast spin-echo proton density and T2 sequences without fat saturation, however, the difference in signal intensity between red and yellow marrow can appear higher than that on conventional sequences, since yellow marrow maintains much of its high signal on fast spin-echo proton density and T2 images (Figs. 14.7 and 14.8). Adding fat saturation to either conventional or fast spin-echo techniques causes red marrow to become more conspicuous against the black background of fatty marrow.
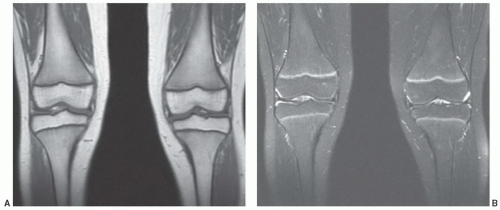 Figure 14.5 Normal red/yellow marrow signal intensities about the knee of a 10-year-old girl. A: On a T1-weighted image (FSE 550/9), signal characteristics of epiphyseal marrow show high signal intensity yellow marrow equivalent to subcutaneous fat. Cancellous trabecular bone pattern is evident within the epiphyses. Red marrow in the metadiaphyseal regions is lower signal intensity than either subcutaneous fat or epiphyseal yellow marrow, yet is of higher signal intensity than adjacent muscle. A higher yellow marrow fraction in the central femoral diaphyses imparts locally higher signal intensity. B: On a fat-saturated T2-weighted image (FSE 4600/82), the fat fraction of all marrow regions is sufficient to overwhelm the red marrow fraction resulting in generalized low signal intensity other than the highly vascular metaphyseal zones adjacent to the physes. |
Having a more extensive blood supply, hematopoietic marrow enhances to a greater degree than fatty marrow following intravenous administration of gadolinium-containing agents, thus reducing the normal contrast between red and yellow marrow on enhanced T1-weighted images (without fat suppression).40 As a result, the signal intensity changes that occur with normal marrow conversion also become less apparent.40 This differential enhancement is more evident in younger individuals and decreases with age as the cellularity of red marrow declines.41 Advancing age also produces atherosclerotic changes, causing vascular deterioration and further decline in marrow perfusion.42 In adults, visual detection of marrow enhancement on T1-weighted images (without fat saturation) is not possible despite measurable signal intensity changes between unenhanced and enhanced images.43 Since maximum marrow enhancement occurs within the first minute after bolus injection and washes out thereafter, the process cannot be appreciated on standard spin-echo pulse sequences.44 The use of dynamic ultra-fast MR sequences overcomes this limitation and allows for identification of marrow enhancement. Adding fat suppression to gadolinium-enhanced T1-weighted pulse sequences also results in the differential enhancement of
red and yellow marrow becoming more conspicuous at any age (Fig. 14.10).
red and yellow marrow becoming more conspicuous at any age (Fig. 14.10).
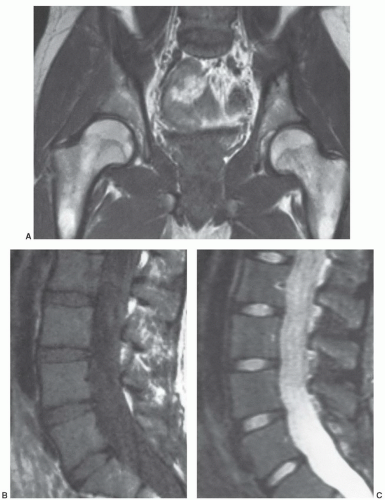 Figure 14.6 Normal red/yellow marrow signal intensities in the axial skeleton (conventional spin-echo) of a 24-year-old woman. A: On a coronal, T1-weighted image (SE 600/20) of the pelvis, signal characteristics of red and yellow marrow are apparent. Yellow marrow (seen in the proximal femoral shafts and femoral epiphyses) is roughly isointense to subcutaneous fat. Red marrow (present in the femoral metaphyses, pelvis, and lumbar vertebrae) is lower in signal intensity than yellow marrow but slightly higher in signal intensity than muscle. Note that regions containing higher fractions of red marrow in the axial skeleton (lumbar vertebra) demonstrate lower signal intensity than areas in the appendicular skeleton where the red marrow fraction is less (femurs). Sagittal T1- (SE 500/20) (B) and T2-weighted (SE 2,000/80) (C) images of the lumbar spine show red marrow as having slightly higher signal intensity than fluid (cerebrospinal fluid) or intervertebral disks on T1-weighted images. Due to the young age of the patient, the red marrow fraction is high, making the T1 signal intensity of vertebral marrow close to that of intervertebral disk. Note also that the signal intensity of red marrow is approaching that of subcutaneous fat on the T2-weighted image and is lower than spinal fluid. |
 Figure 14.7 Normal red/yellow marrow signal intensities in the appendicular skeleton (conventional spin-echo) of a 28-year-old woman. A: T1-weighted (SE 500/20) coronal and (B) T2-weighted (SE 2,000/80) axial images of the knee in a 28-year-old woman display signal patterns of normal red and yellow marrow in the appendicular skeleton. On the T1-weighted image (A), red marrow in the distal femoral metaphysis is lower in signal intensity than yellow marrow seen in the adjacent femoral epiphysis and tibia. Yellow marrow is roughly isointense with subcutaneous fat. Red marrow is higher in signal intensity than muscle (seen in the distal thigh) or fluid (present in the joint). On the T2-weighted axial image (B), yellow marrow remains roughly isointense with subcutaneous fat. The signal intensity of red marrow approaches that of yellow marrow but typically is slightly hypointense, as in this example. Both red and yellow marrow are higher in signal intensity than muscle but lower in signal intensity than fluid (present in the suprapatellar bursa). |
The T1-weighted MR appearance of marrow in any particular bone will be determined by the relative fractions of red marrow, yellow marrow, and trabecular bone. At locations where the red marrow fraction is high, overall marrow signal intensity will be lower than at sites where little red marrow is found (Fig. 14.6). In the absence of significant differences of other mitigating factors (protein, mineral), it appears that the percentage of fat in the marrow is the controlling factor as to whether voxel signal intensity will reflect red or yellow marrow. As little as 10% histologic fat in a region of red marrow may result in slightly increased signal intensity on T1-weighted images. When the histologic fat fraction reaches 20%, the MR appearance approaches that of fatty marrow.45,46 This phenomenon helps to explain the consistent overestimation of the fat fraction on MR images and differences in the distribution of red and yellow marrow throughout the skeleton observed on histologic (Figs. 14.1 and 14.3) and MR studies (Figs. 14.13, 14.16, and 14.19).
The boundaries between red and yellow marrow change rapidly in the first two decades of life and then more slowly thereafter, but continual change is the general rule. Varying fractions of cellular and fatty marrow can produce a spectrum of signal alterations on MR images. These changes at times result in an inhomogeneous appearance of the marrow, raising concern for the presence of disease. Several features of normal marrow may be helpful in its identification on T1-weighted images.47 Localized areas of high or low signal intensity probably reflect regions of focal fatty conversion or islands of increased marrow cellularity respectively.48,49 Areas of focal fatty conversion generally have a characteristic appearance and do not present diagnostic dilemmas (Fig. 14.11). Islands of red marrow can be more problematic. These tend to be geographic or elongated in shape but generally do not have a large, round appearance. They have indistinct margins in younger patients (when marrow conversion is less advanced) and distinct margins in older patients (when marrow conversion is more advanced).50 The red marrow islands predominate
in endosteal locations and tend to be symmetric within individual bones (and in the skeleton as a whole), absent complicating factors such as degenerative change. Histologic studies have demonstrated that conversion to fatty marrow first occurs centrally within a region of red marrow leaving a focus of fat surrounded by a rim of cellular marrow.20,21 The MR equivalent of this histologic process is a central focus of high signal intensity (fat) within an island of low signal intensity (red marrow). This finding has been termed a bull’s-eye sign. Although often subtle, when present, this sign becomes a useful indicator of normal marrow.51 Finally, areas of low signal intensity in the marrow space that are presumed to represent normal red marrow should show appropriate signal changes on T2-weighted images and follow gadolinium enhancement as described previously. When the area of signal alteration in question falls within these parameters it can be presumed to represent normal marrow, realizing that, infrequently, some pathologic conditions (i.e., myeloma) can be present when the marrow has a normal MR appearance. Thus, at times, confirmation of MR findings may be necessary with either bone marrow biopsy or follow-up examinations when the clinical situation warrants.
in endosteal locations and tend to be symmetric within individual bones (and in the skeleton as a whole), absent complicating factors such as degenerative change. Histologic studies have demonstrated that conversion to fatty marrow first occurs centrally within a region of red marrow leaving a focus of fat surrounded by a rim of cellular marrow.20,21 The MR equivalent of this histologic process is a central focus of high signal intensity (fat) within an island of low signal intensity (red marrow). This finding has been termed a bull’s-eye sign. Although often subtle, when present, this sign becomes a useful indicator of normal marrow.51 Finally, areas of low signal intensity in the marrow space that are presumed to represent normal red marrow should show appropriate signal changes on T2-weighted images and follow gadolinium enhancement as described previously. When the area of signal alteration in question falls within these parameters it can be presumed to represent normal marrow, realizing that, infrequently, some pathologic conditions (i.e., myeloma) can be present when the marrow has a normal MR appearance. Thus, at times, confirmation of MR findings may be necessary with either bone marrow biopsy or follow-up examinations when the clinical situation warrants.
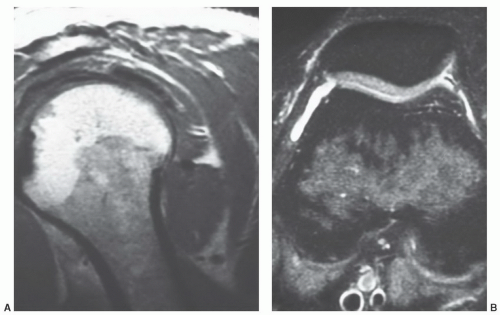 Figure 14.8 Normal red/yellow marrow signal intensities in the appendicular skeleton [fast spin-echo (FSE) images without and with fat saturation] of a 36-year-old woman. A: An FSE T2-weighted (2,900/96, 6 echo train) sagittal image of the shoulder in a 36-year-old woman illustrates typical features of red and yellow marrow on this sequence. Fatty marrow (seen in the humeral epiphysis) remains relatively high in signal intensity on FSE T2-weighted images. Red marrow (present in the humeral metaphysis) displays signal intensity lower than fatty marrow but higher than muscle. B: Adding fat-saturation, as on this FSE proton density (3,000/28) axial image of the knee in a different patient, results in nulling of the fatty marrow. The signal intensity of red marrow is higher than that of yellow marrow and roughly similar to muscle but lower in signal intensity than fluid (present in the suprapatellar bursa). |
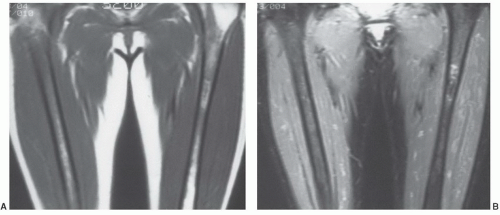 Figure 14.9 Normal marrow in a 30-year-old woman. A: On a coronal, T1-weighted image (SE 500/20) of the thighs, red marrow can be seen occupying the mid- and proximal femoral shafts. Yellow marrow is evident in the distal femoral shafts and left greater trochanter (right greater trochanter not included on this section). B: A coronal STIR image at approximately the same level demonstrates the red marrow to have signal intensity exceeding that of the nulled yellow marrow. (The focal area of increased signal intensity in the proximal left femur has been described as a normal variant.) |
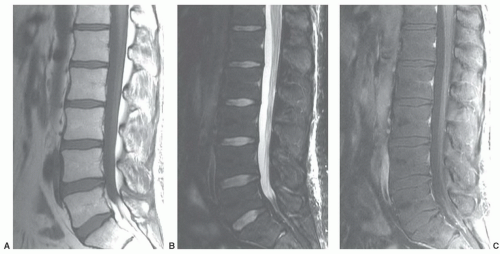 Figure 14.10 Normal enhancement pattern in lumbar spine of 33-year-old man. A: Sagittal T1-weighted image (FSE 600/10) shows nearly homogeneous bone marrow with a high yellow marrow fraction as indicated by uniformly high signal intensity. B: Sagittal fat-saturated T2-weighted image (FSE 3500/97) shows suppressed low intensity marrow due to the high fat fraction (note high signal intensity intervertebral discs and spinal fluid. C: Sagittal gadolinium-enhanced, fat-saturated T1-weighted image (FSE 400/10) shows subtle enhancement due to the small red marrow fraction throughout the marrow. |
 Figure 14.11 Focal fatty conversion of red marrow in the lumbar spine of a 59-year-old woman. A: A sagittal T1-weighted image (FSE 800/13) of the lumbar spine demonstrates focal areas of increased signal intensity (comparable to subcutaneous fat) scattered within vertebral body bone marrow (most conspicuous at L1, L2, and L5). B: These areas of fat deposition disappear on fat-saturated T2-weighted images (FSE 5000/107). C: On gadolinium-enhanced, fat-saturated, T1-weighted images (FSE 900/13), the fat deposits appear as low signal intensity features in a background of mildly enhancing red marrow. |
 Figure 14.12 Focal and diffuse red to yellow marrow conversion in the lumbar spine. Sagittal T1-weighted images (SE 500/20) of the lumbar spine in a 19-year-old woman (A) and a 32-year-old man (B) demonstrate different patterns of red to yellow marrow conversion. (A) illustrates focal conversion around the basivertebral plexus while (B) demonstrates diffuse conversion throughout the vertebral marrow. Note that the vertebral marrow in (B) is generally higher in signal intensity than that in figure (A). This reflects diffuse red to yellow marrow conversion and a lower fraction of red marrow present in the older patient. |
Axial Skeleton
In the skull, MR conversion of red to yellow marrow occurs early, generally before 20 years of age,52 and appears to be more prominent in the frontal and occipital bones. MR evidence of red marrow in the parietal bones persists later in life in some individuals. Many patients, however, will demonstrate only fatty marrow in the entire diploic space on MRI as early as the second decade of life.
Marrow signal intensity in vertebral bodies (sites where the red marrow fraction remains relatively high throughout life) is lower than marrow signal intensity in the distal appendicular skeleton, where little red marrow persists in adulthood. In the normal individual, the red/yellow marrow and trabecular bone fractions turn over continuously, but change slowly throughout life. This is reflected by the changing marrow appearance seen on MR images in patients of various ages. The general pattern of change observed on T1-weighted images is one that begins with vertebral marrow
displaying diffuse low signal intensity (lower than intervertebral disks) in patientsup to 1 year of age.39 From1 to 5 years of age, the marrow is roughly equal in signal intensity with intervertebral disk. Conversion of red marrow then proceeds focally and diffusely within the vertebral body. Described focal patterns include basivertebral and band patterns.39,52 In the former, a triangular area of fat conversion appears around the exit site of the basivertebral vein, whereas the latter (possibly a variation of the basivertebral pattern) displays a band of high signal fat conversion centrally in the vertebral body (Figs. 14.12A and 14.13A). Disappearance of this basivertebral fat dorsally in the vertebral body has been reported as one of the earliest signs of malignant invasion of marrow.53 These focal patterns of conversion are generally observed in children (older than 5 years) and young adults. Other age-related MR patterns of hematopoietic and fatty marrow in the spine have been described and generally occur in older adults (Figs. 14.12B and 14.13B-D).52 Fatty marrow can appear near the end plates, presumably due to mechanical stress or degenerative disk disease (Figs. 14.13B and 14.14). This pattern is seen more commonly in the cervical and lumbar regions. Variably sized foci of fatty marrow can also occur diffusely distributed throughout the vertebral body (Fig. 14.13C and D). These patterns occur with greater frequency in patients older than 40 years and may both be present at the same time. There seems to be no orderly progression between the different adult patterns of focal conversion. Diffuse conversion in the vertebral body is evidenced by a gradual increase in T1 signal intensity (Fig. 14.12B). For example, measured T1 relaxation times of vertebral bodies decline with age,54 probably reflecting a decreasing fractional volume of hematopoietic marrow with concomitant increase in fatty marrow. Supportin g this finding is an age-dependent linear increase in fat content of vertebral bodies measured by proton MR spectroscopy.10 The shortening of T1 values is most pronounced in the first four decades of life when normal conversion of red to yellow marrow occurs. Beyond the fourth decade, loss of trabecular bone mass and the resultant reduction of vertebral mineral content (by approximately 40% in men and 55% in women by age 75 years)55 contributes to the decline in T1 values. T2 relaxation times show a similar decline with age. Differential loss of trabecular bone with replacement by fat cells, as occurs in osteoporosis, may help explain differences in the range of T1 and T2 values for men and women, which is similar under the age of 40 years but slightly higher in women after 50 years of age.54 Declining vertebral bone marrow perfusion due to atherosclerosis also contributes to this phenomenon. The rate of bone marrow perfusion decreases significantly in individuals older than 50 years.42 Despite having higher rates of vertebral bone marrow perfusion before 50 years of age, women show a more marked decrease than men after the fifth decade.
displaying diffuse low signal intensity (lower than intervertebral disks) in patientsup to 1 year of age.39 From1 to 5 years of age, the marrow is roughly equal in signal intensity with intervertebral disk. Conversion of red marrow then proceeds focally and diffusely within the vertebral body. Described focal patterns include basivertebral and band patterns.39,52 In the former, a triangular area of fat conversion appears around the exit site of the basivertebral vein, whereas the latter (possibly a variation of the basivertebral pattern) displays a band of high signal fat conversion centrally in the vertebral body (Figs. 14.12A and 14.13A). Disappearance of this basivertebral fat dorsally in the vertebral body has been reported as one of the earliest signs of malignant invasion of marrow.53 These focal patterns of conversion are generally observed in children (older than 5 years) and young adults. Other age-related MR patterns of hematopoietic and fatty marrow in the spine have been described and generally occur in older adults (Figs. 14.12B and 14.13B-D).52 Fatty marrow can appear near the end plates, presumably due to mechanical stress or degenerative disk disease (Figs. 14.13B and 14.14). This pattern is seen more commonly in the cervical and lumbar regions. Variably sized foci of fatty marrow can also occur diffusely distributed throughout the vertebral body (Fig. 14.13C and D). These patterns occur with greater frequency in patients older than 40 years and may both be present at the same time. There seems to be no orderly progression between the different adult patterns of focal conversion. Diffuse conversion in the vertebral body is evidenced by a gradual increase in T1 signal intensity (Fig. 14.12B). For example, measured T1 relaxation times of vertebral bodies decline with age,54 probably reflecting a decreasing fractional volume of hematopoietic marrow with concomitant increase in fatty marrow. Supportin g this finding is an age-dependent linear increase in fat content of vertebral bodies measured by proton MR spectroscopy.10 The shortening of T1 values is most pronounced in the first four decades of life when normal conversion of red to yellow marrow occurs. Beyond the fourth decade, loss of trabecular bone mass and the resultant reduction of vertebral mineral content (by approximately 40% in men and 55% in women by age 75 years)55 contributes to the decline in T1 values. T2 relaxation times show a similar decline with age. Differential loss of trabecular bone with replacement by fat cells, as occurs in osteoporosis, may help explain differences in the range of T1 and T2 values for men and women, which is similar under the age of 40 years but slightly higher in women after 50 years of age.54 Declining vertebral bone marrow perfusion due to atherosclerosis also contributes to this phenomenon. The rate of bone marrow perfusion decreases significantly in individuals older than 50 years.42 Despite having higher rates of vertebral bone marrow perfusion before 50 years of age, women show a more marked decrease than men after the fifth decade.
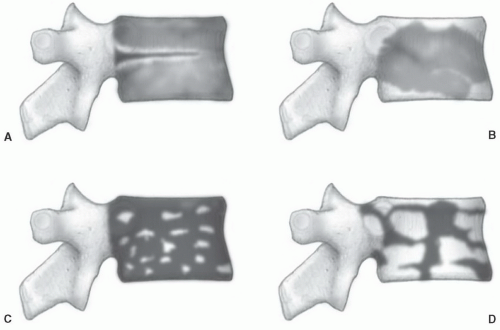 Figure 14.13 Age-related patterns of red/yellow marrow in the spine based on MR studies. A: In pattern 1, a larger fraction of cellular marrow is present throughout the vertebral body resulting in an overall lowering of signal intensity on T1-weighted images. Conversion of red to yellow marrow is observed around the central venous plexus. This pattern is seen most commonly in younger patients. B: Pattern 2 reflects the effects of mechanical stress on vertebral marrow subjacent to endplates, where conversion of cellular to fatty marrow is observed. C, D: Patterns 3a and 3b. Foci of yellow marrow are diffusely distributed throughout the vertebral body. These foci range from being only a few millimeters in size (pattern 3a) to larger geographic areas of 0.5 to 1.5 cm (pattern 3b). (From Ricci C, Cova M, Kang YS, et al. Normal age-related patterns of cellular and fatty bone marrow distribution in the axial skeleton: MR imaging study. Radiology. 1990;177:83-88.) |
 Figure 14.14 Vertebral marrow alterations associated with degenerative disc disease in a 54-year-old woman. On a sagittal T1-weighted image (FSE 600/10) of the lumbar spine, bands of high signal intensity parallel the degenerated disc at L3/L4. These bands are focal zones of fatty replacement of otherwise normal red marrow. |
Other factors can influence the MR appearance of vertebral marrow through mechanisms that are, at present, incompletely understood. As the normal age-related conversion of red to yellow marrow occurs in the spine, the process may progress along a more focal (rather than diffuse) pattern in adults.56 This focal conversion to fatty marrow is more evident in the posterior elements, about the central venous channels, and at the periphery of vertebral bodies, particularly adjacent to the end plates (Fig. 14.11). Marrow affected by this process assumes a spotty appearance (particularly on T1-weighted images) as the bright foci of fat contrast with the lower signal-intensity background of red marrow. The process of focal fat deposition is more prevalent with increasing age and may be present in up to 60% of patients. Among the hypotheses put forward to explain this phenomenon of focal fat distribution is that chronic stress and biomechanical stimuli cause diminished vascularity at involved sites. Insufficient blood flow prompts the conversion of red to yellow marrow.
Certain common diseases cause typical alterations in the MR appearance of vertebral marrow. Adjacent to degenerating intervertebral disks, marrow can assume a band-like configuration of variable signal intensity.57 Bands of decreased signal intensity on short and long TR/TE images are occasionally observed and probably reflect medullary sclerosis and/or fibrosis adjacent to the end plate. A common juxta-endplate pattern is a band of increased signal intensity (similar to fat) on short TR/TE and long TR/TE images. This focal conversion of hematopoietic to fatty marrow probably results from ischemia associated with degenerative disk disease (Fig. 14.14). Rarely, a juxta-endplate pattern of decreased signal intensity on short TR/TE images and increased signal intensity on long TR/TE images is observed (Fig. 14.15). This pattern probably indicates increased local extracellular marrow water content possibly as a result of focal inflammation or ischemia. Age-related marrow changes in the pelvis manifest as early conversion of red to yellow marrow in the acetabular regions and anterior ilium and more gradual conversion throughout the remainder of the pelvis.52,58 Fatty marrow appears in the anterior ilium and acetabular areas before 5 years of age, resulting in a heterogeneous MR pattern of the marrow at these sites (Fig. 14.16A). This conversion of red to yellow marrow occurs with such reliability that the absence of such a finding by 5 years of age should prompt further investigation. Marrow signal intensity and heterogeneity on T1-weighted images in the remainder of the pelvis increase with age and correlate with increased fractions of microscopic fat in the marrow (Fig. 14.16B). Areas of confluent red marrow evolve to increasingly well-defined islands in older patients.50 At or around the sixth decade, residual hematopoietic marrow is found predominately in the posterior iliac crests and sacrum (sacral vertebral bodies and sacral ala adjacent to the sacroiliac joints) with very little identifiable cellular marrow remaining in the acetabular regions and symphysis pubis.50,59 The reverse pattern (higher fractions of red marrow being observed in symphyseal and acetabular areas than in the sacrum and posterior iliac regions) is uncommon in normal individuals and should raise concern for pathologic marrow processes.50 Gender-related differences of red and yellow marrow in the sacrum have been described and generally identify the red marrow fraction as being larger and more cellular in women.59
Appendicular Skeleton
At sites where red marrow is present, a variety of signal patterns may be observed reflecting relative red/yellow marrow fractions and distribution. A common pattern observed is islands of red marrow scattered throughout a background of fatty marrow (Fig. 14.17). The islands may have a variety of configurations ranging from small and elongated to large and geographic. Less commonly in the long bones, foci of yellow marrow are evident in a background of red marrow resembling the phenomena of focal fat conversion in the vertebral bodies.
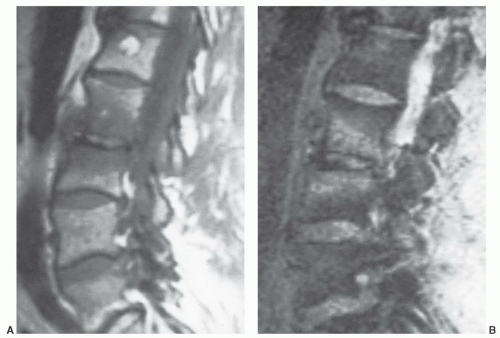 Figure 14.15 Vertebral marrow alterations associated with degenerative disc disease in a 68-year-old man. Bands of low signal intensity are noted subjacent to the end plates at the L2-3 interspace on a sagittal T1-weighted image (SE 600/20) (A). These bands show increased signal intensity on a T2-weighted image (SE 2000/80) (B), presumably reflecting increased local marrow water in response to degenerative disc disease. |
In the appendicular skeleton and in individual long bones, common local MR marrow patterns also exist. The humerus and femur warrant special attention. They represent the long bones that consistently contain the greatest residual concentration of hematopoietic marrow in adults and, in essence, are the sites of transition between the “fatty” appendicular marrow and the “hematopoietic” axial marrow. In these bones, red marrow is commonly found in the proximal two-thirds (Fig. 14.17), with the greatest fraction usually in the proximal one-third. Less commonly, foci
of red marrow may be evident in the distal one-third of these bones. This finding, by itself, should not be considered abnormal.
of red marrow may be evident in the distal one-third of these bones. This finding, by itself, should not be considered abnormal.
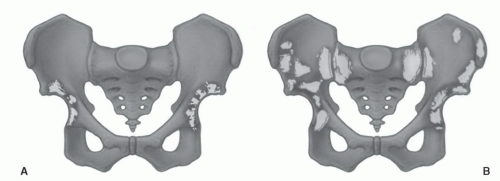 Figure 14.16 Age-related marrow patterns in the pelvis. A: Fatty marrow is observed in the acetabular regions early in life, usually before 5 years of age. B: With age, fatty marrow appears in larger fractions at other locations throughout the pelvis, particularly adjacent to the sacroiliac joints. (From Ricci C, Cova M, Kang YS, et al. Normal age-related patterns of cellular and fatty bone marrow distribution in the axial skeleton: MR imaging study. Radiology. 1990;177:83-88.) |
 Figure 14.17 Normal marrow distribution in a 48-year-old man. Islands of red marrow (identified as foci of decreased signal intensity in the bright fatty marrow) can be seen to extend to the junction of the middle and distal thirds of the femora. This finding is not unusual and should not by itself be considered abnormal. |
MR patterns reflecting the balance of red and yellow marrow fractions in the shoulder and humerus change throughout life.23,24,60 Normal red to yellow marrow conversion in the humerus occurs early in the distal epiphysis, distal metaphysis, and diaphysis and is often complete by age 6 years.60 Red marrow persists in the proximal humeral metaphysis in a majority of patients until late in life (at least the seventh decade).24 In a smaller number of normal individuals, it can be found in the proximal humeral epiphysis. This occurs more frequently in younger patients (Fig. 14.18). Similarly, although red to yellow marrow conversion begins early in the acromion (an epiphyseal equivalent) and continues throughout life, residual red marrow may also be found at this site. In the glenoid, conversion begins later, progresses more slowly, and remains incomplete throughout life.
In the femora, increased signal intensity reflecting the beginning of conversion of hematopoietic to fatty marrow can be seen in the diaphyseal marrow as early as 3 months of age.22,61 As the fat fraction increases, the marrow shows varying degrees of heterogeneity on MRI. This feature is always present by 1 year of age. Between 5 and 10 years of age, unequivocal fatty marrow is present in the diaphysis (Fig. 14.19).46 The absence of diaphyseal fatty marrow at age 10 years or older is distinctly unusual and requires further investigation to exclude underlying marrow disease. In the distal femoral metaphysis, a homogeneous red marrow MR pattern after 25 years of age is atypical and requires explanation if encountered. However, geographic or spotty areas of red marrow can be observed in the distal femoral metaphyses of men and women at almost any age.62 This finding can be encountered in approximately half of female and one-sixth of male patients. Metaphyseal red marrow has a higher prevalence in women between the ages of 40 and 60 years while no age prevalence appears to exist in men (Fig. 14.20). Other settings in which persistent or reconverted foci of red marrow have been recognized in the distal femoral metaphysis include young patients (under 39 years of age), marathon runners, heavy smokers (more than one pack per day), and obese women (>78 kg) who smoke (see section on Reconversion).62,63
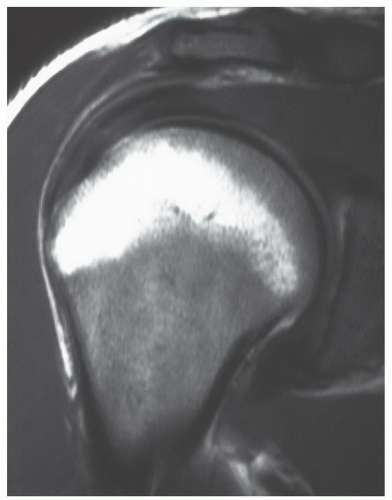 Figure 14.18 Normal red marrow in the proximal humeral epiphysis in a 22-year-old woman. An oblique coronal T1-weighted (SE 600/20) image of the shoulder demonstrates evidence of red marrow in subcortical locations of the proximal humeral epiphysis. This should be considered a normal finding when the red marrow displays expected signal intensities on T1- and T2-weighted images. |
In the proximal femur, age-related MR patterns of progressive conversion to fatty marrow have been reported (Fig. 14.21). These patterns can be monitored using a marrow conversion index.52,64 This index is based on a ratio of the measured T1 signal intensity of the greater trochanter to that of the proximal femoral metaphysis.64 Results indicate a linear association of the index with patient age; however, the value of this index in detecting disease is yet to be determined. Red to yellow conversion within the proximal metaphysis occurs first around the greater trochanter and
inferomedial to the femoral epiphysis. This is followed by fatty conversion in the region of Ward triangle (generally seen in middle-aged patients). The conversion process is relentless, leaving only small fractions of red marrow present in the proximal femoral metaphysis of older individuals. Similar to the proximal humeral epiphysis, non-fatty marrow can be identified in the proximal femoral epiphysis in normal individuals.25,61 Age parameters for this finding are not clearly established, but the prevalence is probably higher in younger individuals. Nevertheless, it can be encountered in middle-aged individuals. This cellular marrow should be subcortical in location with the central epiphyseal marrow cavity appearing predominately fatty (Fig. 14.22). Gender-related differences showing women as having larger areas of red marrow containing higher proportions of nonfat cells in the proximal femur have been described.25
inferomedial to the femoral epiphysis. This is followed by fatty conversion in the region of Ward triangle (generally seen in middle-aged patients). The conversion process is relentless, leaving only small fractions of red marrow present in the proximal femoral metaphysis of older individuals. Similar to the proximal humeral epiphysis, non-fatty marrow can be identified in the proximal femoral epiphysis in normal individuals.25,61 Age parameters for this finding are not clearly established, but the prevalence is probably higher in younger individuals. Nevertheless, it can be encountered in middle-aged individuals. This cellular marrow should be subcortical in location with the central epiphyseal marrow cavity appearing predominately fatty (Fig. 14.22). Gender-related differences showing women as having larger areas of red marrow containing higher proportions of nonfat cells in the proximal femur have been described.25
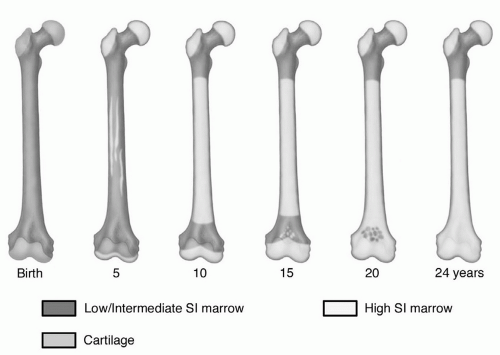 Figure 14.19 Age-related changes in the MR pattern of red/yellow marrow in the femur. On MRI, conversion of cellular to fatty marrow is observed earlier than on histologic studies (Fig. 14.1). The sequence of this conversion, however, appears to be similar between the two methods. Conversion to fatty marrow occurs first in the diaphysis and then progresses to the distal metaphysis followed by the proximal metaphysis. Note that the diaphysis displays a MR pattern of fatty marrow by 10 years of age. (From Moore SG, Dawson KL. Red and yellow marrow in the femur: Age-related changes in appearance at MR imaging. Radiology. 1990;175:219-223.) |
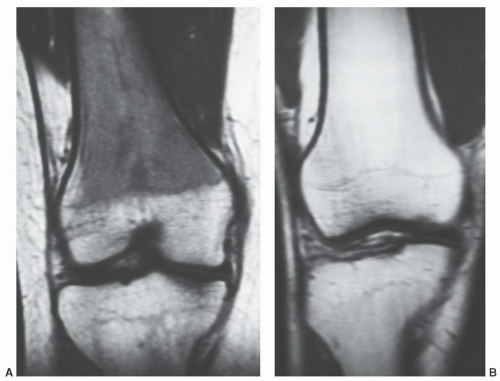 Figure 14.20 The spectrum of normal red/yellow patterns in the distal femoral metaphysis. Coronal T1-weighted (SE 600/20) images of the knee in an 18-year-old woman (A) and 65-year-old man (B) demonstrate the range of normal marrow signal patterns that can be encountered in the distal femoral metaphysis. These patterns reflect varying fractions of red and yellow marrow that can be present at this location. When the red marrow fraction is high (as generally occurs in younger patients), the MR appearance will resemble (A). If little or no red marrow is present (as generally seen in older patients), the MR appearance is more likely to resemble (B). |
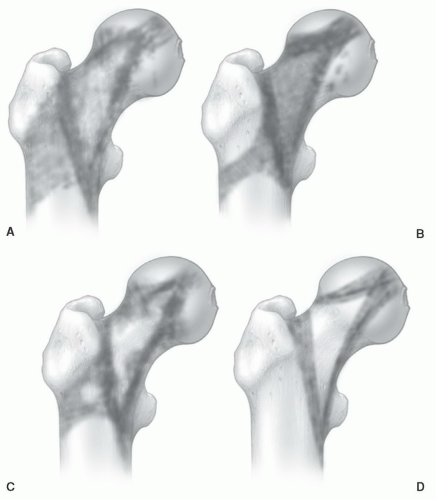 Figure 14.21 Age-related patterns of red/yellow marrow in the proximal femur based on MR studies. Conversion of red to yellow marrow occurs first in the inferomedial portion of the femoral neck and around the greater trochanter (A, B). With age, conversion is seen in the region of Ward triangle (C). The process of conversion continues to progress toward a uniform appearance of fatty marrow in some elderly patients (D). (From Ricci C, Cova M, Kang YS, et al. Normal age-related patterns of cellular and fatty bone marrow distribution in the axial skeleton: MR imaging study. Radiology. 1990;177:83-88.) |
Although generally viewed as displaying only yellow marrow signal patterns in the adult, foci of red marrow can be identified in the proximal tibial metaphysis in normal individuals. The settings and prevalence of this finding are similar to those described above for the distal femoral metaphysis; however, the prevalence of tibial hematopoietic marrow is lower in all settings, occurring in only approximately one-third of patients with distal femoral red marrow.62,63 When found in the proximal tibial metaphysis, hematopoietic marrow is also generally present in the distal femoral metaphysis. To find red marrow only in the proximal tibial metaphysis without a similar finding in the distal femur is so unusual that concern would be raised for an underlying marrow disorder. As in the distal femoral epiphysis, red marrow is not normally observed in the proximal tibial epiphysis on MR images.
In the bones of the feet, red marrow is converted to yellow marrow by 2 years of age. Expected MR signal patterns would be of homogeneous fatty marrow on all pulse sequences. Yet heterogeneous signal patterns have been observed in asymptomatic children with no known bone marrow disorders.65 The signal patterns consist of multiple small foci of low signal on T1-weighted images that show increased signal on T2-weighted and especially STIR sequences (Fig. 14.23). Confluent areas of high signal can also be present on the T2-weighted and STIR sequences. Of the bones in the feet, the calcaneus and talus are most frequently involved. The changes are bilateral
and symmetric in extent of involvement and degree of signal alteration. These heterogeneous signal changes are presumed to represent sites of marrow edema despite the lack of identifiable precipitating events. Their exact etiology, however, is unclear. Similar signal alterations have been observed in the feet and ankles of cross-country runners and also attributed to bone marrow edema.66 In the absence of any systemic illness, the above-described marrow signal alterations in the feet and ankles of children and runners should be considered normal variations. Concern should be raised if the extent of involvement is not symmetric or if signal patterns of involved sites differ from side to side.
and symmetric in extent of involvement and degree of signal alteration. These heterogeneous signal changes are presumed to represent sites of marrow edema despite the lack of identifiable precipitating events. Their exact etiology, however, is unclear. Similar signal alterations have been observed in the feet and ankles of cross-country runners and also attributed to bone marrow edema.66 In the absence of any systemic illness, the above-described marrow signal alterations in the feet and ankles of children and runners should be considered normal variations. Concern should be raised if the extent of involvement is not symmetric or if signal patterns of involved sites differ from side to side.
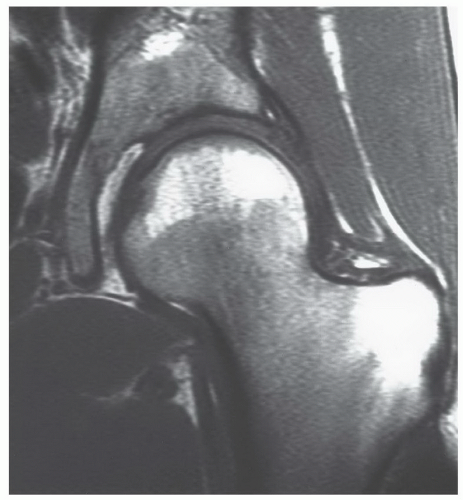 Figure 14.22 Normal red marrow in the proximal femoral epiphysis in a 29-year-old woman. Normal red marrow is identified in the proximal femoral epiphysis. Note that it is subcortical in location and that the central marrow cavity contains fatty marrow. Vertical, linear, low signal intensities in the central cavity of the epiphysis represent compressive trabeculae. |
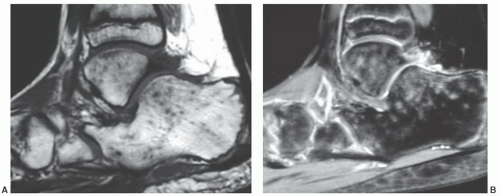 Figure 14.23 Normal variant of marrow signal intensity pattern in a 12-year-old boy. A: Multiple small foci of low signal intensity are seen scattered throughout the marrow of the tarsal bones on this sagittal T1-weighted image (SE 500/12). B: The foci display high signal intensity on a corresponding proton density image with fat saturation (FSE 2,900/20). This marrow pattern is now recognized as a normal variant in children and runners. The foci are believed to represent marrow edema although their etiology is unclear. |
Known anatomic features that alter these red/yellow marrow patterns in the extremities include local variations in trabecular bone content and remnants of the growth plate (physeal scar). At sites where trabecular bone is in abundance, the marrow will generally demonstrate slightly lower signal intensity on both long and short TR/TE sequences. This is most commonly encountered in the metaphyseal/epiphyseal regions of long bones. Likewise, load-bearing trabeculae that are thickened and more numerous produce bands of lower signal intensity in the marrow. Compressive and tensile trabeculae coursing through the femoral head and neck are good examples of this. The physeal scar appears as a thin, transverse band of low signal intensity on T1- and T2-weighted images. It is a constant finding at expected locations in the appendicular skeleton. Bone reinforcement lines, if thick enough, would be expected to produce a similar appearance.
The amount and distribution of red marrow is not identical among individuals. At the extremes, some individuals demonstrate virtually no red marrow in the femora or humeri, whereas others display large amounts. Most individuals fall somewhere between. Minor differences in the amount and distribution of red marrow from side to side are expected. However, marked asymmetry in an individual is unusual and warrants explanation. Likewise, the signal
intensity of red marrow, although variable among individuals, is roughly symmetric in the same individual.
intensity of red marrow, although variable among individuals, is roughly symmetric in the same individual.
TECHNICAL CONSIDERATIONS
In the MRevaluation of bone marrow and bone marrow disorders, the major technical considerations to be addressed are pulse sequences, slice parameters, imaging planes, contrast agents, and types of coils to be utilized.
The MR appearance of bone marrow varies greatly between pulse sequences. Numerous pulse sequences have beenandcontinue tobe developed, each with nuances aimed at improving some aspect of MRI. What role, if any, many of these will play in bone marrow evaluation is unclear. Spin-echo pulse sequences (both conventional and fast) with T1-and T2-weighted images have traditionally been the method utilized in MRI of marrow and, as such, much of the current knowledge about normal and abnormal bone marrow is based on these sequences.
Evaluating bone marrow with conventional and FSE pulse sequences usually requires both T1- and T2-weighted images. Repetition times utilized in obtaining these images need not be absolute but can vary depending on the anatomic region to be covered. Larger anatomic areas require longer repetition times. As a general guideline, however, the TR for a T1-weighted sequence should be kept below 700 ms and the TR for a T2-weighted sequence should exceed 2,000 ms. Accepted echo delays for T1-weighted images are less variable, generally less than 30 ms and preferably 20 ms. To achieve adequate T2-weighting, TEs of 80 ms or higher are necessary. Thus, utilizing these guidelines, a routine MR evaluation of bone marrow might include T1-weighted images using a TR of 500 ms and TE of 20 ms as well as T2-weighted images obtained with a TR of 2,000 ms and a TE of 80 ms. Studies obtained in this manner take advantage of many inherent marrow properties. On the T1-weighted images, contrast is predominately a function of T1 relaxation time. Due to the short T1 of lipid, the signal from fatty marrow is optimized (Fig. 14.24). Tissues containing lesser amounts of fat or having longer T1 relaxation times become conspicuous against the background of high-signal fatty marrow. Thus, bone, red marrow, muscle, and most pathologic processes can be readily identified. T1-weighted images also provide excellent anatomic detail.
On conventional spin-echo T2-weighted images, contrast predominately reflects differences in T2 relaxation times (Fig. 14.24). With progressive T2-weighting, the signal intensity of red marrow slowly increases while that of yellow marrow slowly declines making it more difficult to discriminate between the two. Because many pathologic processes have very long T2 relaxation times (greatly exceeding those of red and yellow marrow), they are conspicuous in the marrow. Difficulty arises, however, when an insufficiently T2-weighted pulse sequence is utilized. Narrowing the T2 contrast difference between a pathologic process and normal marrow makes the pathologic process less conspicuous. Adding fat-saturation to T2-weighted images significantly increases lesion detection and should be incorporated into bone marrow MR studies when available.
Fast spin-echo techniques are being used with increased frequency in all areas of MRI. The main advantage of these pulse sequences is shorter imaging time. On FSE T2-weighted images, fat (including fatty marrow) remains high in signal intensity potentially obscuring marrow disease. Incorporating fat saturation with T2-weighted FSE sequences overcomes this potential pitfall. On MR units where fat saturation is not possible, inversion recovery sequences should be considered.
A particular form of the inversion recovery pulse sequence, STIR, can also improve lesion detection. In this specialized pulse sequence, the signal from fat is nulled making it appear dark on the images (Fig. 14.24).67,68 Tissues having T1 or T2 relaxation values that differ from fat will have greater signal intensity than fat. In fact, due to the nature of inversion recovery sequences, T1 and T2 values are additive making STIR imaging perhaps the most sensitive of all pulse sequences for detecting marrow abnormalities. Limitations of this sequence include lesser anatomic definition than T1-weighted spin-echo images secondary to the loss of fat signal, restrictions in the size of the anatomic region that can be covered, and long scan times. Some of these limitations can be overcome by the use of inversion recovery (IR) FSE pulse sequences. These pulse sequences can be obtained at short scan times (comparable to T1-weighted spin-echo) and allow for greater anatomic coverage. Lesion conspicuity is high but anatomic definition remains limited.
Gradient-echo pulse sequences provide an alternative to STIR and T2-weighted spin-echo sequences, yet at much shorter scan times (Fig. 14.24).69 Numerous GRE sequences exist (GRASS, FLASH, FISP, etc.). All are based on the generation of a GRE rather than the classic 180° refocusing pulse used in spin-echo pulse sequences. The flip angle (theta) can be kept small in GRE pulse sequences enabling substantial reduction inimaging time. Contrast in these pulse sequences is a function of many different factors including T1, T2, T2*, TR, TE, and theta.33,70 These sequences are very sensitive to field inhomogeneities and chemical shift and susceptibility effects. By varying TR, TE, and theta, the contrast between marrow and most pathologic processes can be increased. Gradient-echo sequences do not suffer the same restrictions in anatomic detail and amount of anatomic coverage as do STIR sequences.
Clinical studies comparing lesion conspicuity on different pulse sequences generally identify STIR or IR-FSE techniques as being superior in this regard.71,72 Adding fat saturation to T2-weighted sequences (conventional, FSE, or GRE) improves lesion detection in these settings.
Chemical shift imaging may improve lesion detection and red/yellow marrow discrimination on spin-echo and gradient-echo (GRE) sequences.73 These forms of imaging are based on the differing precession rates or resonant
frequencies of fat and water protons in biologic tissue— about 3.5 ppm or 75 to 220 Hz for scanners operating in the range of 0.5 to 1.5 T. Using chemical shift techniques like the one described by Dixon,74 fat and water molecules present in the same voxel will cancel, producing no net signal in the respective pixel. Thus, when tissues containing excess water (most pathologic processes) occur in fatty marrow, a dark interface appears along the perimeter making that tissue more conspicuous. Red marrow, due to its higher water content, is also more conspicuous. Some chemical shift sequences allow for selective fat or water images. Use of these sequences shows initial promise in predicting whether bone marrow signal abnormalities result from neoplastic or nonneoplastic causes.75
frequencies of fat and water protons in biologic tissue— about 3.5 ppm or 75 to 220 Hz for scanners operating in the range of 0.5 to 1.5 T. Using chemical shift techniques like the one described by Dixon,74 fat and water molecules present in the same voxel will cancel, producing no net signal in the respective pixel. Thus, when tissues containing excess water (most pathologic processes) occur in fatty marrow, a dark interface appears along the perimeter making that tissue more conspicuous. Red marrow, due to its higher water content, is also more conspicuous. Some chemical shift sequences allow for selective fat or water images. Use of these sequences shows initial promise in predicting whether bone marrow signal abnormalities result from neoplastic or nonneoplastic causes.75
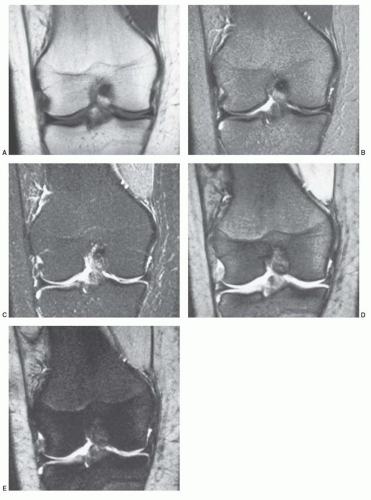 Figure 14.24 Appearance of bone marrow on different pulse sequences. Coronal images of the right knee are obtained utilizing different pulse sequences to demonstrate the variable appearance of bone marrow with changing scanning parameters. (All images obtained at field strength of 1.5 T). A: Spin-echo, T1-weighted image (TR, 500; TE, 20). Bone marrow in the distal femur and proximal tibia is roughly isointense with subcutaneous fat. This is the expected appearance of fatty marrow on T1-weighted images. B: Spin-echo, T2-weighted image (TR, 2,000; TE, 60). With increasing repetition times and echo delays, the signal intensity of fatty marrow declines as does that of subcutaneous fat. C: STIR (TR, 1,500; TE, 30; TI, 140). Since the signal of fat is nulled on STIR images, fatty marrow will appear dark. D: Gradient-recalled steady state (GRASS) (TR, 700; TE, 31; flip angle 25°). Gradient-echo (GRE) sequences at low flip angles (theta) tend to accentuate T2 characteristics of tissues and fluids. Note that the fatty marrow is not as bright as on the T1-weighted image (A) and the synovial fluid displays increased signal intensity. E: GRASS (TR, 700; TE, 31; flip angle 25°). Many factors contribute to signal intensity on GRE sequences. Susceptibility effects and field inhomogeneities may in part account for the marked decrease in fatty marrow signal on this image. |
Diffusion-weighted MRI (DWI) is based upon the concept of Brownian motion of water molecules (protons) and upon the premise that conditions exist under which free motion of the molecules may be restricted. The net motion of these molecules may be observed at the microscopic level, and the Brownian motion restriction occurs secondary to barriers created by the anatomic organization of cells and tissues. While several different pulse sequence strategies can produce diffusion-weighted images (each with a particular advantage), the general results of the sequence strategies are the same: The greater the freedom of proton motion, the lower the signal intensity. Conversely, the more restricted proton motion becomes, the higher the resultant signal intensity is. Due to technical complexities within and among the various sequences, and due to overlap in qualitative features of different pathologic conditions on diffusion-weighted images, apparent diffusion coefficient (ADC) values and maps have been developed to improve the accuracy and precision of diffusion-weighted assessment of tissues and pathologic conditions.76,77,78
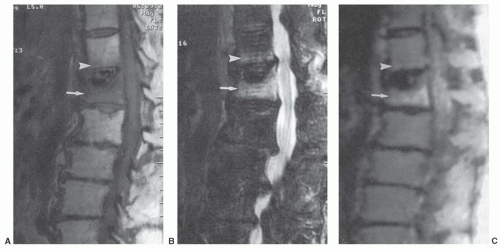 Figure 14.25 T12 and L1 acute osteoporotic compression fractures. A: Sagittal T1-weighted image (FSE 600/8) image of lumbar spine shows a faint band of decreased signal intensity along the inferior end plate of T12 vertebral body (arrowhead) and a general decreased signal intensity of the partially collapsed L1 body (arrow). B: Sagittal fat-saturated T2-weighted image (FSE 3000/99) shows matching increased signal intensity of T12 inferior end plate (arrowhead) and L1 vertebral body (arrow). C: Sagittal diffusion-weighted image (5000/96.4) shows increased intensity of the T12 endplate (arrowhead) and the L1 compression fracture (arrow). The mean ADC value of the L1 compression fracture is 2.8 × 10⁻⁴ mm2/s. (Adapted from Zhou XJ, Leeds NE, Mc Kinnon GS, et al. Characterization of benign and metastatic vertebral compression fractures with quantitative diffusion MR imaging. Am J Neuroradiol. 2002;23:165-170.) |
Diffusion-weighted imaging is now a routine part of MRI in neuroradiology, particularly for evaluation of patients with suspected stroke. The method is dependably sensitive to the presence of brain infarction in the acute setting, and permits differentiation of recent stroke from chronic infarction. The technique is also routinely applied in demyelinating conditions and in the differential diagnosis of spinal cord conditions. In contrast to the general acceptance of DWI in brain and spinal cord assessment, it has not yet become a routine part of bone marrow imaging.
The primary application of DWI in musculoskeletal imaging has been the attempt to differentiate benign vertebral body compression fractures associated with bone demineralization from pathological vertebral body compression fractures caused by metastases.79,80,81,82 DWI characteristics of normal vertebral bone marrow have not been fully described
for the spectrum of normal marrow composition; however, it is known that diffusion properties of bone marrow are dependent upon the balance of the fat and hematopoietic cell fractions. In uncomplicated benign vertebral body compression fractures, bone marrow edema and hemorrhage increase the fraction of interstitial water locally, thus increasing the ADC value and resulting in decreased signal intensity on diffusion-weighted images. However, involved vertebral segments may be hypointense, isointense, or hyperintense as compared with uninvolved adjacent vertebrae (Fig 14.25). In straightforward, malignant vertebral body compression fractures, the highly packed malignant cells locally restrict proton diffusion, thereby lowering the ADC and increasing the signal intensity. Likewise, involved vertebrae may be hypointense, isointense, or hyperintense as compared with adjacent vertebrae (Fig. 14.26). Most literature concerning this subject is based upon small numbers of well-characterized patients with few outliers. Larger experience shows that overlap in signal intensity behavior exists between benign and malignant compression fractures due to a series (combination) of factors including variable background marrow composition, age of fractures, cellular density of metastases, mineral content of metastases, and/or response of metastases to chemotherapy or radiotherapy as examples. Therefore, DWI is imperfect for confident differentiation of benign from malignant vertebral body compression fractures. While quantitation by means of ADC value and mapping improves separation of benign and malignant vertebral fractures, the separation remains imperfect (Fig. 14.27).
for the spectrum of normal marrow composition; however, it is known that diffusion properties of bone marrow are dependent upon the balance of the fat and hematopoietic cell fractions. In uncomplicated benign vertebral body compression fractures, bone marrow edema and hemorrhage increase the fraction of interstitial water locally, thus increasing the ADC value and resulting in decreased signal intensity on diffusion-weighted images. However, involved vertebral segments may be hypointense, isointense, or hyperintense as compared with uninvolved adjacent vertebrae (Fig 14.25). In straightforward, malignant vertebral body compression fractures, the highly packed malignant cells locally restrict proton diffusion, thereby lowering the ADC and increasing the signal intensity. Likewise, involved vertebrae may be hypointense, isointense, or hyperintense as compared with adjacent vertebrae (Fig. 14.26). Most literature concerning this subject is based upon small numbers of well-characterized patients with few outliers. Larger experience shows that overlap in signal intensity behavior exists between benign and malignant compression fractures due to a series (combination) of factors including variable background marrow composition, age of fractures, cellular density of metastases, mineral content of metastases, and/or response of metastases to chemotherapy or radiotherapy as examples. Therefore, DWI is imperfect for confident differentiation of benign from malignant vertebral body compression fractures. While quantitation by means of ADC value and mapping improves separation of benign and malignant vertebral fractures, the separation remains imperfect (Fig. 14.27).
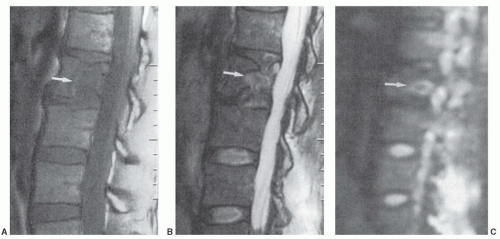 Figure 14.26 L2 metastasis with compression fracture. A: Sagittal T1-weighted image (FSE 650/12) of lumbar spine shows low signal intensity metastasis (arrow). B: Sagittal fat-saturated T2-weighted image (FSE 3000/99) shows heterogeneous increased signal intensity within the metastasis. C: Sagittal diffusion-weighted image (FSE 5000/96.4) shows increased signal intensity within the metastasis. The mean ADC value of the metastasis was 1.7 × 10⁻⁴ mm2/s, a lower value than that documented in the osteoporotic compression fracture illustrated in Figure 14.25. (Adapted from Zhou XJ, et al. Characterization of benign and metastatic vertebral compression fractures with quantitative diffusion MR imaging. Am J Neuroradiol. 2002;23:165-170.) |
Thus, excellent radiological skills are required to integrate clinical history and anatomic morphologic features
with signal intensity information from multiple pulse sequences applied across the tissue adjacencies to arrive at the proper categorization. Other applications of DWI in bone marrow have not matured beyond initial observations.
with signal intensity information from multiple pulse sequences applied across the tissue adjacencies to arrive at the proper categorization. Other applications of DWI in bone marrow have not matured beyond initial observations.
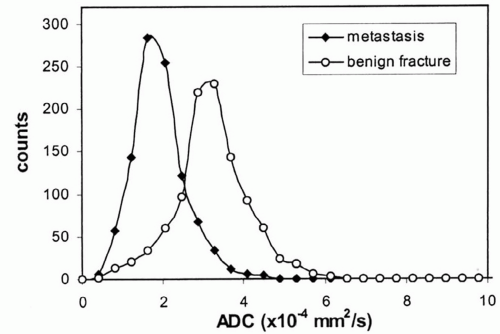 Figure 14.27 Histograms of ADC values determined for 12 benign (circles) and 15 metastatic (diamonds) vertebral compression fractures. The ADC values for adjacent uninvolved vertebral bodies were 2.7-3.7 × 10⁻⁴ mm2/s. Considerable overlap exists in ADC values for normal and compressed vertebrae. (Reproduced from Zhou XJ, et al. Characterization of benign and metastatic vertebral compression fractures with quantitative diffusion MR imaging. Am J Neuroradiol. 2002;23:165-170.) |
Techniques aimed at quantifying bone marrow cellularity have been identified, including chemical-shift misregistration, parametric MRI, and H-1 localized spectroscopy.10,83,84,85,86,87,88 These techniques show good correlation with histomorphometric data in small numbers of patients and may potentially be beneficial in monitoring some marrow disorders. Quantification of the fat component of bone marrow is now possible and could provide insight into the changing fractions of red and yellow marrow in health and disease.10 Currently, however, these methods have not been validated in large clinical studies and their future role remains unclear.
To date, MR contrast agents (e.g., gadolinium) have not developed a defined utility in evaluation of diffuse marrow disease. These agents hold promise for demonstration of marrow involvement by neoplastic processes in certain settings and may improve the specificity of MR for separation of benign from malignant disorders. Dynamic gadolinium-enhanced MRI using fast scan techniques (turbo FLASH, FSE, GRASS, etc.) has shown promise in this regard.89,90 These techniques provide heavy T1 weighting and high temporal resolution. This is of particular importance in evaluating marrow enhancement, which reaches its maximum within the first minute after bolus injection. With this added capability, the potential for separating hematopoietic marrow from pathologic conditions is improved. The decision to use contrast agents is influenced by clinical parameters and findings on initial non-contrast images.
Size of the anatomic region to be evaluated influences many of the MR scanning parameters, including surface coil selection, slice thickness, and interslice gap. Smaller anatomic regions may be better imaged with surface coils, whereas larger regions require body coils. Comparison with the contralateral extremity is generally desirable, necessitating use of a body coil. Slice thicknesses on the order of 3 to 5 mm with no interslice gap usually provide the resolution necessary in small anatomic areas. However, 5-mm slices with 5- to 10-mm gaps are often needed to cover larger regions. Signal-to-noise considerations also influence slice thickness and interslice gap in addition to matrix size and number of excitations (NEX). Generally, matrices on the order of 192 × 256 with two excitations provide adequate signal-to-noise for evaluating large anatomic regions.
Clinical settings that account for the majority of MR examinations for diffuse marrow disease include: (i) a problem-solving study to define further the abnormalities encountered on other radiologic procedures or other MR exams; (ii) a screening study of the marrow to detect involvement by processes (e.g., myeloma) not readily imaged with other modalities; (iii) a screening study of the marrow to identify early metastatic disease not detectable by other modalities; (iv) a follow-up study for assessment of response to therapy; and (v) a guidance study to localize potential sites for biopsy.
The sensitivity of MR for detection of marrow abnormalities indicates a potential role for this modality in the initial staging of certain tumors likely to metastasize to bone (breast, prostate, and lung) or to have large marrow tumor burdens (myeloma). MR examinations may be tailored in each of these situations when it is not feasible to image the entirety of an individual’s bone marrow. Thus, any screening protocol should be directed at evaluation of skeletal sites where the likelihood of involvement is highest. In adults, this would mean evaluation of the axial skeleton because most diffuse marrow disorders tend to follow the distribution of red marrow. Thus, surveys of the spine are now common. Imaging of marrow in the ribs and skull is limited due to the size and shape of these bones. Time and cost limitations usually prohibit comprehensive evaluation of all at-risk sites. As a reasonable compromise, limitation of the evaluation to the pelvis (including proximal femora) and the lumbar spine (including portions of the lower thoracic spine) is a common strategy. The study should include T1-weighted images and STIR, or fat-saturated T2-weighted images. Addition of non-dynamic or dynamic gadolinium-enhanced sequences may be reasonable based on the clinical situation and the appearance of the non-contrast portion of the study.
Whole-body MRI is emerging as a possible imaging method for routine determination of the bone marrow distribution of metastases91,92,93,94,95,96 and multiple myeloma.97,98 Generally, 1.5 Tesla systems are programmed for a multistation technique with the scanner table moving between anatomic regions to place successive regions of interest in the center of the magnet. Five to seven stations are imaged, sometimes using a table extender. Image sets are anatomically matched to produce a continuous whole-body image (Fig. 14.28). Commonly, the survey is performed in the coronal plane with a fat-suppressed turbo inversion recovery magnitude sequence or a STIR sequence followed by a sagittal series of the spine (T2-weighted turbo spin echo) with additional T1-weighted or STIR axial images of areas of interest. In addition to these sequences, steady-state free precession imaging, fast spoiled gradient-echo, diffusion-weighted, and fast Dixon-based techniques have been tested. Sequences are performed with a combination of body and phased array coils. Often, no intravenous contrast agent is administered. Whole-body MRI examinations typically average more than 1 hour to complete.
Although whole-body bone marrow MRI has not yet been widely adopted, it has been shown to be sensitive for detection of marrow replacement by metastases and myeloma. Whole-body MRI may have higher sensitivity and accuracy than conventional bone scintigraphy (except in the skull) or CT alone. In general, whole-body MRI and whole-body PET/CT have provided similar results for detection of metastases and myeloma, with each showing a small advantage in a few instances. Whole-body MRI effectively identifies non-skeletal tumor-related abnormalities. With
additional technical enhancements that preserve tissue differentiation characteristics and reduce imaging duration, whole-body MRI may gain acceptance as a method to survey the skeleton for its burden of metastasis or myeloma. For acceptance to occur, a limited set of pulse sequences must be validated, lesion conspicuity must be optimized, cell viability must be understood in the context of treatment, and examination duration must be tolerable for patients.
additional technical enhancements that preserve tissue differentiation characteristics and reduce imaging duration, whole-body MRI may gain acceptance as a method to survey the skeleton for its burden of metastasis or myeloma. For acceptance to occur, a limited set of pulse sequences must be validated, lesion conspicuity must be optimized, cell viability must be understood in the context of treatment, and examination duration must be tolerable for patients.
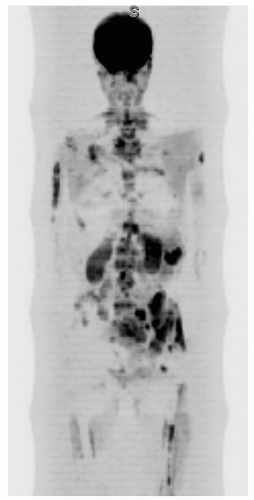 Figure 14.28 Multifocal breast cancer metastases depicted by diffusion-weighted whole-body imaging of a 53-year-old woman. The anterior maximum intensity projection view is composed of five anatomic acquisitions acquired in the coronal plane seamlessly tiled together and displayed with inverse gray scale to increase lesion conspicuity. Bone metastases are evident in many vertebrae, the pelvis and the bilateral humeri, and femora. Absence of signal in the proximal femora is due to presence of metallic internal fixation devices. |
DIFFUSE MARROW DISORDERS
Bone marrow responds to insult and disease through a select number of mechanisms.27 These pathophysiologic responses can be identified and categorized on MR images. The concept provides a useful means of grouping the various disorders that affect marrow and for understanding associated marrow signal patterns. Five pathophysiological mechanisms are considered. First is reconversion wherein the normal pathophysiologic process of converting red marrow to yellow marrow is reversed such that yellow marrow is “reconverted” to red marrow. Red marrow hyperplasia is a subcategory of this mechanism. The second is myeloid depletion in which all marrow cells other than fat are destroyed or disappear. In the third, ischemia, all marrow elements die and are repaired to a greater or lesser degree. Infiltration, the fourth process, is when pathologic cells invade normal marrow. And finally, the fifth process is marrow edema, wherein excess water appears in the marrow tissue.
An alternative classification system has been proposed.99 In this system T1-weighted images are used to classify marrow disorders into four patterns: Marrow depletion, infiltration, replacement, and signal void. These four patterns can be observed alone or together in a focal, regional, or diffuse skeletal distribution. Marrow disorders are then grouped according to their typical MR signal characteristics and distribution.
In this chapter, marrow disorders will be classified by their pathophysiologic mechanism (reconversion, depletion, ischemia, infiltration, and edema). This conceptualized categorization is imperfect but provides a useful framework for discussion.
Reconversion
When the demand for hematopoiesis exceeds the ability of existing red marrow to meet the required level of cell production, a process is initiated whereby a portion of yellow marrow is reconverted to red marrow. The reconversion sequence is the reverse of normal red to yellow marrow conversion. Reconversion is initiated in the axial skeleton and then progresses toward the distal appendicular skeleton in a proximal to distal pattern. Thus, in a given individual, if reconversion is encountered in the appendicular skeleton, then it should be evident, often to a greater degree, in the axial skeleton. Within individual bones, the process begins in the subcortical marrow of proximal metaphyses or metaphyseal equivalents. It then progresses centrally into the marrow cavity while at the same time moving toward diaphyses and epiphyses or epiphyseal equivalents. Generally, reconversion will become evident in distal metaphyses of long bones before it has been completed in the diaphyses. Pathologically, capillary proliferation and sinusoid formation in the subendosteal portions of the fatty marrow100 herald the process. A greater blood supply is required to sustain red marrow than yellow marrow.
The process of reconversion is generally symmetric throughout the skeleton, although not necessarily uniform in any particular bone. The extent of reconversion depends on the intensity and duration of the stimulus. Mild cases may show only selective hyperplasia of axial marrow and proximal appendicular sites, while in extreme cases, involvement may be evident in distal appendicular regions.
Causes of reconversion and red marrow hyperplasia vary and span a spectrum of diverse disorders from specific disease processes to lifestyle factors. Chronic anemias (sickle cell, thalassemia, etc.), chronic infection, cyanotic heart disease, marrow replacement disorders (metastatic disease, etc.), and myeloproliferative conditions (myeloma, leukemia) are among the processes that may incite this phenomenon. In hematopoietic conditions, the severity and chronicity of the stimulus (i.e., anemia, infection, and hypoxia) will determine the extent of reconversion and/or the degree of persistent red marrow hyperplasia. In patients with sickle cell disorders, the amount of productive marrow volume lost due to osteonecrosis also influences the distribution and degree of reconversion. In a similar fashion, metastases and myeloproliferative disorders cause reconversion of more distal marrow space because hematopoietic capacity in proximal marrow is replaced by pathologic cells. Since neoplastic disorders generally follow the distribution of red marrow (involving the axial skeleton before appendicular sites), identification of hyperplastic red marrow in the extremities of a person with a known neoplastic condition is an ominous sign suggesting extensive replacement of axial marrow by tumor. Extensive appendicular reconversion to red marrow is not common, however, and care must be taken when trying to diagnose reconversion on the basis of MRI. To date, there is no reliable means of differentiating reconverted or hyperplastic marrow from other marrow infiltrative disorders. In most cases, bone marrow biopsy is the only reliable method of confirmation.
The MR appearance and diagnostic criteria for determination of reconversion are not firmly established and, as such, the process is probably underdiagnosed. MR images of patients in whom the process of reconversion is operative, display findings indicative of an expanded red marrow fraction.36 The signal intensity of hyperplastic marrow at any particular location is dependent upon the degree of hyperplasia (cellularity). On short TR/TE sequences, involved sites display decreased marrowsignal intensity (Fig. 14.29), whereas on longer TR/TE and STIR images the signal intensity increases relative to that of fatty marrow. Actual signal intensity observed is influenced by the degree of cellularity, the amount of water residing in the red marrow, and the scanning parameters chosen. When extensive red marrow hyperplasia is present, its signal intensity on T1-weighted images can be equal to or slightly lower than that of muscle (Fig. 14.30). On T2-weighted images, the signal intensity of hyperplastic marrow can exceed the signal intensity of fatty marrow; fat saturation will emphasize the water content of the hyperplastic red marrow fraction. The process of reconversion involves individual bones to varying degrees, producing a spectrum of MR appearances. In early or mild cases, islands of regenerating red marrow are scattered throughout the marrow space producing a “spotty” or geographic appearance, whereas in severe cases, diffuse and homogeneous involvement of the entire marrow compartment is observed.
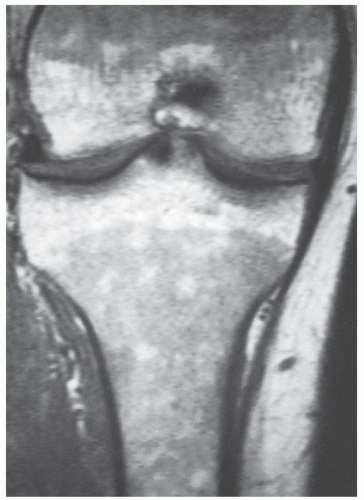 Figure 14.29 Reconversion/persistent red marrow hyperplasia in anemia in a 20-year-old man. A coronal, T1-weighted image (SE 600/17) of the right knee illustrates many features of the reconversion process in a patient with anemia (believed to be alpha thalassemia minor). The fatty marrow that is typically present in the distal femur and proximal tibia of a patient this age has been largely reconverted to (or persists from childhood as) hematopoietic marrow. The large fraction of red marrow present in the distal femur and proximal tibia is evidenced by decreased overall marrow signal intensity at these sites (compared to the normal pattern in Fig. 14.14). Note that there has even been some reconversion of yellow marrow to red marrow in the epiphyses. |
In a select number of disorders, the combination of two unique MR signal patterns allows for a short list of differential considerations. MR signal patterns associated with reconversion along with marrow hemosiderosis identify chronic hemolytic anemias,101 a history of multiple blood transfusions (Fig. 14.31), acquired immunodeficiency syndrome (AIDS),102,103 Gaucher,104 or myelofibrosis105 as the most likely etiologies. Expected MR signal changes include red marrow distribution patterns like those described above for reconversion along with diffuse lowering of red marrow signal intensity on T1-weighted images and greater lowering of signal intensity on T2-weighted images (susceptibility changes) resulting from hemosiderin in the marrow cavity.
Some patients without known bone marrow disorders can display evidence of expanded red marrow fractions in the axial and appendicular skeleton.48,63,106 This has been called hematopoietic hyperplasia.63 The term is gaining
usage in describing situations where increased red marrow presence is observed in otherwise normal individuals. Sites where this phenomenon has been reported include the spine and knee (Fig. 14.32), however, it probably occurs at many other locations yet to be specified. This focal red marrow presence is now recognized as physiologic in certain groups of patients. Among these are marathon runners, heavy smokers (more than one pack/day), obese women who smoke, and patients under the age of 39 years.63,106 This finding is also associated with menstruation and living at high altitudes. There probably are other unrecognized settings where this phenomenon occurs. Depleted
iron reserves and stimulation of red blood cell production caused by anemia, tissue hypoxia, elevated erythropoietin levels, and reticulocyte count are speculated reasons for this finding in most instances. The frequency of observed hematopoietic hyperplasia in endurance athletes is approximately 40%.48,63
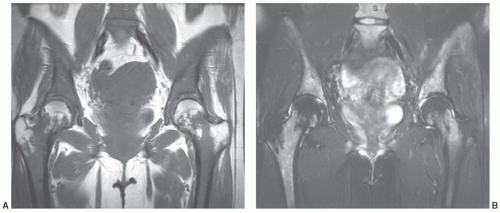 Figure 14.30 Red marrow hyperplasia in a 23-year-old woman with rebound hyperplastic marrow following treatment for leukemia. Bone marrow biopsy demonstrated a 90% hypercellular marrow without leukemia. A: Coronal T1-weighted image (FSE 416/37) of the pelvis shows diffuse low signal intensity hyperplastic marrow throughout the lower lumbar spine, innominate bones, and greater trochanters bilaterally. B: Coronal fat-saturated T2-weighted image (FSE 4000/90) emphasizes the water content of the hyperplastic red marrow as high signal intensity. |
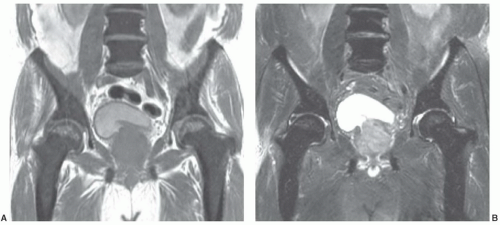 Figure 14.31 Bone marrow hemosiderosis in a 74-year-old man with long-term myelodysplastic syndrome and leukemia whose treatment included hundreds of blood transfusions resulting in dramatic iron deposition throughout his bone marrow manifested as profound T2 shortening. A: Coronal T1-weighted image (FSE 550/9) of the pelvis shows very low signal intensity bone marrow (much darker than surrounding muscle). B: Coronal fat-saturated T2-weighted (FSE 4350/84) image confirms the dramatic T2 shortening effect. |
Related posts:

Stay updated, free articles. Join our Telegram channel

Full access? Get Clinical Tree


