Overview of Special Imaging Studies
ROBERT A. CHRISTMAN AND JOHN TASSONE JR
Special imaging studies have proven quite valuable for the evaluation of certain foot pathologies. Most important are bone scintigraphy, computed tomography (CT), and magnetic resonance imaging (MRI). Ultrasonography is increasingly being used. Stress ankle and contrast studies, such as arthrography and tenography, play a minor role. Other procedures, including magnification radiography and low-kilovoltage radiography, show some usefulness; however, they are rarely used in practice. Special imaging studies can be divided into six categories as follows: stress studies, contrast studies, nuclear medicine studies, cellular and molecular imaging (CMI) studies, cross-sectional imaging studies, and miscellaneous studies (Box 24-1). In almost all instances, radiography of the area in question is performed before a special imaging study.
It is necessary not only to fully understand the indications for each special imaging study but also to be knowledgeable as to what is involved and how each study is performed. The practitioner who orders an adjunctive imaging study must educate patients about the prescribed modality to alleviate any fears or apprehensions that they might experience before and during the procedure. The following provides an overview of special imaging studies applicable to foot and ankle disorders.
STRESS STUDIES
Sprains and strains of the ankle are common. The lateral ligaments, especially the anterior talofibular and calcaneofibular ligaments, are frequently injured. Radiography alone yields little or no information regarding the status of these structures.1 Stress studies of the ankle are performed to assess the integrity of the lateral and medial ankle ligaments. They should be performed on both extremities, the uninjured limb serving as a “normal” comparison.
All stress studies are properly performed non–weight bearing, on a radiography examination table. The usual technique requires one experienced radiographer (or the ordering practitioner)2 to physically hold the extremity in position during the exposure and a second radiographer to push the exposure control button. The former must wear a lead apron and gloves. However, inconsistent results can occur when performing stress studies manually. For example, unequal stress may inadvertently be applied to one limb and not to the other, resulting in asymmetric radiographic findings. Furthermore, the patient’s extremity may not be positioned properly. Finally, patient guarding from pain or muscle spasm may prevent adequate performance of the stress study; in these cases, infiltration of local anesthetic or a nerve block may help.
The preceding variables can be better controlled by using a mechanical apparatus specifically designed to measure the stress applied to the extremity.3 The Telos ankle stress apparatus (Telos Medical and Hospital Supplies GmbH, Hungen, Germany) can be used to perform inversion, eversion, and lateral stress studies (Figure 24-1). It can also test the integrity of the dorsolateral calcaneocuboid ligament and, with attachments, assess the syndesmosis and the talocalcaneal joint. Measurements for anterior talar drawer, talar tilt, and the calcaneocuboid distance on stress radiographs using the Telos device have been considered reliable for the evaluation of radiographic ankle and calcaneocuboid instability.4 The extremity is firmly held in place, and constant torque can be applied and measured so that the study is performed symmetrically bilaterally. Gradual application of the stress force minimizes pain and muscle guarding.3 Another important feature of this unit: The examiner does not need to hold the extremity during the exposure and can leave the room; this also alleviates the need for a second radiographer. To avoid technical errors, care is necessary during positioning of the extremity in the Telos unit. The image receptor lies on the table beneath the ankle.
BOX 24-1 Special Studies Applicable to the Foot and Ankle
STRESS STUDIES (ANKLE)
Inversion stress
Eversion stress
Anterior stress
CONTRAST STUDIES
Arthrography
Tenography
Sinography, bursography, gangliography
Angiography
NUCLEAR MEDICINE
Technetium scan
Gallium scan
Indium scan
CELLULAR AND MOLECULAR IMAGING
Positron emission tomography
Single-photon emission computer tomography
CROSS-SECTIONAL IMAGING
Conventional tomography
Computed tomography
Magnetic resonance imaging
MISCELLANEOUS PROCEDURES
Magnification radiography
Ultrasonography
Fluoroscopy
Low-kilovoltage radiography
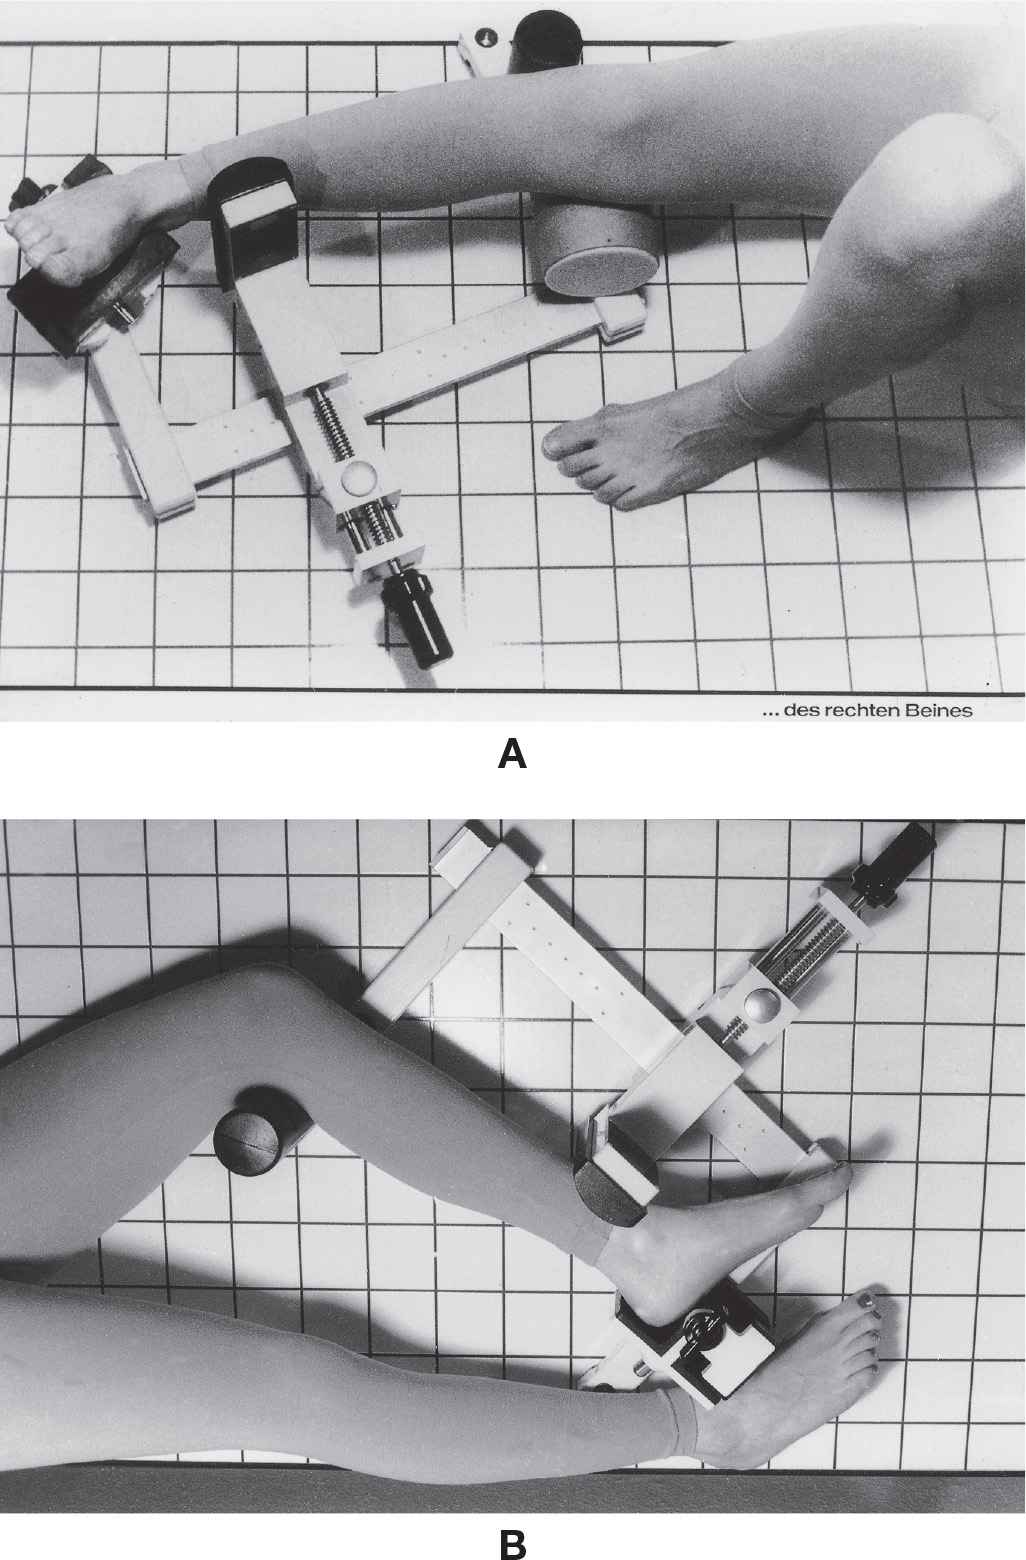
FIGURE 24-1. Ankle-positioning device, Telos ankle stress apparatus. A: Stress inversion test; B: anterior stress test. (Courtesy of Austin & Associates, Inc., Fallston, MD.)
The stress study can thus be (1) performed uniformly bilaterally, (2) reproducibly performed on the same patient at a later date, and (3) made comparable among different patients with an ankle stress apparatus. The apparatus also eliminates exposure to the radiographer, facilitates reproducible patient positioning, and gradually applies stress in an attempt to reduce guarding by the patient.5 Sauser and associates5 also found, however, that even with a stress apparatus, stress radiography did not have the diagnostic accuracy of arthrography performed within 72 hours of the injury. Nevertheless, stress studies are useful for the examination of chronic ankle instability.6
Inversion Stress Study
The inversion stress study examines the integrity of the anterior talofibular and lateral calcaneofibular ligaments. The extremity is positioned as an anteroposterior (AP) ankle projection. If the inversion stress study is performed manually (i.e., without the assistance of a stress apparatus), the radiographer stands facing the medial side of the extremity to be examined. The hand that is closer to the foot cups the heel, and the other hand is placed along the distal leg with elbow extended and locked. The radiographer must be careful to position his or her hands so that the lead gloves are not superimposed on the ankle joint. With the foot held perpendicular to the leg, the heel is forcibly inverted while the opposite hand braces the leg. (Perpendicular positioning of the ankle joint primarily stresses the calcaneofibular ligament; the anterior talofibular ligament contributes more in plantarflexion.)7 The second radiographer is then signaled to push the exposure button, while the first radiographer holds the extremity steady in the stress position.
Radiographically, lines are drawn across the tibial and talar articular surfaces. In a “normal” AP ankle view, these two lines are parallel or nearly parallel to one another (Figure 24-2A). A positive (or abnormal) inversion stress study is depicted by a “tilt” of the talar dome relative to the tibial plafond (Figure 24-2B).
Controversy exists concerning the degree of inversion talar tilt that should be considered “abnormal.” Rubin and Witten8 have shown that talar tilts of up to 23 degrees may be seen in an unaffected ankle. However, Cox and Hewes9 concluded that a talar tilt greater than 5 degrees would signify injury to the lateral ligaments. Generally speaking, a positive talar tilt is suggested if the measured angulation is greater than 10 degrees10 or if the talar tilt of the affected ankle is 5 degrees or greater than that of the opposite normal ankle.11 Talar tilt can also increase if the foot is plantarflexed from perpendicular at the ankle joint. In contrast, talar tilt may be lower than expected because of muscle spasm or patient guarding if prior local anesthetic or nerve block is not applied.
Eversion Stress Study
The eversion stress study investigates the status of the deltoid ligament. The extremity is positioned as it would be for the AP ankle projection. The radiographer stands facing the lateral side of the extremity for the manual eversion stress study. The hand that is closer to the foot cups the heel, and the other hand is placed along the distal leg with the elbow extended and locked. The radiographer must be careful to position his or her hands so that the lead gloves are not superimposed on the ankle joint. With the foot held perpendicular to the leg, the heel is forcibly everted while the opposite hand braces the leg. The second radiographer is then signaled to push the exposure button, while the first radiographer holds the extremity steady in the stress position. Partial deltoid ligament tears may produce a 10° talar tilt with the eversion stress study or 35° to 45° tilt if completely torn.12
Manual ankle stress radiographs with the foot dorsiflexed and externally rotated can reliably predict deep deltoid ligament disruption after distal fibular supination-external rotation (SER) fracture. A medial clear space greater than or equal to 5 mm (or, greater than 4 mm) predicts deep deltoid ligament transection.13 This technique has been the currently accepted method for clinically determining medial instability secondary to SER injury14; however, recent studies have compared the manual stress technique to a gravity stress method.
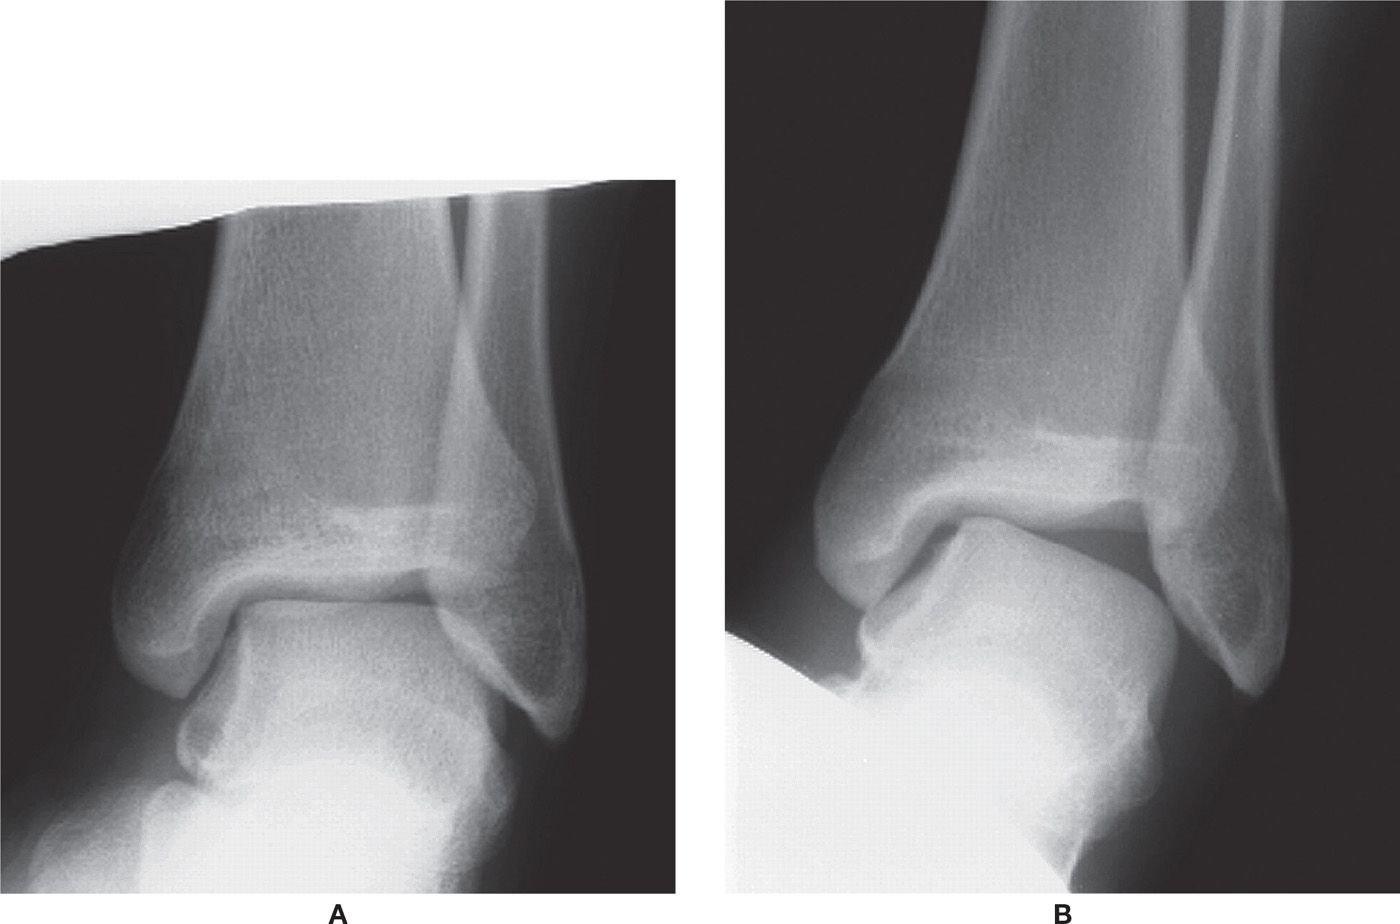
FIGURE 24-2. Stress inversion study. A: Normal. Note how the articular surfaces of the distal tibia and talar dome are parallel to one another. B: Abnormal. Note the significant degree of talar tilt.
The gravity stress radiograph is performed such that the patient lies in a lateral decubitus position on the side of the injured ankle; the most distal half of the leg, ankle and foot extend off the end of the table (see Figure 16-43). The image receptor is placed posterior to the ankle and the ankle is placed in the mortise position. This technique has been shown to be as reliable as manual stress radiography, is more comfortable to the patient, and does not require the radiographer to be in the radiography room.14,15
Anterior Stress Study
The anterior stress study evaluates the anterior talofibular ligament. It is believed that this study evaluates ligament integrity more critically than the stress inversion study.7 The anterior stress study, also known as the “push–pull” study or the anterior drawer test, is an attempt to subluxate the talus anteriorly. Technically, the extremity is positioned the same as it would be for a non–weight-bearing mediolateral ankle projection. The radiographer stands facing the toes. The hand that is closer to the foot cups the heel, and the other is placed along the anterior aspect of the distal leg with the elbow extended and locked. The radiographer must be careful to position his or her hands such that the lead gloves are not superimposed on the ankle joint. With the foot held perpendicular to the leg, the heel is forcibly pulled anteriorly, while the opposite hand pushes against the leg in a posterior direction. The second radiographer is then signaled to push the exposure button, while the first radiographer holds the extremity steady in the stress position.
In the lateral ankle view, the tibial plafond normally parallels the talar dome and apposes it 100%. Beynnon et al.16 compared four methods of measuring displacement of the talus; the measurement (in millimeters) between the posterior margin of the plafond and the nearest point on the talar dome was most useful for characterizing the position of the talus relative to the tibia on stress radiographs. A “positive” finding, known as the anterior drawer sign, is noted by a lack of parallelism between the tibial plafond and talar dome articular surfaces (Figure 24-3). Grace17 found that anterior talofibular ligament disruption was suggested if the distance between the posterior lip of the tibia and the nearest part of the talar dome was greater than 6 mm (Figure 24-3B).
CONTRAST STUDIES
Most soft tissue structures in the foot are of a similar radiographic density and normally cannot be distinguished from one another radiographically. These structures include joint cartilage, synovium, and capsule. Although tendons can occasionally be identified, their outlines are typically not sharp; and, it is impossible to see the tendon sheath. Bursae and arteries are “invisible” and also cannot be identified in the radiograph. Even soft tissue pathology, such as the ganglion cyst and the sinus associated with ulcer and infection, is not visible in most cases.
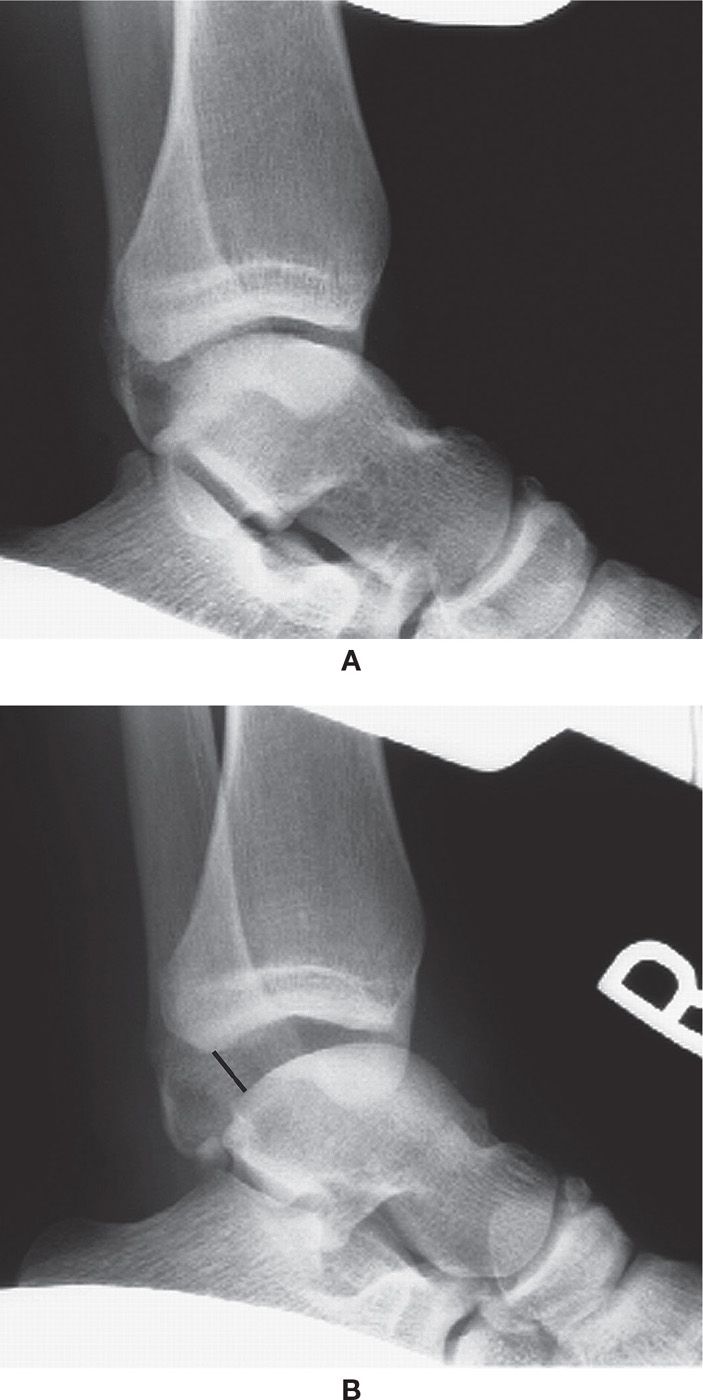
FIGURE 24-3. Anterior stress study. A: Normal. Note how the articular surfaces of the distal tibia and talar dome are parallel to one another. B: Abnormal. The foot has been subluxated anteriorly (the articular surfaces are not parallel), indicating a rupture of the anterior talofibular ligament. The black line demonstrates a distance greater than 6 mm, also consistent with rupture.
Contrast studies afford the physician an opportunity to visualize some soft tissue structures that otherwise are “invisible” in the radiograph. Typically, a radiopaque, iodinated contrast agent is injected into the part in question, be it a joint, tendon, bursa, or artery. (Patients sensitive to iodine are not candidates for iodinated contrast studies.) Most contrast studies are best performed with fluoroscopic or ultrasound (US) guidance. The structure is then assessed by the use of radiography. After injection of the contrast agent, the structure is seen as an increased density relative to adjacent tissues. The contrast studies performed on lower-extremity structures include arthrography (joint), tenography (tendon), bursography (bursa), and angiography (blood vessel). Contrast study of pathologic entities includes sinography (sinus) and gangliography (ganglion).
In recent years, contrast agents have been used to enhance CT and MRI.18–21 Boxes 24-2 and 24-3 list potential uses in the foot and ankle.
BOX 24-2 Potential Uses for Computed Tomography Imaging with Iodinated Contrast Agents18
INTRAVENOUS ENHANCED CONTRAST
1. Osteomyelitis (soft tissue extent)
2. Primary soft tissue abscess
3. Soft tissue component of bone tumors
INTRA-ARTICULAR CONTRAST
1. Osteochondritis dissecans
2. Loose bodies
3. Synovial chondromatosis
4. Pigmented villonodular synovitis
BOX 24-3 Potential Uses for Contrast-Enhanced MRI with Gadopentetate Dimeglumine18
1. Infection delineation
2. Tumor characterization and evaluation
3. Pannus versus joint effusion
4. Articular20,21 and tendon injuries
5. Fracture healing
6. Osteonecrosis revascularization
Arthrography
Arthrography, combined with radiography, is mildly invasive and provides information limited to the contour of the cartilage surface.22 Although it could be performed in any pedal joint, arthrography is almost exclusively used in the ankle joint. Pedal joints are rarely studied, the exception being the subtalar joint. Applications for ankle arthrography are primarily for, but not limited to, assessment of ligament damage. It can also be performed to evaluate the integrity of articular cartilage; locate loose bodies and meniscoid lesions, adhesive capsulitis, and capsular rupture23; and evaluate for rheumatic disease.24 After trauma, arthrography should ideally be performed right away or at least within 1 week.25 Indications for metatarsophalangeal joint arthrography include arthritis, integrity of joint implants,26 plantar plate abnormalities, and capsulitis, synovitis, and metatarsalgia.27
Radiopaque (“positive”) or radiolucent (“negative”) contrast agents can be used for arthrography. Radiolucent contrast agents include air or carbon dioxide. The negative contrast study is especially useful for patients sensitive to iodine (positive contrast agents typically are iodinated). For assessing cartilage integrity, radiopaque and radiolucent contrast agents can also be injected in combination. This is known as a double-contrast study.
For an ankle arthrogram, after a sterile preparation of the site, 5 to 10 mL of contrast agent is injected into the anteromedial aspect of the ankle. Mortise, AP, and lateral ankle views are then obtained.
Three recesses normally fill with contrast material: the anterior recess, the posterior recess, and the region of the syndesmosis between the distal fibula and tibia.28 The ankle joint capsule fills as a well-defined sac or pouch both anterior and posterior to the ankle joint in the lateral view.29 In the AP view, the contrast appears as an “umbrella” surrounding the talus; pouches of contrast can be seen medially and laterally but do not extend below and around the malleoli (Figure 24-4). Slight visualization of dye is normally seen in the distal tibiofibular synovial recess. As a variation of normal, the posterior subtalar joint fills in 10% of the population (Figure 24-5A).30 In the AP view, this appears as a “double umbrella sign.” In addition, the flexor hallucis longus and flexor digitorum longus tendons fill in patients with no underlying pathology in 20% of the normal population31 (Figure 24-5B).
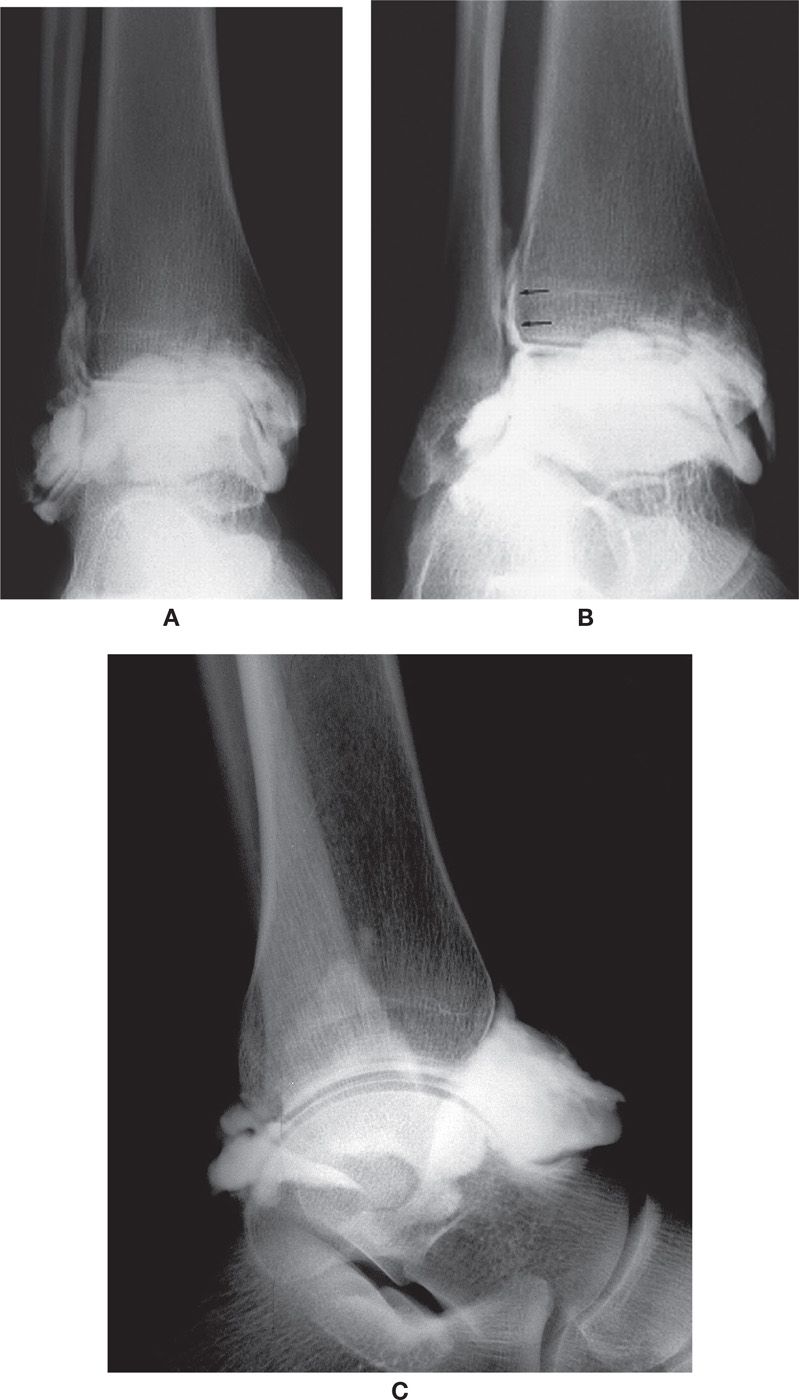
FIGURE 24-4. Normal ankle arthrogram. A: AP view. Note the medial and lateral pouches. B: Oblique (mortise) view. Note the filling of the distal tibiofibular joint (arrows). C: Lateral view. Note the anterior and posterior pouches.
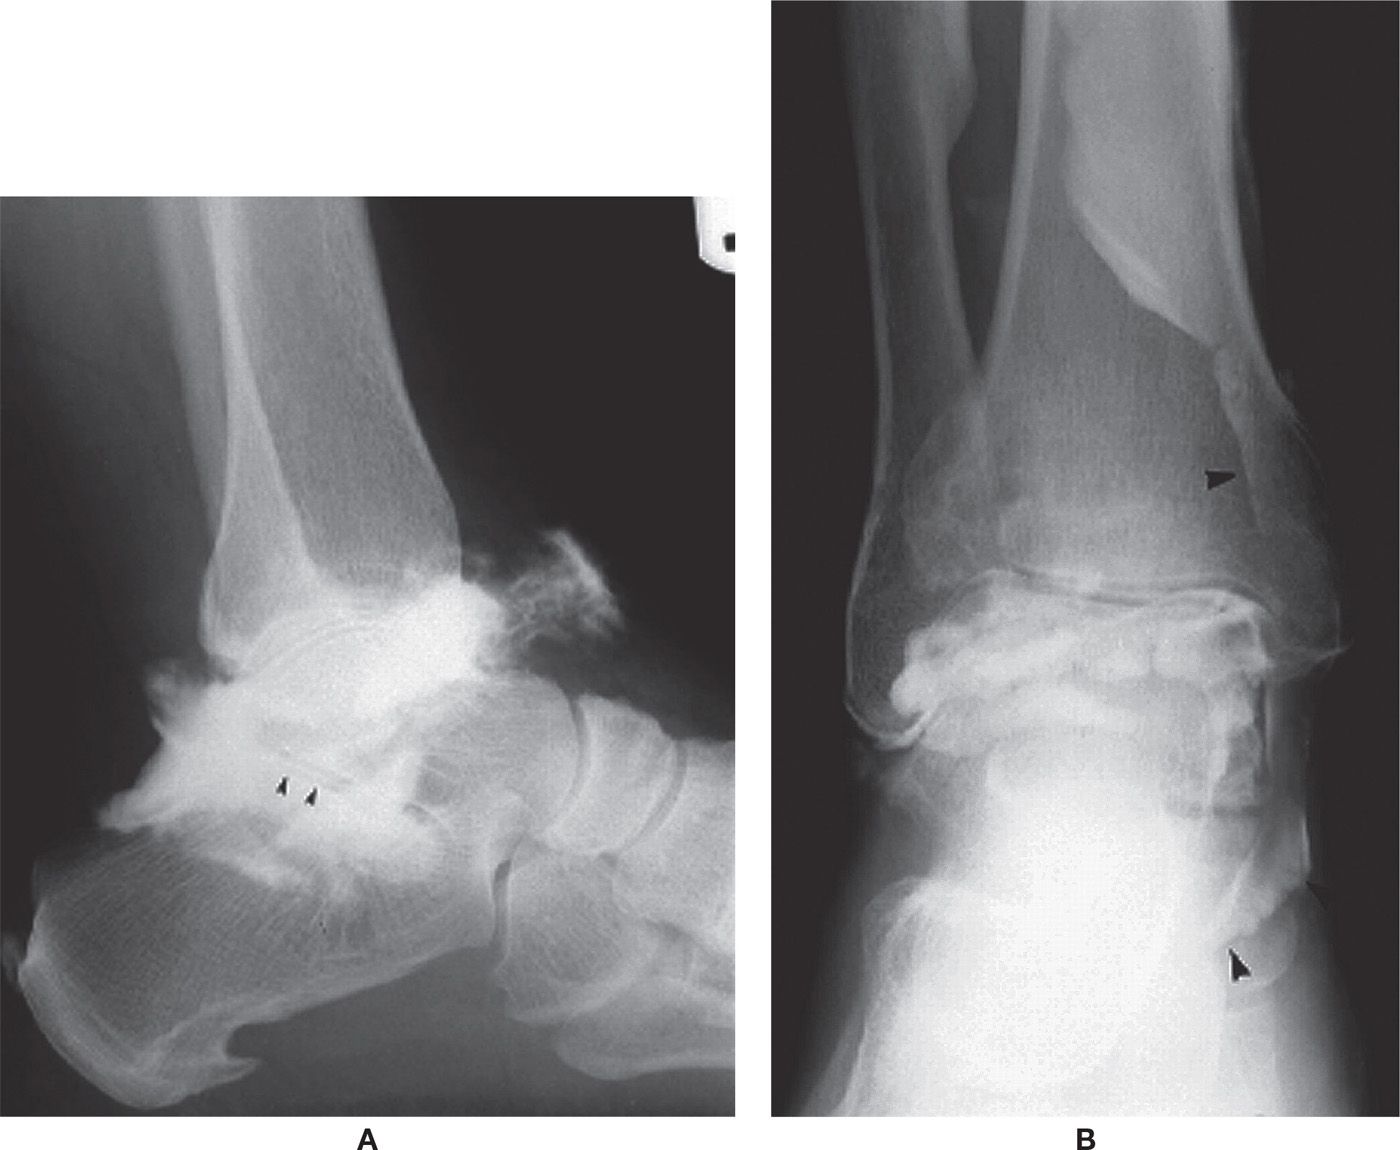
FIGURE 24-5. Variant filling presentations. A: Posterior subtalar joint (arrowheads). B: Flexor tendons (arrowheads).
Positive (abnormal) findings include absence of a well-defined joint capsule extending anteriorly or posteriorly, the presence of dye inferior to the tips of either malleolus, extravasation of dye superior to the distal tibiofibular synovial recess, and filling of the peroneal tendon sheath.32
Ankle arthrography (and tenography) using radiography has been replaced in most instances with ultrasound and cross-sectional imaging.33 For example, ultrasound can successfully image the ankle ligaments and is noninvasive. Talar osteochondritis dissecans is assessed with CT arthrography.34 MRI, with its excellent soft tissue contrast, is the best imaging technique currently available for the assessment of articular cartilage.35 MRI is also used to assess ankle ligamentous damage, impingement, and loose bodies.36 With MRI, gadolinium can be used as a contrast-enhancing agent.
Tenography
Tenography is also performed with an iodinated, radiopaque contrast agent. It is performed on the tendon and tendon sheath structures about the ankle joint, primarily the peroneal tendons (Figure 24-6), although it can also be used on the medial and anterior compartment tendons (Figures 24-7 and 24-8).
The injection site is selected proximal to the point of maximal tendon tenderness. After sterile preparation, the technique is performed in the following manner37: A needle and syringe with local anesthetic is inserted into the tendon until firm resistance is encountered. The technician inserts gentle pressure on the plunger while slowly withdrawing it from the tendon. (The needle is within the sheath when the anesthetic flows easily.) While the needle remains in place, the syringe is removed and replaced with a second syringe containing the contrast agent. Contrast is injected until it fails to fill distally and extravasates proximally. Standard lateral foot and ankle, AP ankle, and dorsoplantar foot views are obtained following injection. Variations of this technique have also been described.38
Indications for tenography include tendon and tendon sheath damage, impingement, dislocation, and tenosynovitis.37,39 Peroneal tenography can also be used to assess calcaneofibular ligament ruptures. Subsequent filling of the ankle joint with contrast indicates rupture of the calcaneofibular ligament.40,41 As noted with arthrography, however, tenography has been replaced in most cases by other imaging studies, in particular, ultrasound and MRI.
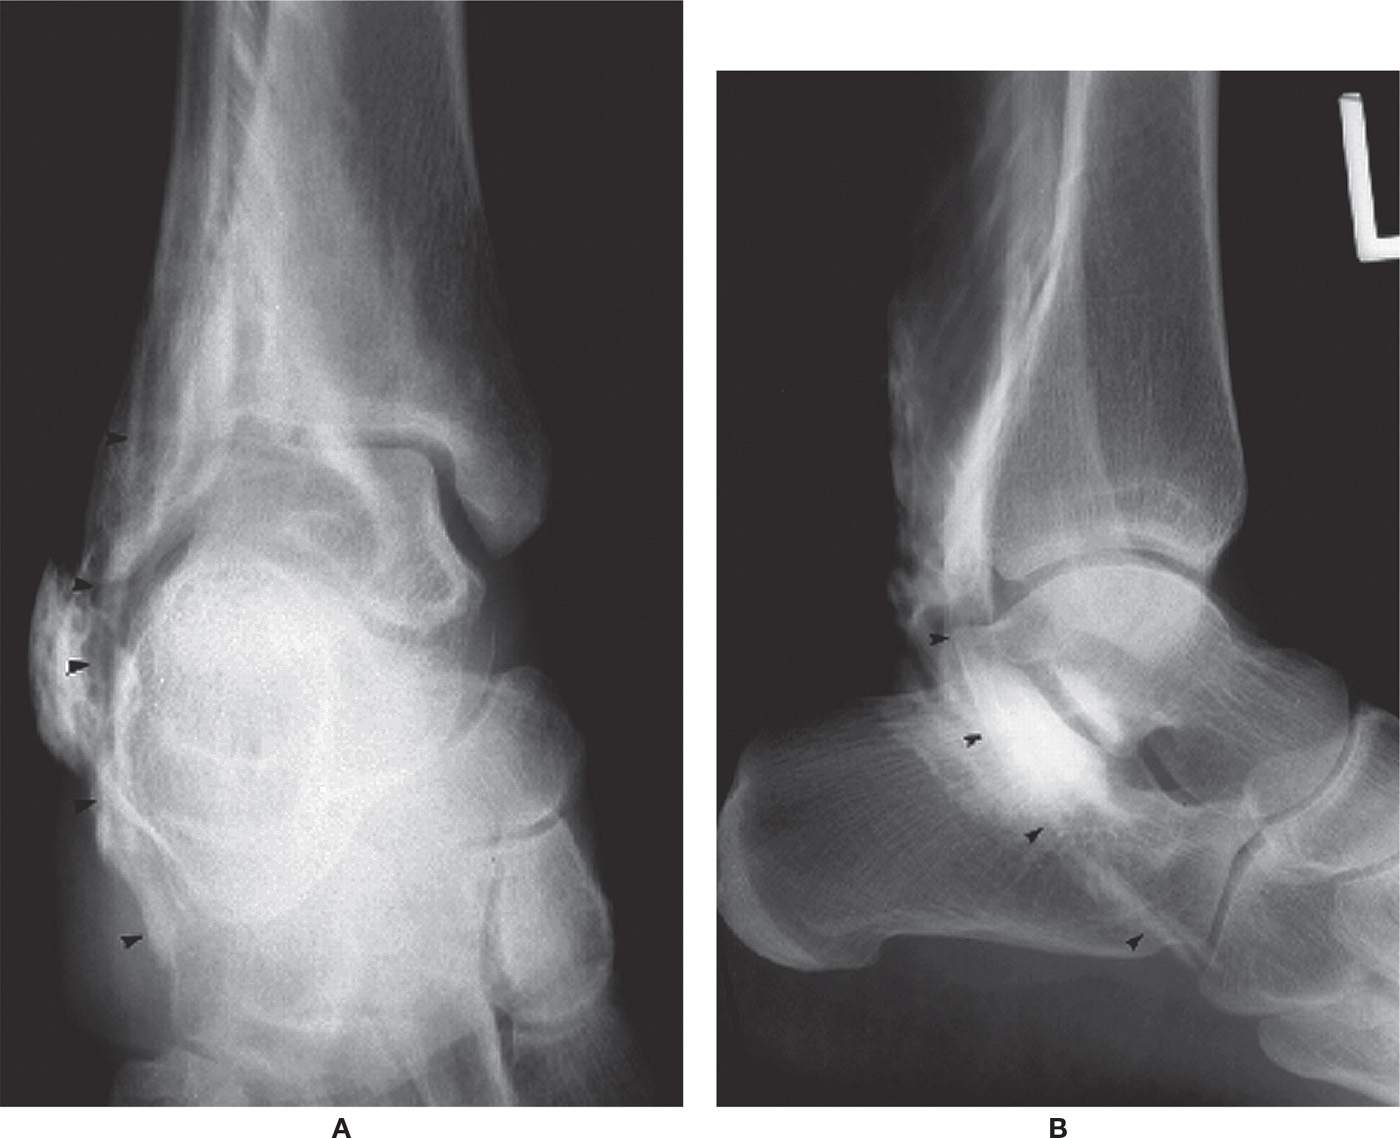
FIGURE 24-6. Tenography (peroneal tendon, arrowheads). A: AP view. B: Lateral view.
Sinography
Sinography is used to determine whether or not a sinus or cavity in the soft tissues communicates with an underlying bone or joint.42 This type of study can be useful for evaluating infection.43 Radiopaque contrast material is injected into a small catheter that has been placed deeply into the sinus. Radiographs are then obtained, delineating the extent and complexity of the sinus from the retrograde or gravitational filling of the contrast material44 (Figure 24-9). It has also been used in combination with 1% methylene blue to evaluate a chronic plantar ulceration and to visibly outline its sinus tract before an operation.45
Bursography
Bursography of the retrocalcaneal bursa can be performed after fluid aspiration.25 It is used to evaluate irregularity and nodularity of the synovial lining in patients with rheumatoid arthritis.42 Frey and associates46 advocate bursography for evaluating and differentiating hindfoot pathology.
Gangliography
Ganglion cysts on the dorsum of the foot are not uncommon. Gangliography performed before surgery can help the surgeon understand the clinical extent of the cyst (Figure 24-10). In 1982, Reinherz published a report of one case.47 Ly and McCarty48 outlined the technique and complications of gangliography. However, both MRI and ultrasound can nicely image the ganglion and its extent and are noninvasive.
Angiography
Angiography is primarily used to assess the patency of blood vessels in the foot. Arteriography evaluates arteries, and venography (or phlebography) evaluates veins. It can be used to evaluate conditions exhibiting dilated, constricted, or blocked vessels. A thrombus, for example, can be clearly demonstrated by venography.49 Arteriograms are advocated for most penetrating and violent extremity injuries with blunt instrument50 and are useful for evaluating arteriovenous fistula.51 Examples of musculoskeletal disorders in the foot evaluated with angiography include reflex sympathetic dystrophy, frostbite, and vascular malformations (hemangioma).52
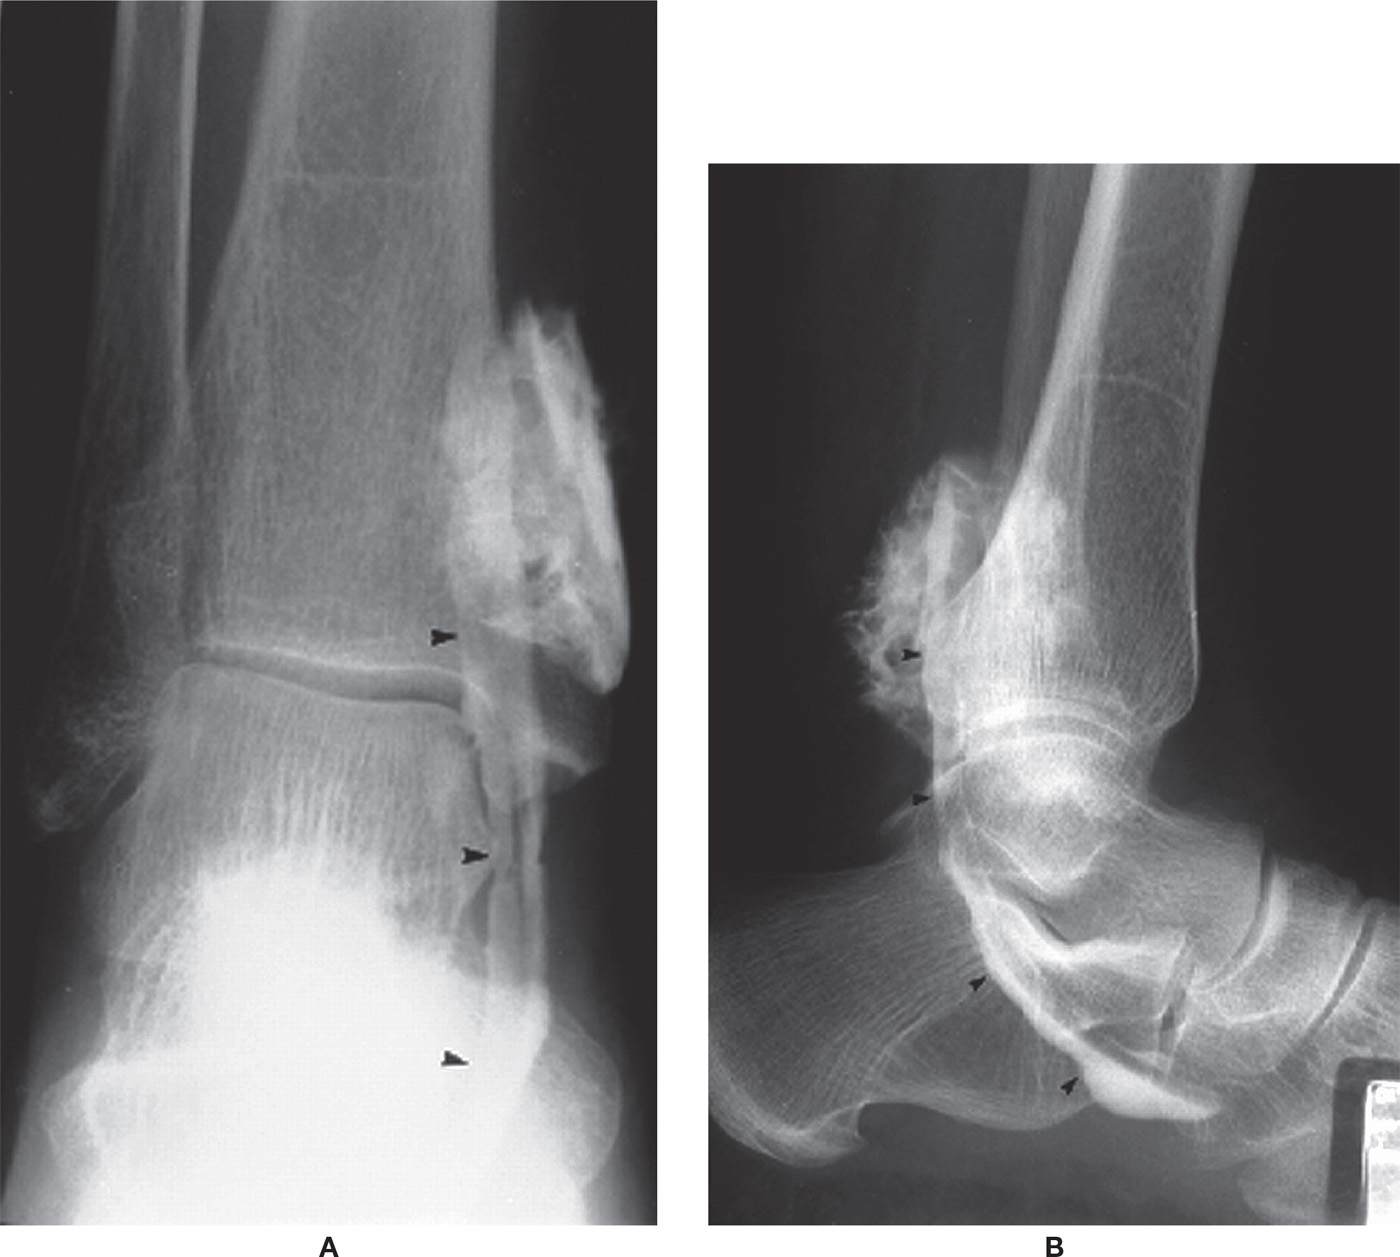
FIGURE 24-7. Tenography (tibialis posterior tendon, arrowheads). A: AP view. B: Lateral view.
Lower-extremity arteriography (Figure 24-11) is not used solely as a diagnostic study; it also serves as a preparatory procedure for nonsurgical endovascular therapy.53 Contrast agent is injected at the aortic bifurcation or more distally for conventional arteriography of the lower extremities. Radiographs are then obtained.
The gold standard for evaluating the arterial vasculature and assessing blood flow is digital subtraction angiography (DSA), which uses an iodinated radiopaque contrast agent. Contrast material is injected intravenously, and images are obtained by computed fluoroscopy.54 It is simpler, less invasive, and less costly than arteriography; it subjects the patient to decreased discomfort and can be performed on an outpatient basis.55 It is essentially a radiograph but with the bones and soft tissues “subtracted” out of the image. Disadvantages include higher contrast-medium loads and decreased spatial resolution (therefore poorer-quality images).56 Alternative imaging techniques include duplex ultrasonography, magnetic resonance angiography (MRA), and computed tomography angiography (CTA).
Duplex ultrasonography has become a favorite first choice with some practitioners because it is noninvasive, but performing the study requires technical expertise. However, duplex ultrasonography, as well as contrast-enhanced MRA, was less accurate than conventional angiography for detecting pedal stenosis.57
MRI can be used as a noninvasive study to view blood flowing through the vascular tree, referred to as 2-D time-of-flight58–60; however, the vessel itself is not imaged (Figure 24-12). MRA uses gadolinium, a noniodinated contrast agent, to enhance the image; gadolinium-based contrast agents, however, should not be ordered for patients who have end-stage renal disease because of its relationship with nephrogenic systemic fibrosis (aka nephrogenic fibrosing dermopathy). Collins et al.57 reported that contrast-enhanced MRA is the most accurate diagnostic technique for the detection of stenosis or occlusion above the knee.
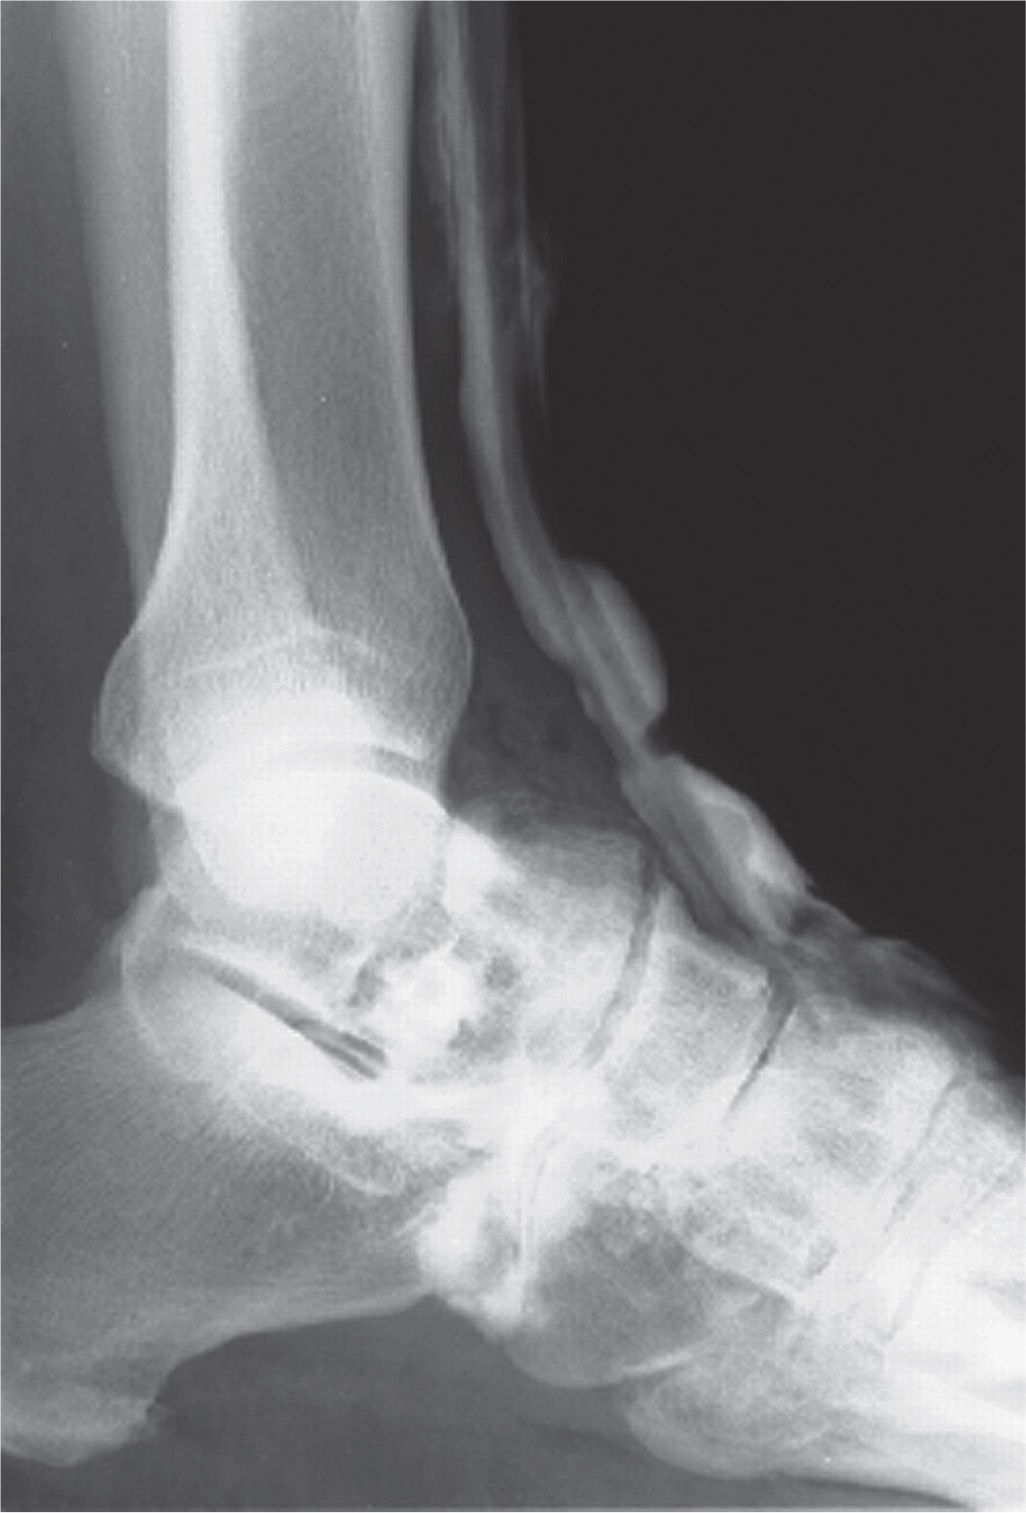
FIGURE 24-8. Tenography (tibialis anterior tendon) (lateral view).
FIGURE 24-9. Sinography. The extent of this sinus is demonstrated clearly in the lateral oblique view.
FIGURE 24-10. Gangliography. A: Dorsoplantar view. B: Lateral view.
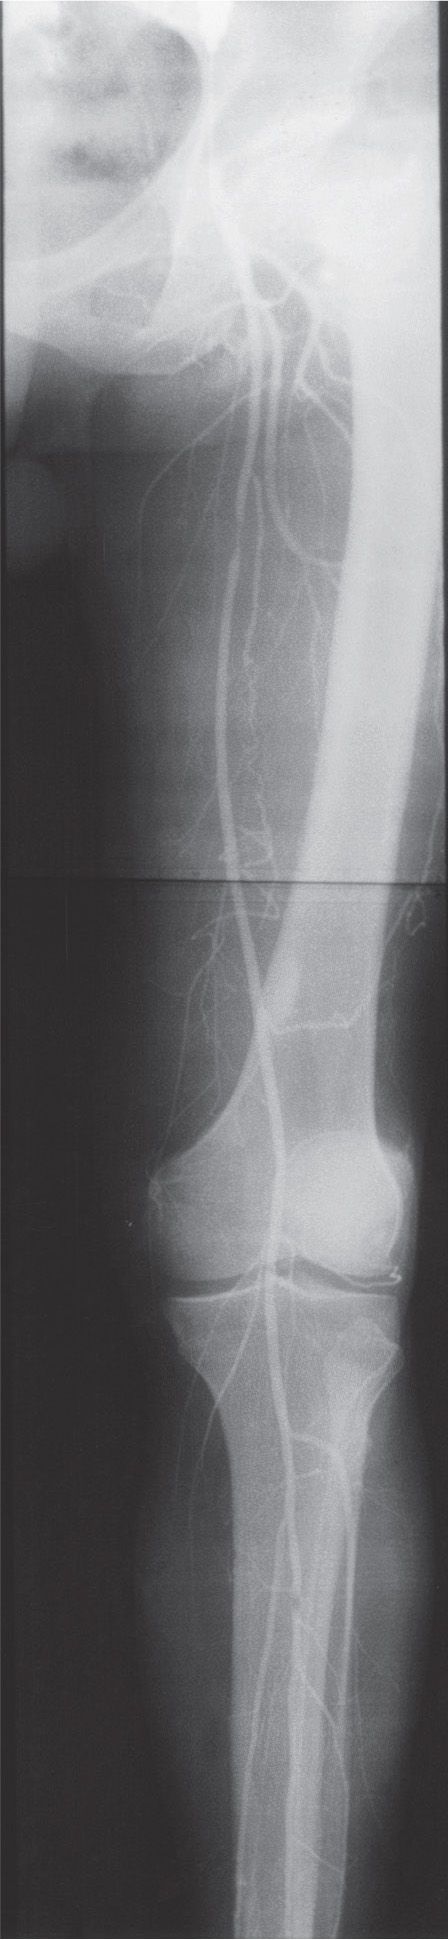
FIGURE 24-11. Arteriogram of the lower extremity.
CTA is another, relatively newer vessel imaging option using an iodinated contrast agent; 3-D reconstructions demonstrate excellent images and can be rotated on any axis. However, CTA does not demonstrate the small vessels in the foot very well.
Contrast venography has high sensitivity for detecting asymptomatic lower-extremity deep vein thrombosis.61 It is best accomplished using fluoroscopic guidance and can be performed as either an ascending (the procedure of choice) or a descending study. The ascending study venogram is performed in the following manner: A radiopaque contrast medium is injected into a distal superficial vein with or without a tourniquet; the procedure is monitored by fluoroscopy, and multiple-spot radiographs are obtained.51 Descending venography is performed by injecting the iodinated contrast agent more proximally; the patient performs a Valsalva maneuver (forced expiration against the closed glottis), and the degree of competency is determined based on reflux.62 Because of potential reaction to the contrast agent and significant discomfort from the procedure, noninvasive techniques for diagnosing lower-extremity deep venous thrombosis have been investigated.63
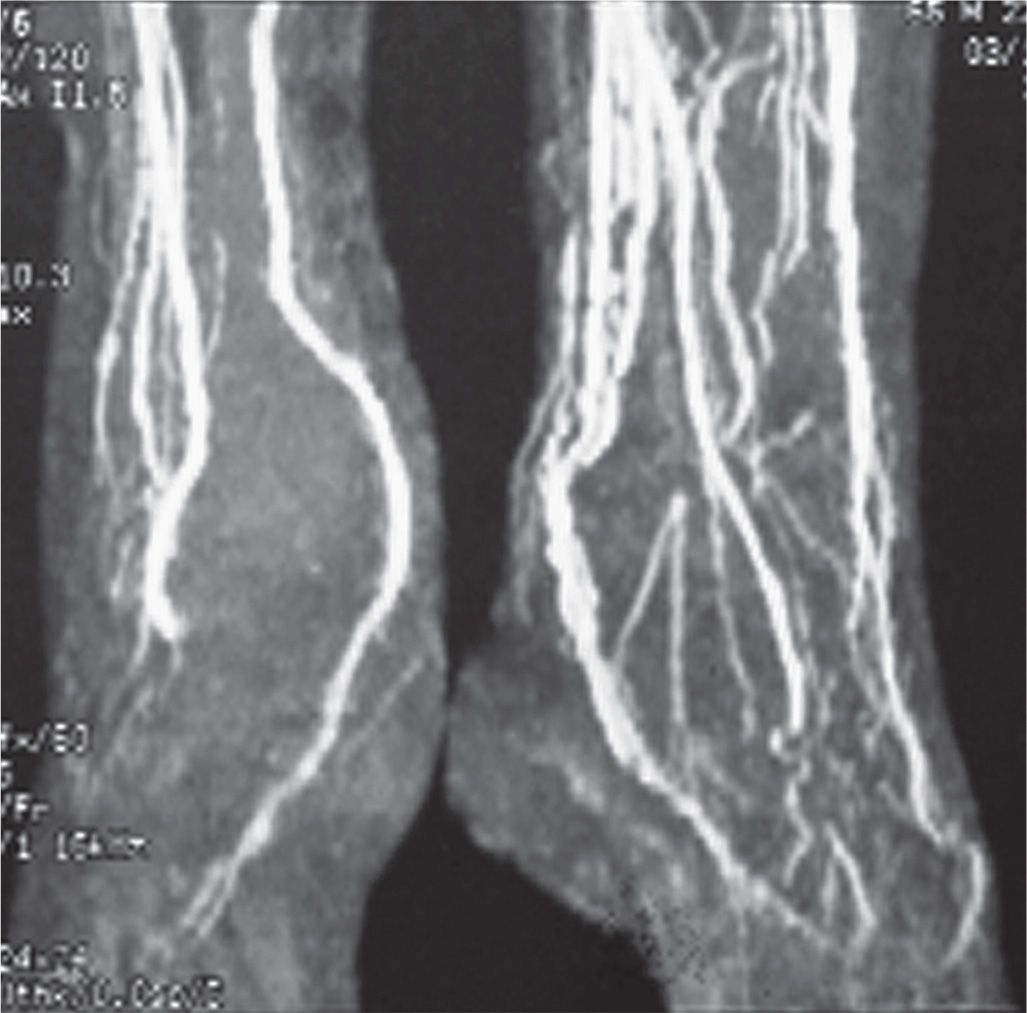
FIGURE 24-12. Magnetic resonance angiography.
Imaging of chronic venous disease is performed in most cases with duplex ultrasound (DU).64 Advantages include its ability to visualize color flow, relatively low-cost and noninvasive nature, and patient tolerance and satisfaction.65,66 Computed tomographic venography (CTV) and magnetic resonance venography are also valuable, especially for investigating chronic venous obstruction. Jung et al.67 concluded that, although Doppler ultrasound is the primary modality for evaluation of varicose veins in the lower extremity, CTV is useful when they arise from unexpected anatomic sources. MRI and CT provide high-resolution 3-D images that depict the veins and surrounding structures from the popliteal vein to the heart.64
NUCLEAR MEDICINE STUDIES
Nuclear medicine is that branch of diagnostic imaging that uses radioactive nucleotides (or radioisotopes, sometimes referred to as radioactive tracers) to image the body. This type of 2-D study is called planar scintigraphy. Scintigraphy evaluates physiologic activity, in contrast to radiographic assessment of morphology and tissue densities. In the lower extremity, scintigraphy is used to evaluate the musculoskeletal system.
The performance of a radioisotope study is quite different from radiography. First, a radioisotope is injected into the body; for lower-extremity studies, an antecubital intravenous site is typical. The radiopharmaceutical is distributed throughout the body and gives off gamma radiation. (Gamma rays are a form of ionizing radiation similar to x-rays except for their origin: Gamma rays are produced inside the nucleus of a radioactive atom, and x-rays are artificially produced outside the nucleus.68) A gamma (or scintillation) camera is positioned over the body part in question and detects ionizing radiation being emitted (scintillating) from the patient. Scintillation detectors in the camera measure the radiation; the resultant image is known as a scintiscan or scintigram. In contrast to radiography, x-rays are not transmitted through the patient in scintigraphy.
Different aspects of the foot and ankle can be imaged. The name of the view is based on that surface of the extremity nearest to the gamma camera. For example, if the dorsum of the foot were closest to the camera, the resultant image would be a dorsal view of the foot. Plantar, medial, and lateral views of the foot and anterior, posterior, medial, and lateral ankle views can also be obtained. Occasionally, you may hear the term “pinhole collimation” in reference to scintigraphy. This technique magnifies or increases the number of counts (or information density) available when recording the resulting image.69
The resultant image does not demonstrate the resolution seen in the radiograph. In fact, it may even be difficult to recognize the foot (Figure 24-13). Small black dots are seen in the image; their overall contribution resembles the form of the foot and ankle. Individual toes may be identifiable in the dorsal and plantar views. The black dots reflect the detection of the radioisotope by the camera. A focal, increased accumulation of dots in the scintigram is called a “hot spot” and corresponds to the accumulation of radiopharmaceutical in tissue; absent accumulation (or an area of photopenia) is known as a “cold spot.”
The radioisotopes used to image foot and ankle pathology are technetium, gallium, and indium. They frequently are used individually or in combination to assess musculoskeletal infection in the foot. Keep in mind that scintigraphy does not detect the presence of infection but reflects the reaction of bone (or inflammatory process) possibly associated with infection.70
Technetium
Technetium is the most widely used of the three radioisotopes. The procedure that uses technetium-99m methylene diphosphonate (MDP) is known as bone scintigraphy, commonly referred to as the three-phase bone scan. The technetium-phosphate complex is incorporated into bone that has increased osteoblastic activity. Its distribution is highly dependent on patent vascularity.
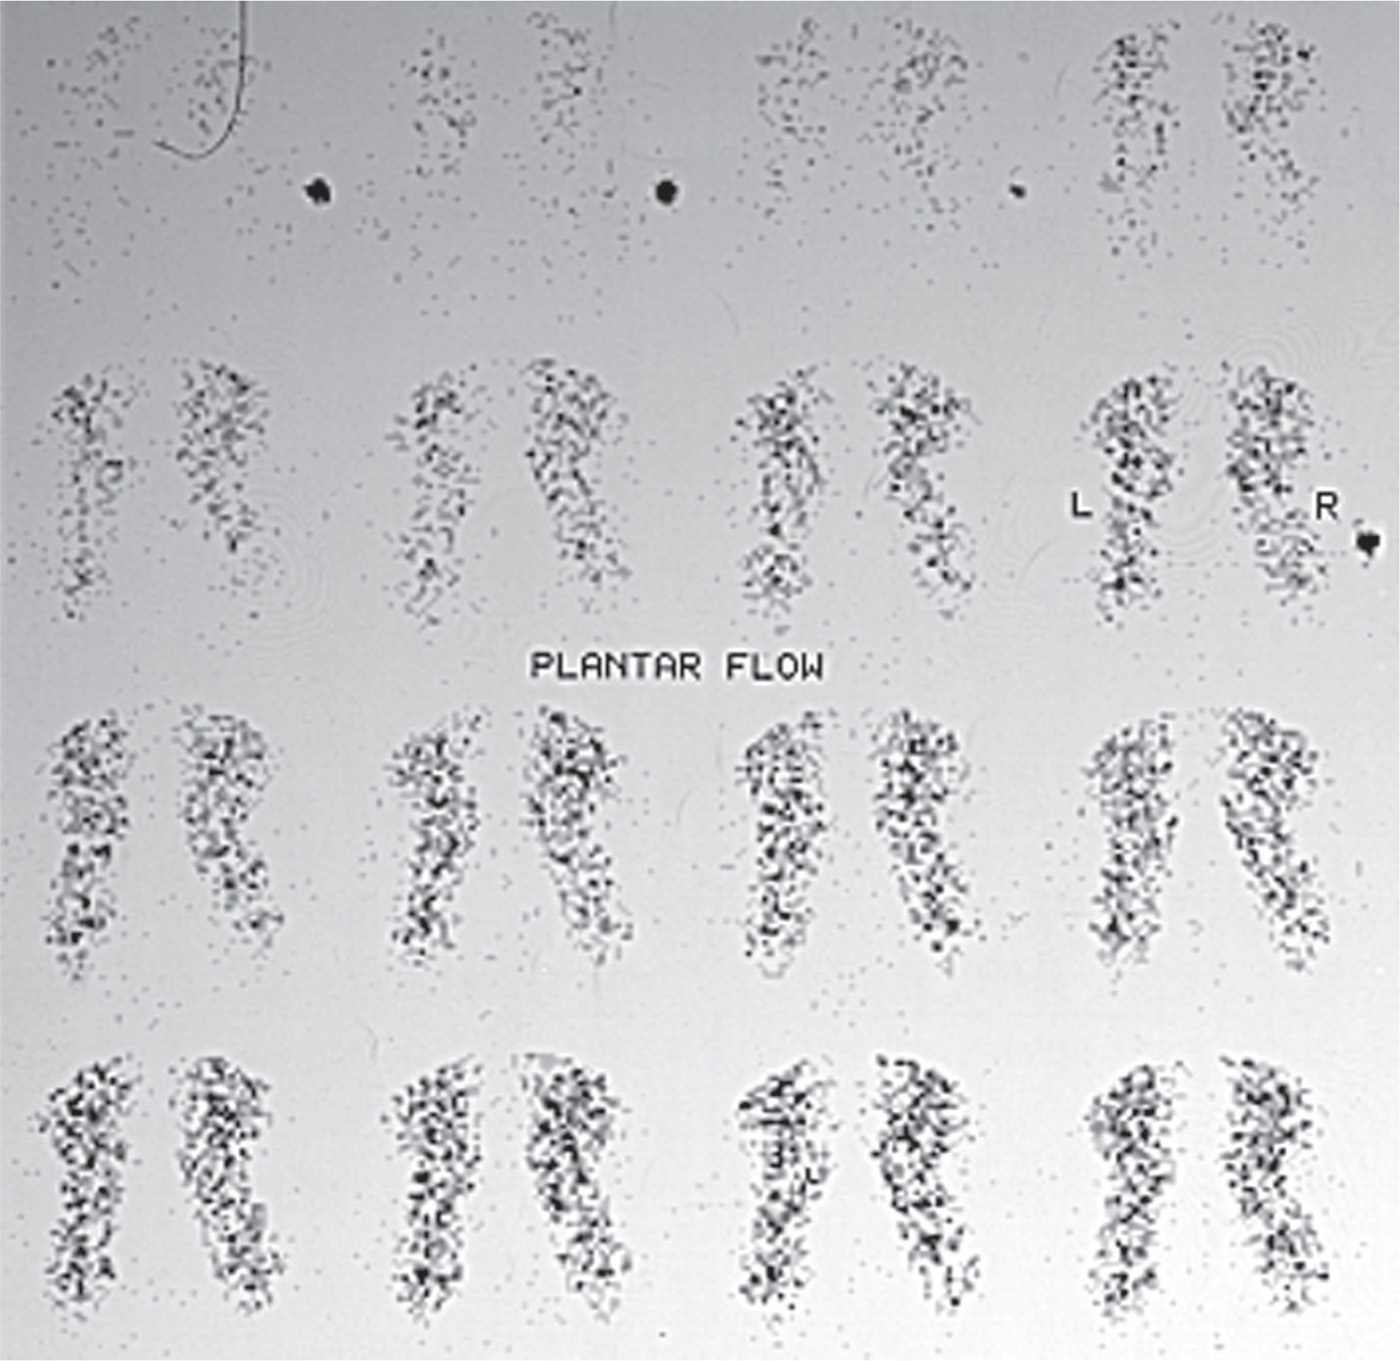
FIGURE 24-13. Bone scintigraphy: Phase 1 (flow study or arteriogram).
Bone scintigraphy is a valuable adjunct to radiography. Before osseous change is seen in a radiograph, 30% to 50% of bone must be resorbed or destroyed,71 whereas bone scintigraphy readily detects pathology with accompanying osteoblastic activity. Although bone scintigraphy is an extremely sensitive technique for detecting increased (or decreased) bone activity, it is not highly specific. Many pathologic conditions have increased bone activity that shows increased skeletal uptake of radioisotope. To increase specificity, the results must be associated with history, clinical, and radiographic findings.
Bone scintigraphy is typically performed in three phases: dynamic flow, blood pool, and delayed.72 The dynamic flow phase (see Figure 24-13) is actually an angiogram of the part being imaged, performed promptly after antecubital injection of the radioisotope. It represents the radioisotope flowing through the vascular tree. The blood pool phase (Figure 24-14) is performed a few minutes after injection of the radiopharmaceutical. Localized accumulation of the radioisotope is seen in areas of hyperemia. The delayed or bone scan phase (Figure 24-15) is performed 2 to 4 hours after the injection. By this time, the technetium-phosphate complex has been incorporated into bone with increased osteoblastic/metabolic activity. A fourth phase, performed 24 hours after the injection, has been advocated for patients with compromised vascularity to the part in question.73 Israel and associates74 noted that although the uptake of technetium-99m MDP stops at approximately 4 hours in normal bone, it continues at 24 hours in abnormal bone. Indications for triple-phase bone scintigraphy75 include trauma (stress fracture, occult fracture,76 reflex sympathetic dystrophy, osteonecrosis, myositis ossificans, frostbite, bone graft, pseudoarthrosis), bone tumor77 (primary and metastatic), osteomyelitis, and arthritis.78 Bone scintigraphy is especially useful for evaluating undiagnosed bone pain in the presence of normal radiographs.
A relatively newer agent, technetium-99m hexamethylpropyleneamine oxime (HMPAO), has been used to image inflammatory processes, in particular, osteomyelitis.79 technetium-99m HMPAO selectively labels leukocytes (granulocytes) and is prepared in an in vitro manner similar to indium-111 (described next). Compared with indium-111, technetium-99m HMPAO has been reported to offer similar accuracy, be more convenient to use, use a lower radiation dose, and be capable of imaging low-level inflammation more readily.80
Gallium, Indium, and Other Tracers
The radiopharmaceuticals, gallium-67 and indium-111, are frequently used with technetium-99m MDP for evaluating osteomyelitis (Figure 24-16). This is especially the case if another underlying skeletal disorder (osteoarthritis, neuroarthropathy, fracture, and postoperative healing, for example) presents at the same location on radiographs. Although bone scintigraphy may be sensitive for bone infection, adding these studies improves specificity.
During the 1970s and early 1980s, gallium was used concomitantly with bone scintigraphy for assessing osteomyelitis. It has been shown to be very sensitive for detecting inflammatory foot lesions81 and useful for following the efficacy of treatment, because it does not localize in healing bone.82 Images for the gallium-67 citrate scan are typically acquired 24 hours following injection. Gallium depends less on blood flow and accumulates in areas of infection. The intensity of gallium uptake at the suspected site of infection must be equal to or greater than that seen in the bone scan.83 However, the indium-111–labeled leukocyte scan, when available, is preferable to gallium for diagnosing osteomyelitis,84 except in children.85
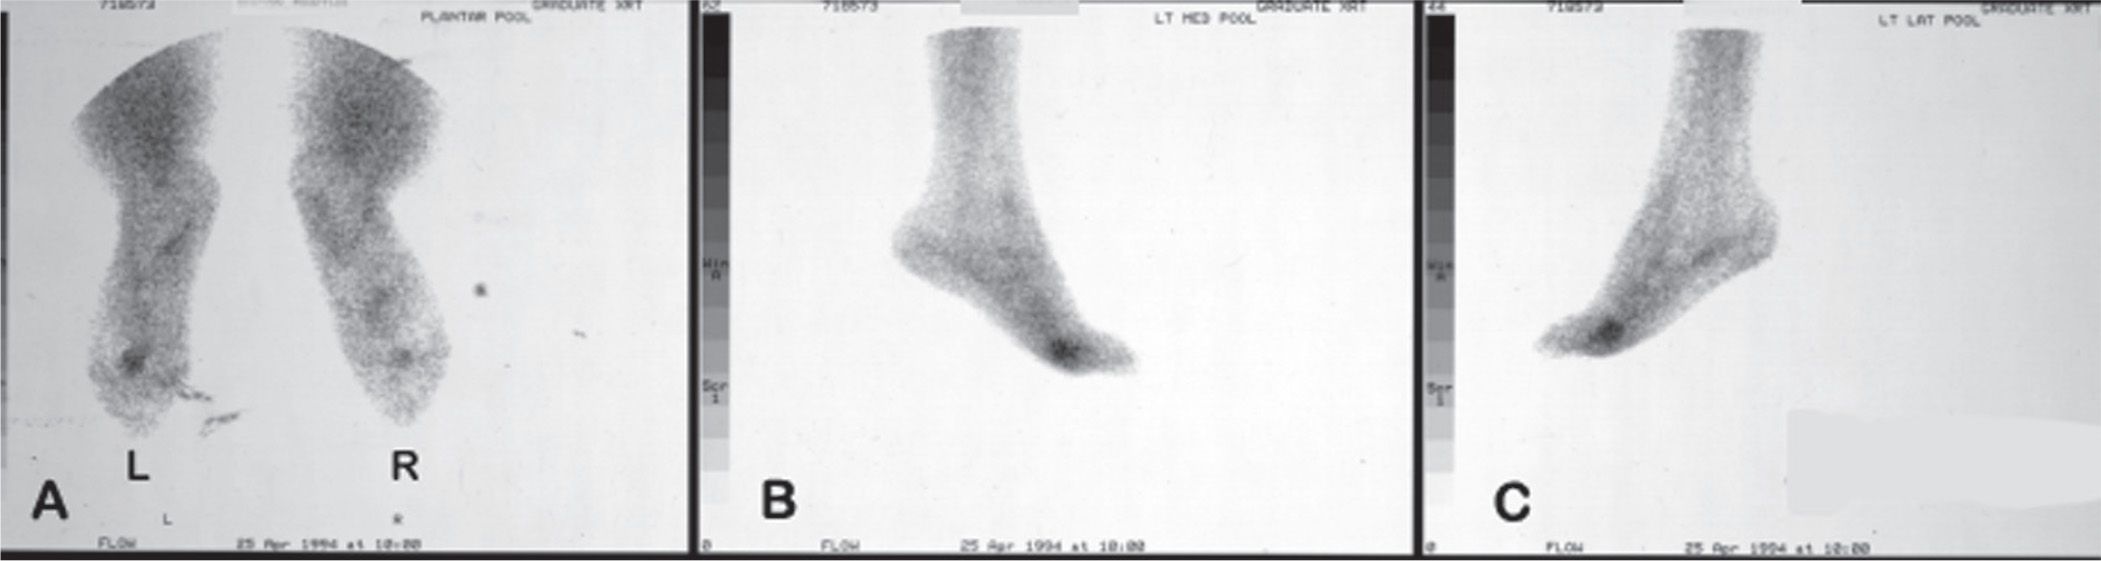
FIGURE 24-14. Bone scintigraphy: Phase 2 (blood pool study). (L, left; R, right). A. Plantar. B. Left medial. C. Left lateral.
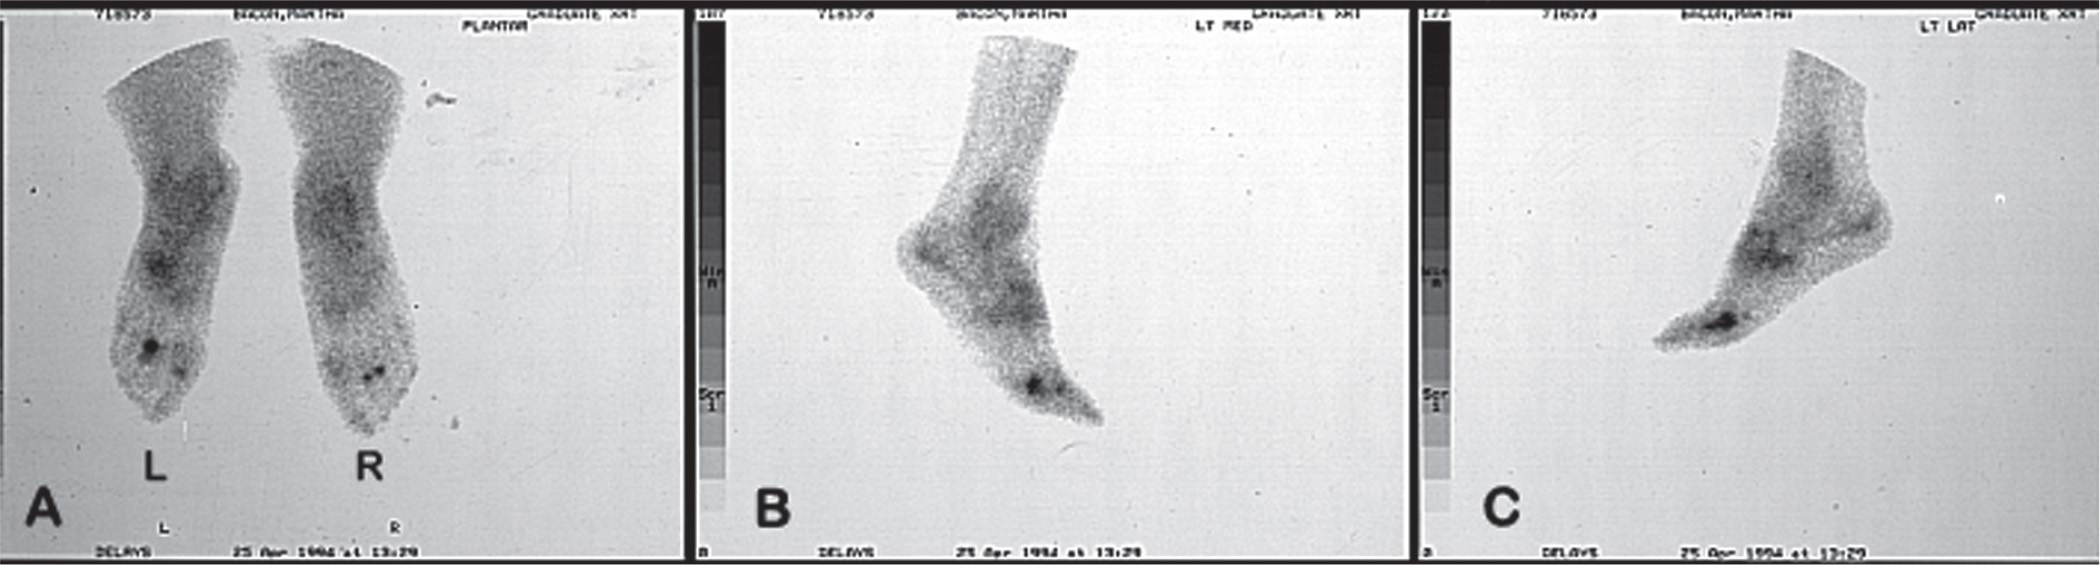
FIGURE 24-15. Bone scintigraphy: Phase 3 (the bone scan). (L, left; R, right). A. Plantar. B. Left medial. C. Left lateral.
Indium is probably superior to gallium for imaging most musculoskeletal infections,86 although some argue that the gallium technique is still useful, given its proven clinical efficacy and practical advantages (less expensive, readily available, easier to perform, and less problematic).87 It is felt that the results of indium in combination with technetium is more sensitive and specific for osteomyelitis, especially in the foot demonstrating neuropathic osteoarthropathy, than technetium alone or technetium in combination with gallium.88,89 Indium scanning was shown to be valuable in assessing diabetic foot ulcers; many of these patients have an underlying osteomyelitis that is unsuspected clinically.90 Unfortunately, indium is not widely available and requires technical expertise in its prolonged in vitro preparation.91 Blood is drawn from the patient; leukocytes are separated from the whole blood and labeled with indium-111, then reinjected into the patient. Images are obtained 24 hours after injection. Other disadvantages include its poor resolution, high radiation dose, and the fact that indium-111 imaging alone does not consistently differentiate from infection disorders that alter bone marrow activity.92 Radiolabeled white blood cells also lack specificity for infection because they localize in nonspecific areas of inflammation.93
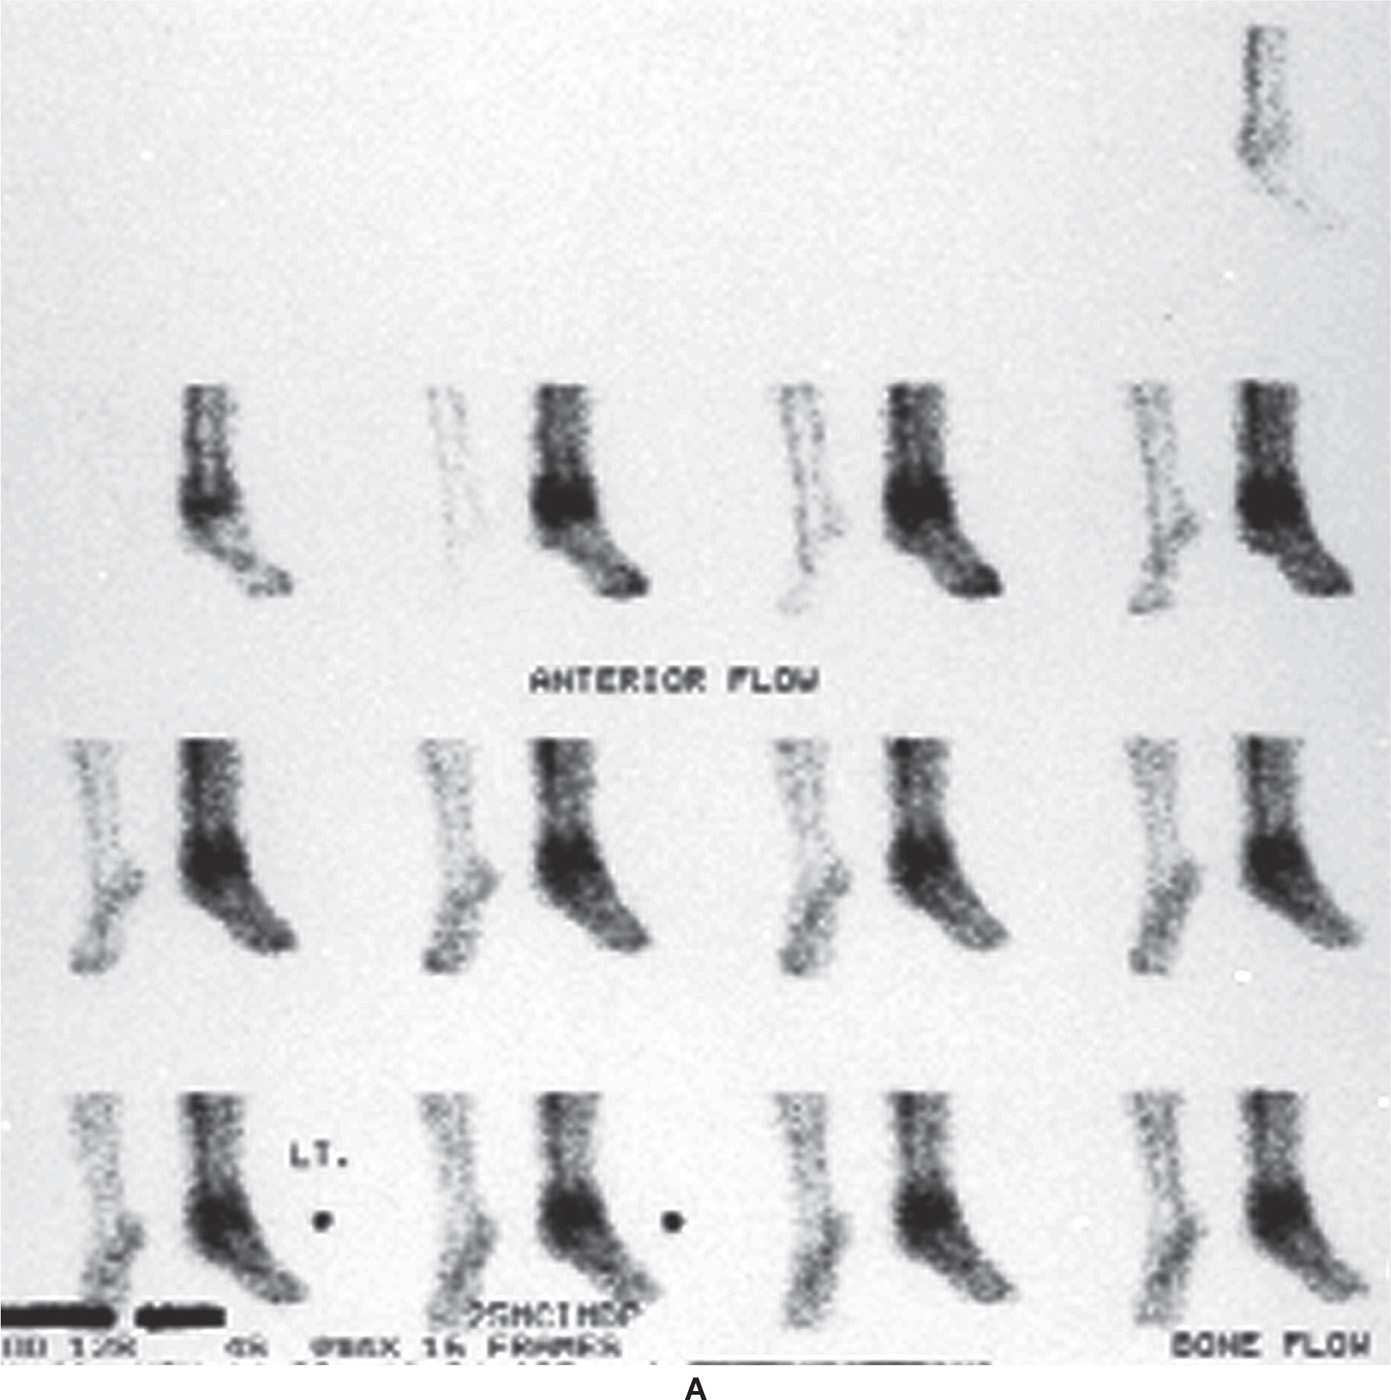
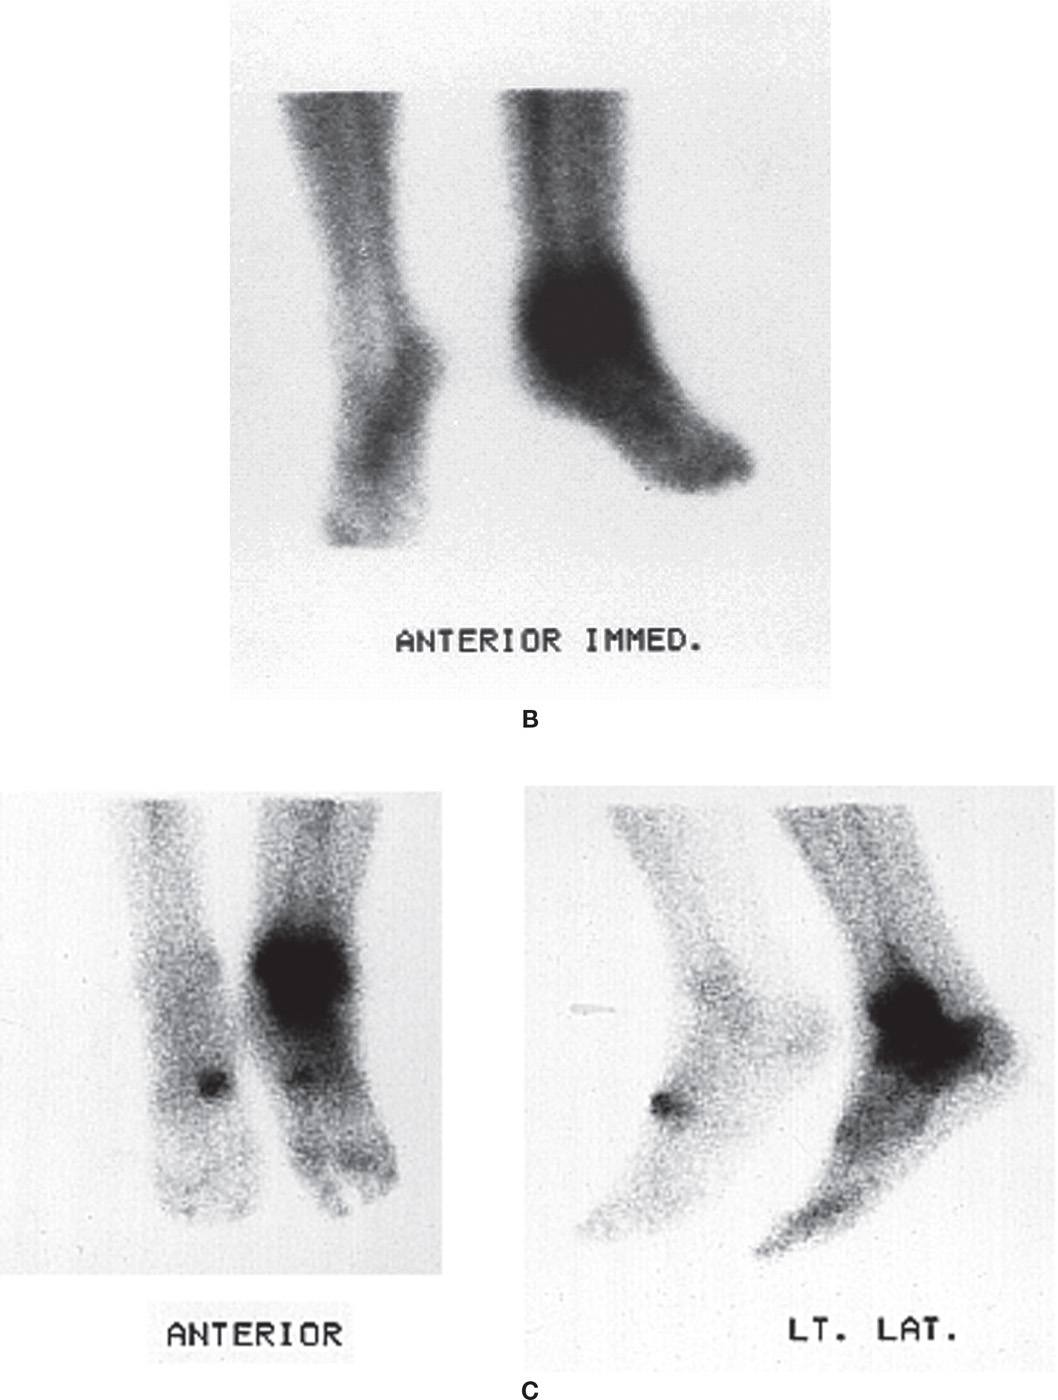
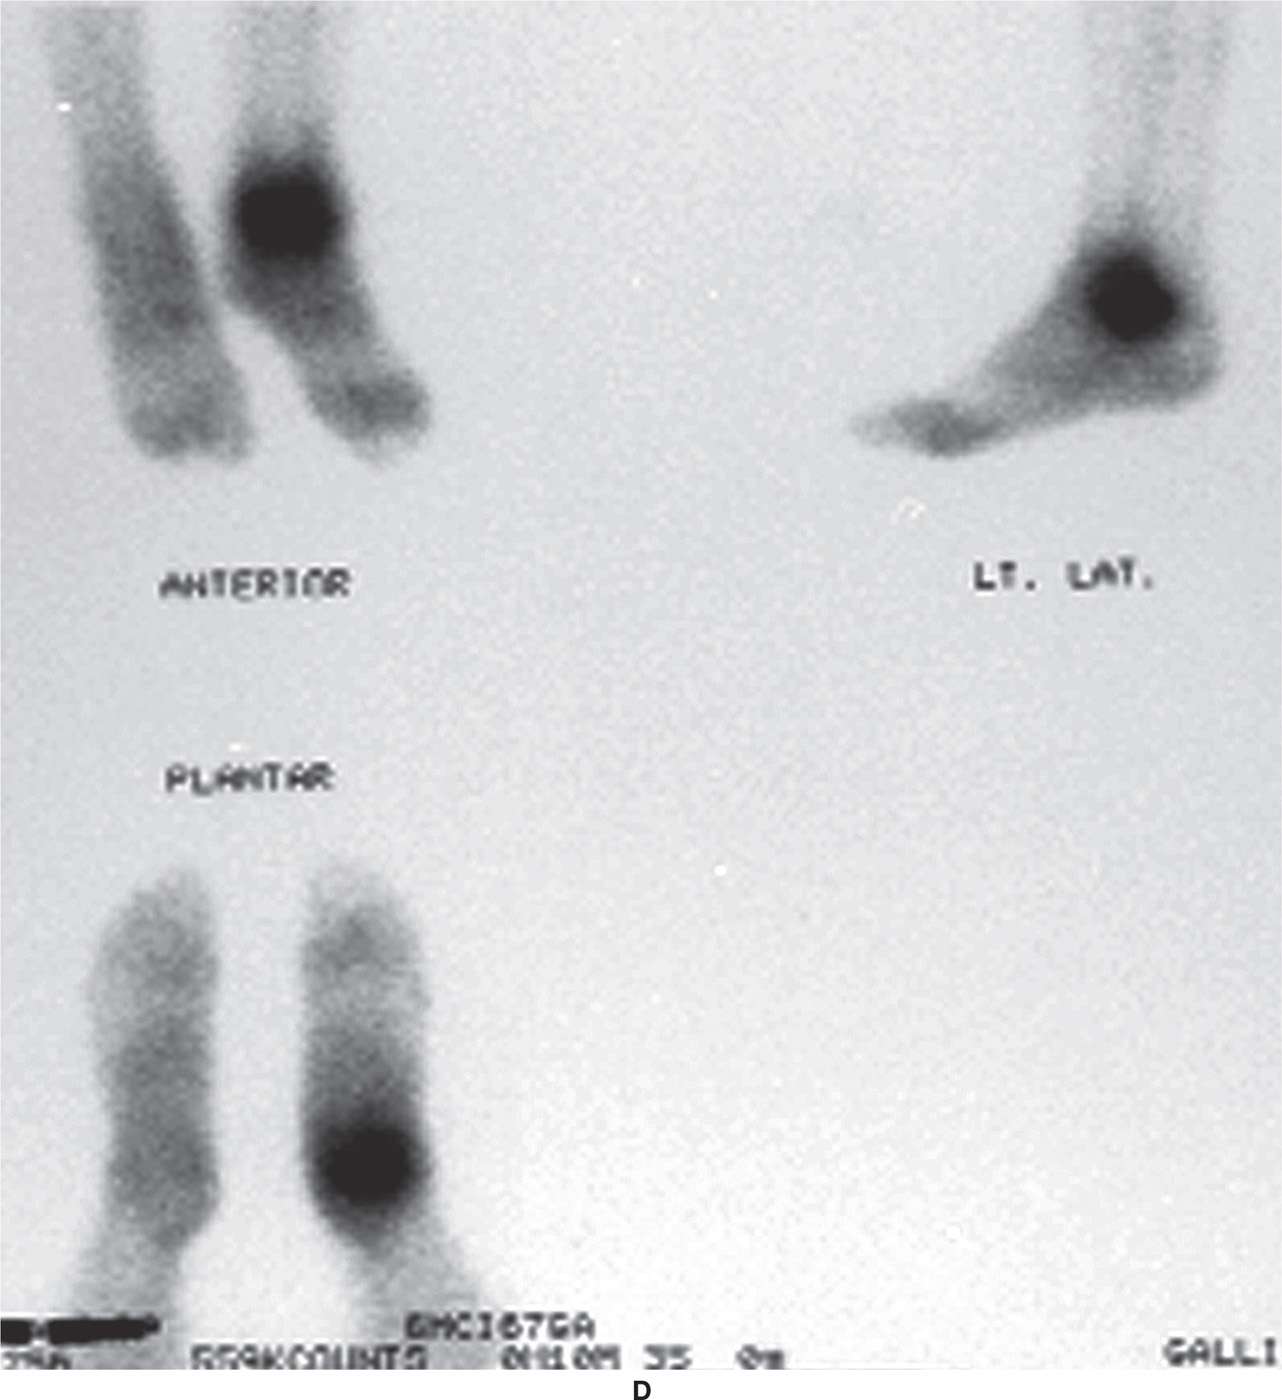
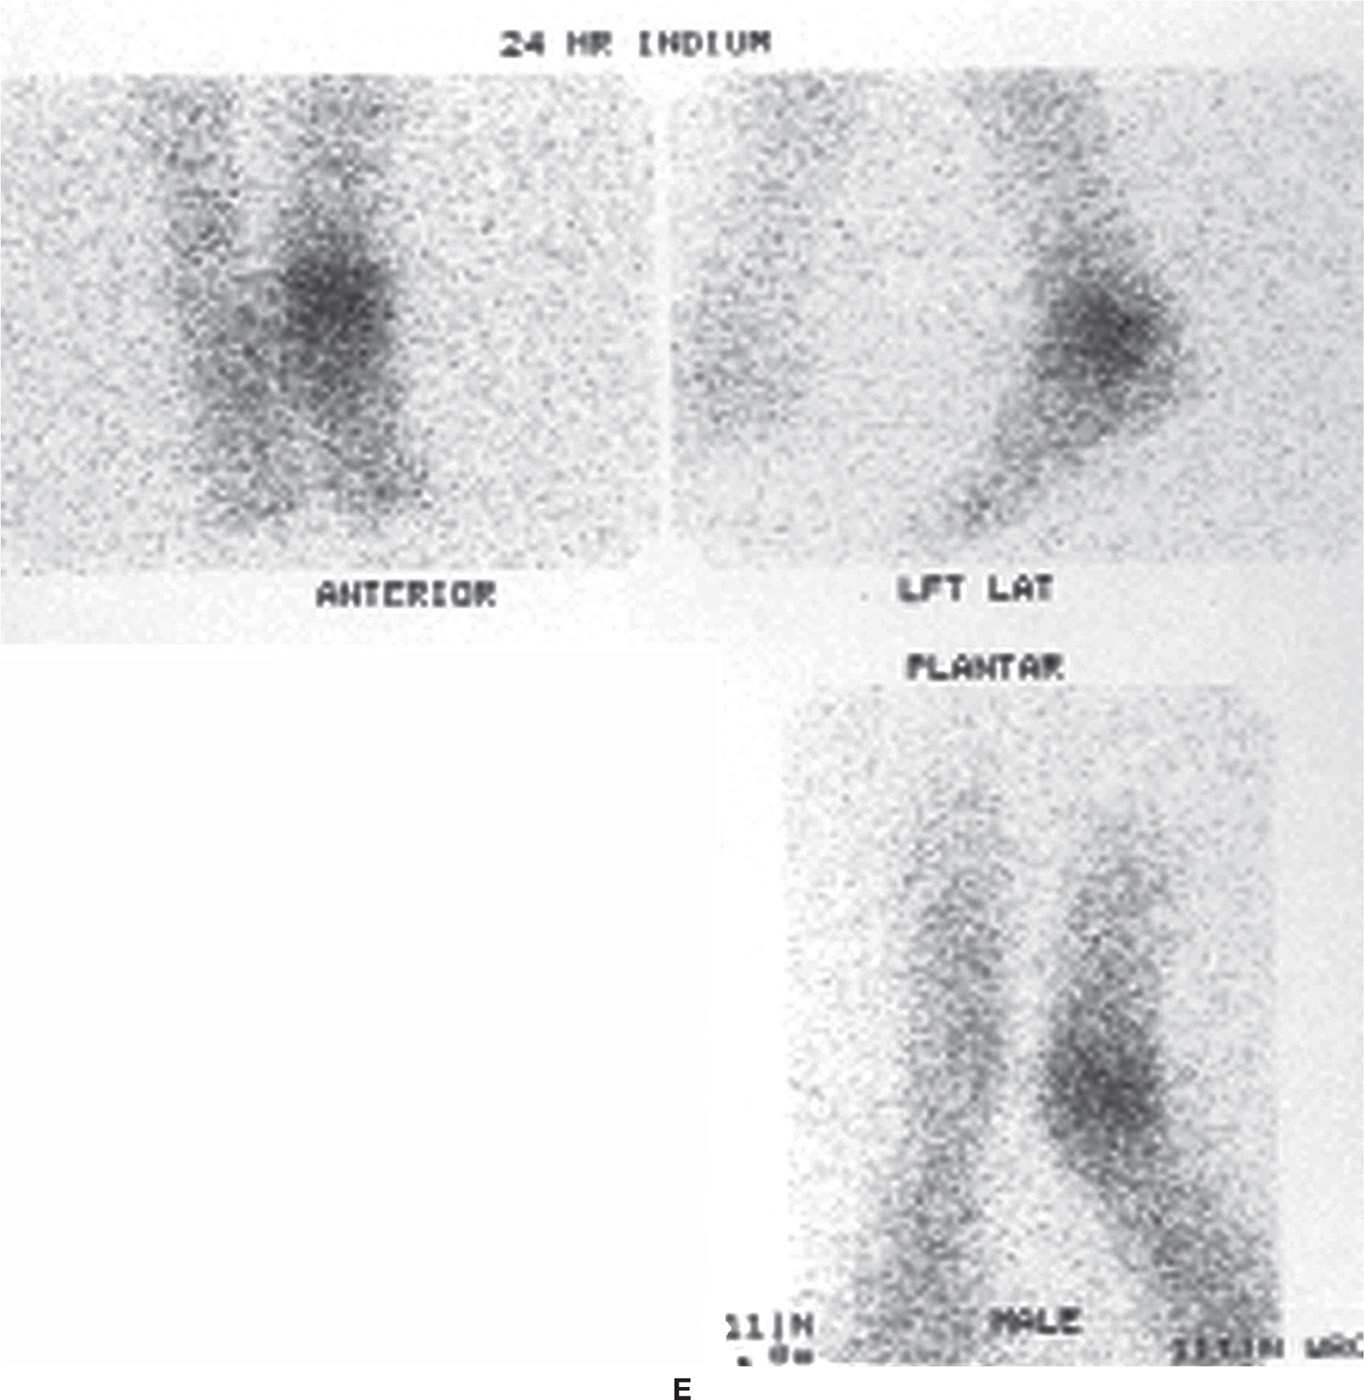
FIGURE 24-16. Combination of technetium, gallium, and indium scans for assessment of possible ankle infection. A: Bone scintigraphy, dynamic flow phase. B: Bone scintigraphy, blood pool phase. C: Bone scan (third phase). D: Gallium scan. E: Indium scan.
Technetium-99m sulfur colloid marrow imaging has been used with indium-111 to improve its sensitivity, specificity, and accuracy.94 Another preparation, indium-111-polyclonal IgG, was thought to be useful for evaluating infection and safer and easier to prepare than labeled leukocytes95; However, disadvantages include long imaging time and delayed pool clearance.93
In vivo white blood cell labeling has been performed using radiolabeled monoclonal antibodies (MoAb). Antigranulocyte antibodies (such as anti-NCA-95 immunoglobulin G [IgG], anti-NCA-90 Fab’, and anti-CD15) have been labeled with technetium-99m and were determined to accurately delineate infection and inflammation.93 However, they were not specific only for infection.
The newest generation of imaging tools involves CMI radioisotopes, which has expanded to become a hybridization of “molecular” imaging modalities with CT.
CELLULAR AND MOLECULAR IMAGING
CMI tools characterize and measure in vivo biologic processes at the cellular and molecular level. They demonstrate a shift from the macroscopic and nonspecific level to the microscopic and targeted scale of medical imaging. CMI allows the investigation of specific inflammation pathways (such as cell proliferation and metabolism) and may enable detection of inflammation at a very early stage.96 CMI techniques have recently been developed for use with nonradioisotopic, anatomic imaging modalities, including MRI and ultrasound. However, radioisotope techniques, positron emission tomography (PET) and single-photon emission computed tomography (SPECT), are currently the most commonly used “molecular” imaging modalities.96 These modalities also provide 3-D images of radiotracer uptake, versus the planar scintigraphy techniques discussed earlier in this chapter (technetium, gallium, and indium).97
Positron Emission Tomography
The most common radioisotope carrier for PET is deoxyglucose labeled with fluorine-18, or 18-fluorodeoxyglucose (FDG).98 FDG-PET was originally used for the diagnosis of neoplastic disorders but has expanded to include the diagnosis of different inflammatory conditions, including infection and the diabetic foot.99 Imaging with FDG-PET is used to determine sites of abnormal glucose metabolism; inflammatory cells (neutrophils, macrophages, and activated lymphocytes) will demonstrate an increased uptake of FDG.100 Phosphorylation prevents the glucose from being released again from the cell once it has been absorbed.101 The FDG-6-phosphate formed when FDG enters the cell thus cannot move out of the cell before radioactive decay.102
The PET tracer emits positrons via radioactive decay that are annihilated by electrons in the patient’s body; energy is released in the form of coincident photons that are emitted in opposite directions.98,103 The PET scanner is made up of blocks of scintillation crystals arranged in a ring that detect the annihilation photons, a process referred to as coincidence detection.104
In comparison to other nuclear imaging modalities, FDG-PET has the advantage of being able to provide results within 2 hours.100 The patient is injected with FDG approximately 90 to 120 minutes prior to a study limited to the extremities. (The level of circulating glucose and insulin can affect the FDG-PET study; therefore, the patient’s fasting glucose level may be tested prior to injection of FDG, which should fall in a range below 150 mg/dL.103) The patient must remain still for the entire study, which may require 30 minutes or longer.105
A bone scintigram may be positive years after a fracture, but the uptake of FDG usually normalizes after 2 to 3 months following a fracture, making it useful in evaluating chronic osteomyelitis with previous trauma.106 Furthermore, only faintly increased FDG uptake is usually seen with degenerative bone disease.107 FDG-PET also has a lower radiation dose when compared to gallium and indium but is greater than that of technetium-99m.108
The disadvantages of FDG-PET include its limited availability, high cost, and artifacts caused by patient movement.103,105 Additionally, FDG has a half-life that is not very long (112 minutes98), so patients must be scheduled very strategically throughout the day. Another issue with FDG-PET is the fact that it has a comparably low spatial resolution when measured against other techniques such as CT. However, this limit in anatomic detail is overcome by combining or “fusing” PET with CT, referred to as FDG-PET/CT (Figure 24-17).108 The PET/CT hardware is located on the same gantry but isolated mechanically.103
In comparison to imaging modalities such as CT, MRI, and ultrasound, FDG-PET is advantageous because it offers full body coverage, high sensitivity, an absence of artifact from metallic hardware, and a lack of reaction to pharmaceuticals.107 FDG-PET is also highly sensitive for chronic osteomyelitis detection in patients who have taken antibiotics before imaging.109
PET is noninvasive, but it does involve exposure to ionizing radiation. The total dose of radiation is not insignificant, usually around 5 to 7 mSv. However, in modern practice, a combined PET/CT scan is almost always performed and the radiation exposure may be substantial—around 23 to 26 mSv for a full body scan.106 However, a study limited to the extremities should lessen the CT dose considerably.
Single-Photon Emission Computed Tomography
A gamma-emitting radionuclide, such as gallium-67, technetium-99m, indium-111, or technetium-99m-HMPAO, is injected intravenously, as described previously. The radioisotope tracer emits gamma radiation that is measured directly by a gamma camera. In contrast to planar scintigraphy, the gamma camera rotates 360° around the patient; it stops at 6° intervals to detect and measure gamma ray emissions.98 A computer algorithm is applied to the tomographic “projections” to reconstruct a 3-D image.
The SPECT tracers last longer (having longer half-lives) than that of 18-FDG; this allows for scans to be performed during longer time frames, but also requires more time for the SPECT study to be completed. The resolution of SPECT is poor (approximately 1 cm) compared to that of PET (approximately 3 mm).104 SPECT is often chosen over PET simply as a cost issue, for less equipment is involved and fewer staff is required to perform the test.
SPECT combined with CT (SPECT/CT) provides the benefits of the high anatomic resolution of CT imaging and the high functional specificity of SPECT imaging with labeled white blood cell. This has proven to be beneficial in diagnosing and monitoring osteomyelitis. Cortical destruction and erosion secondary to osteomyelitis can be imaged well with the CT component of the hybrid imaging.110 Although MRI has long been considered the gold standard for assessing osteomyelitis, SPECT/CT shows excellent potential. The sensitivity and negative predictive value of SPECT as well as its ability to localize the infection were similar or better than MRI for assessing osteomyelitis.111 Aslangul et al.111 also reported that SPECT/CT correlated with bone biopsy in confirming osteomyelitis. SPECT has also been able to assess the severity of the osteomyelitis and its response to therapy.112
As technology advances, SPECT/CT fusion should improve; its use for lower-extremity imaging shows great promise. In addition to diabetic foot infection, potential applications include the diagnosis of early stress fracture, symptomatic tarsal coalition, postoperative evaluation of arthrodesis, and painful accessory bone syndrome.113 The radiation dose for a combined SPECT/CT study is similar to that of PET/CT.
CROSS-SECTIONAL IMAGING STUDIES
Complex skeletal areas, especially where irregular bones are superimposed on other bones, are difficult to assess with standard radiographic techniques. This is especially true in the tarsus and ankle regions. Cross-sectional imaging studies allow a single plane of interest to be examined while differentially blurring or eliminating all other structures that normally would be superimposed and impair visualization. Conventional tomography, CT, and MRI are modalities used for evaluating complex skeletal regions of the foot and ankle. In addition, CT and, more importantly, MRI provide images of soft tissue structures that cannot be visualized by radiography.
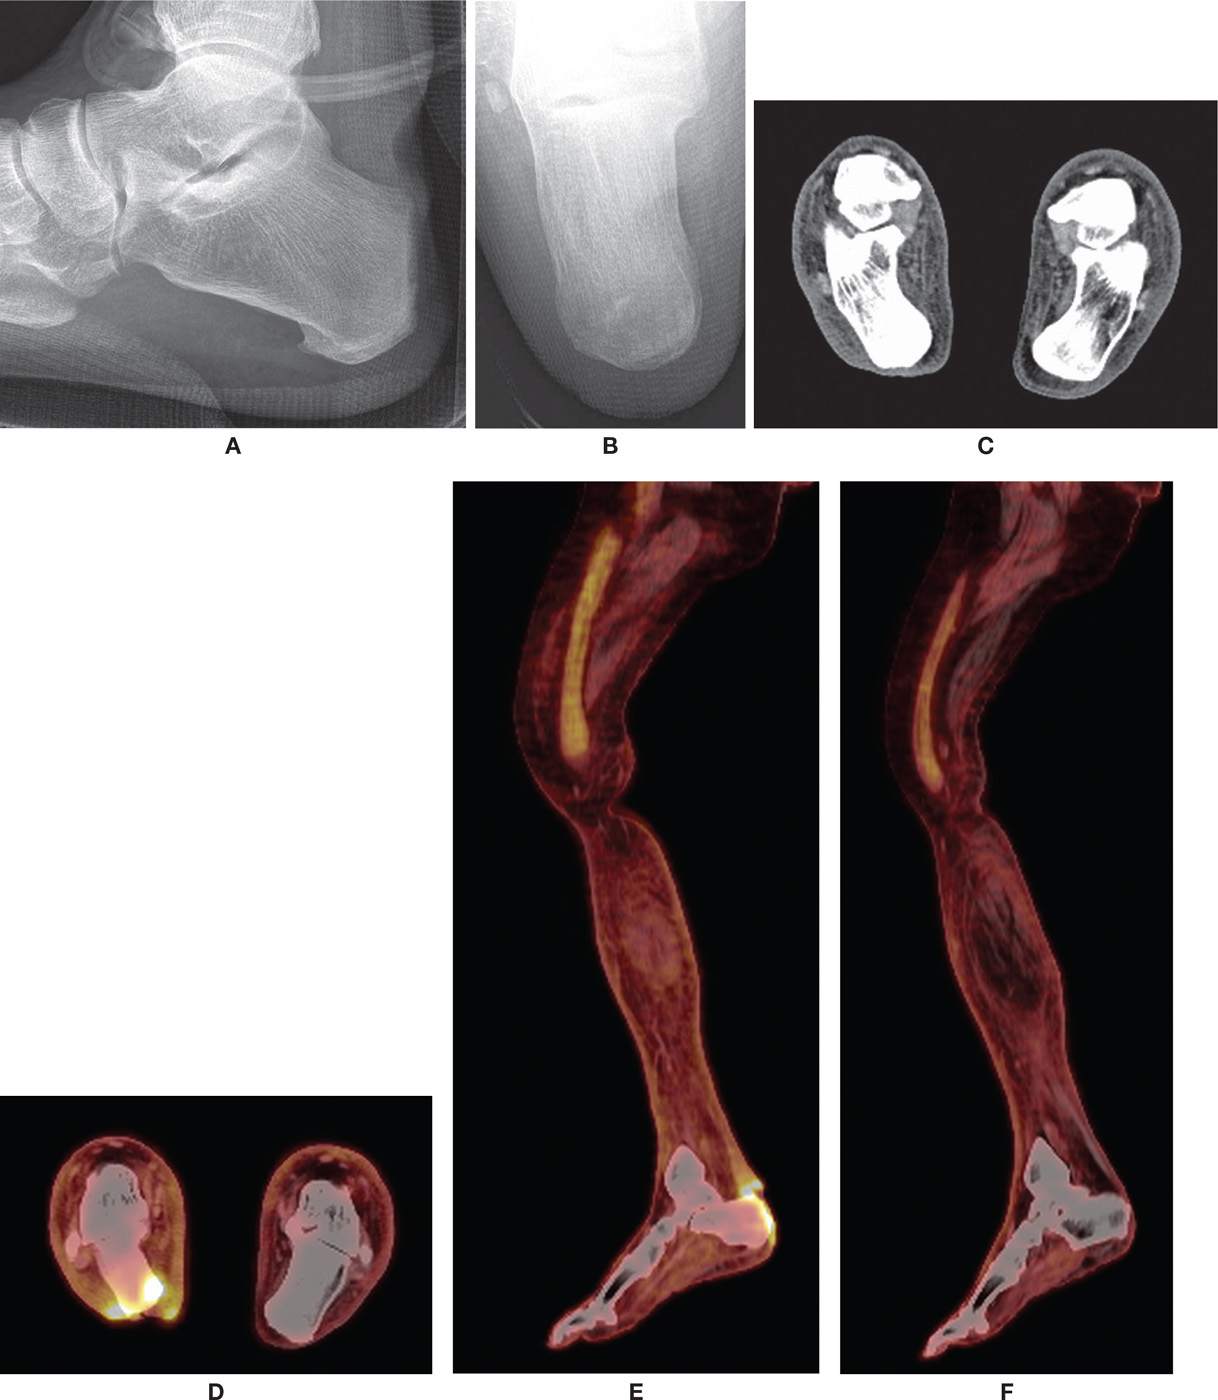
FIGURE 24-17. PET/CT scan. Patient had a posterior calcaneus ulcer with suspicion of underlying osteomyelitis. Radiographs and CT were equivocal. A: Lateral radiograph. B: Calcaneal axial radiograph. C: CT coronal plane image. D: PET/CT coronal plane image demonstrating increased uptake along the inferior calcaneus, consistent with infection. E: PET/CT sagittal plane image demonstrating increased uptake along the posterior left calcaneus, consistent with infection. F: PET/CT sagittal plane, normal opposite extremity for comparison.
Conventional Tomography
Conventional tomography is the least expensive of the three cross-sectional modalities but yields an image that is far inferior to CT and MRI. It is a variation of the simple radiograph method. The x-ray tube head and image receptor move in opposite directions about a fulcrum but in parallel planes; the fulcrum corresponds to the plane of the focal area of interest.114 Structures above and below or to the sides of the plane of interest are blurred. Foot sections are typically obtained at 0.5-cm intervals. Osseous structures that are not clearly identified with radiographs (such as the tarsal bones) may be more clearly seen with tomography (Figures 24-18 and 24-19). Applications where this study may be useful include tarsal coalition, tarsal fracture, subtalar arthritis, osteocartilaginous lesions, loose bodies, and fracture healing.115 A major disadvantage is the increased radiation dose compared to CT and standard radiography.116
Computed Tomography
CT generates cross-sectional, 2-D images of the body after computerized interpolation algorithms reconstruct multiple x-ray projections. Images can be obtained in axial and coronal planes; reformatted computer images in the sagittal plane and 3-D images can also be obtained.117 The slice thickness recommended for foot and ankle pathology is 1 mm; submillimeter-thick slices have been recommended for the tarsus.118 Indications include those mentioned for conventional tomography; in fact, CT may very well have eliminated the need for conventional tomographic imaging of foot and ankle pathology.119 It is useful for evaluating subtalar joint pathology120 and is valuable for the assessment of calcaneal fractures,121,122 including 3-D reconstruction.123 Although CT can evaluate soft tissue pathology, which can also be enhanced by using an iodinated contrast agent (Box 24-2), MRI is usually reserved for this purpose.
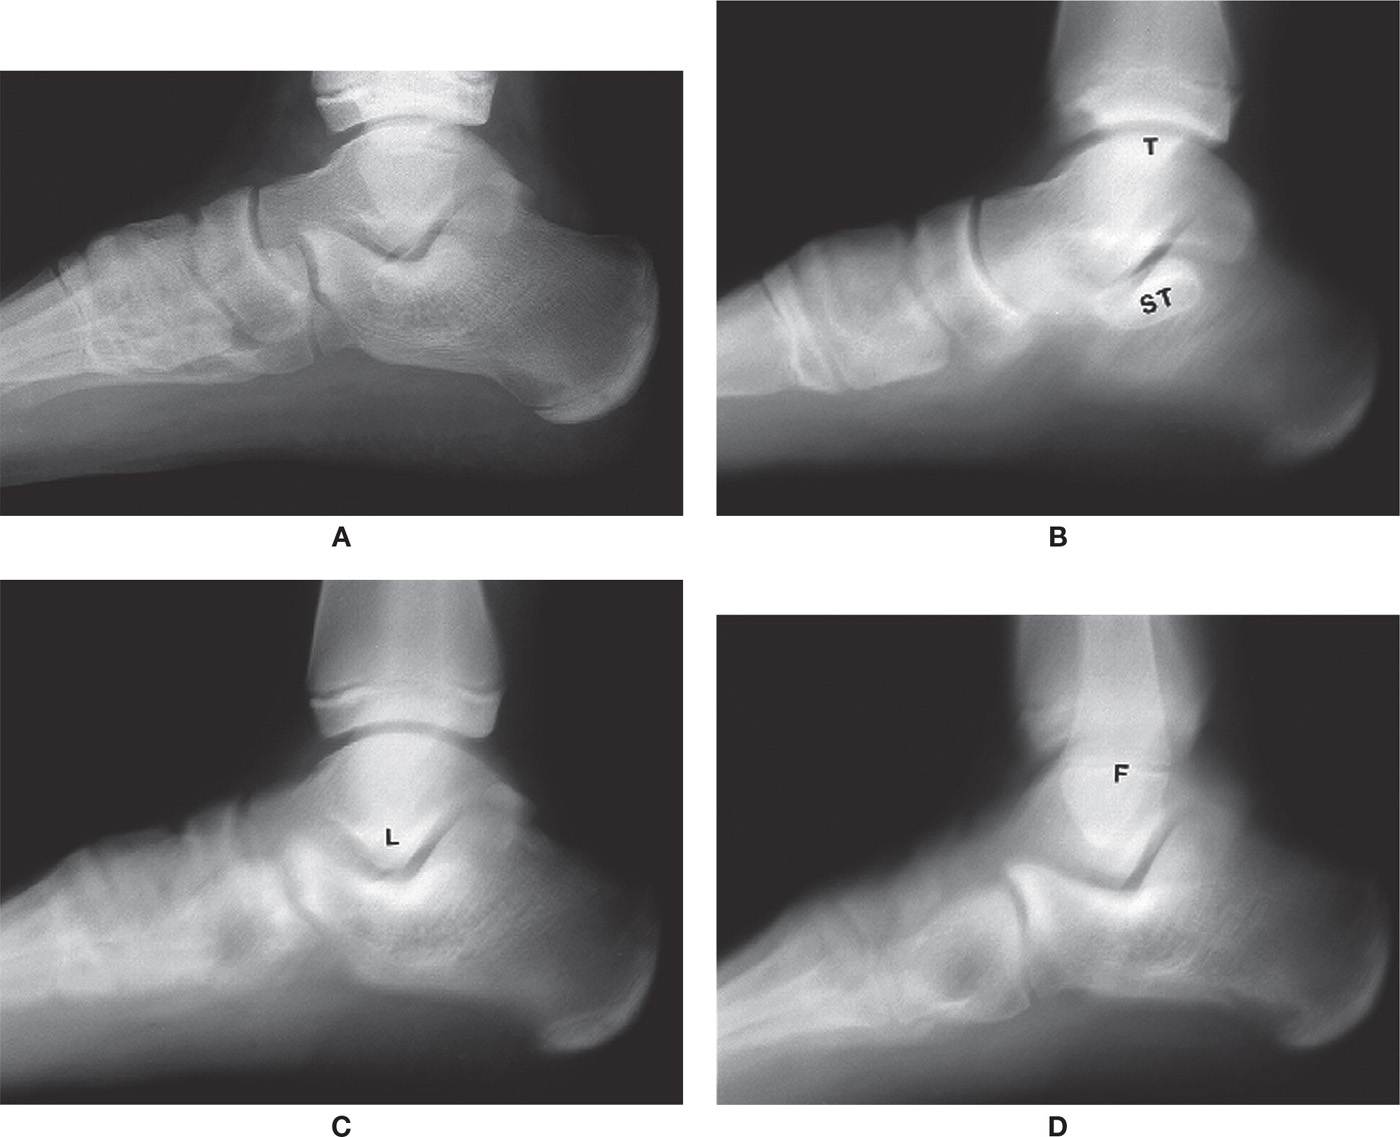
FIGURE 24-18. Conventional tomography, lateral foot view, sagittal sections (ST, sustentaculum tali; T, tibial malleolus; L, lateral talar process; F, fibular malleolus). A: Radiograph. B: Section at 7.5 cm (from lateral side of foot). C: Section at 6 cm. D: Section at 4 cm.
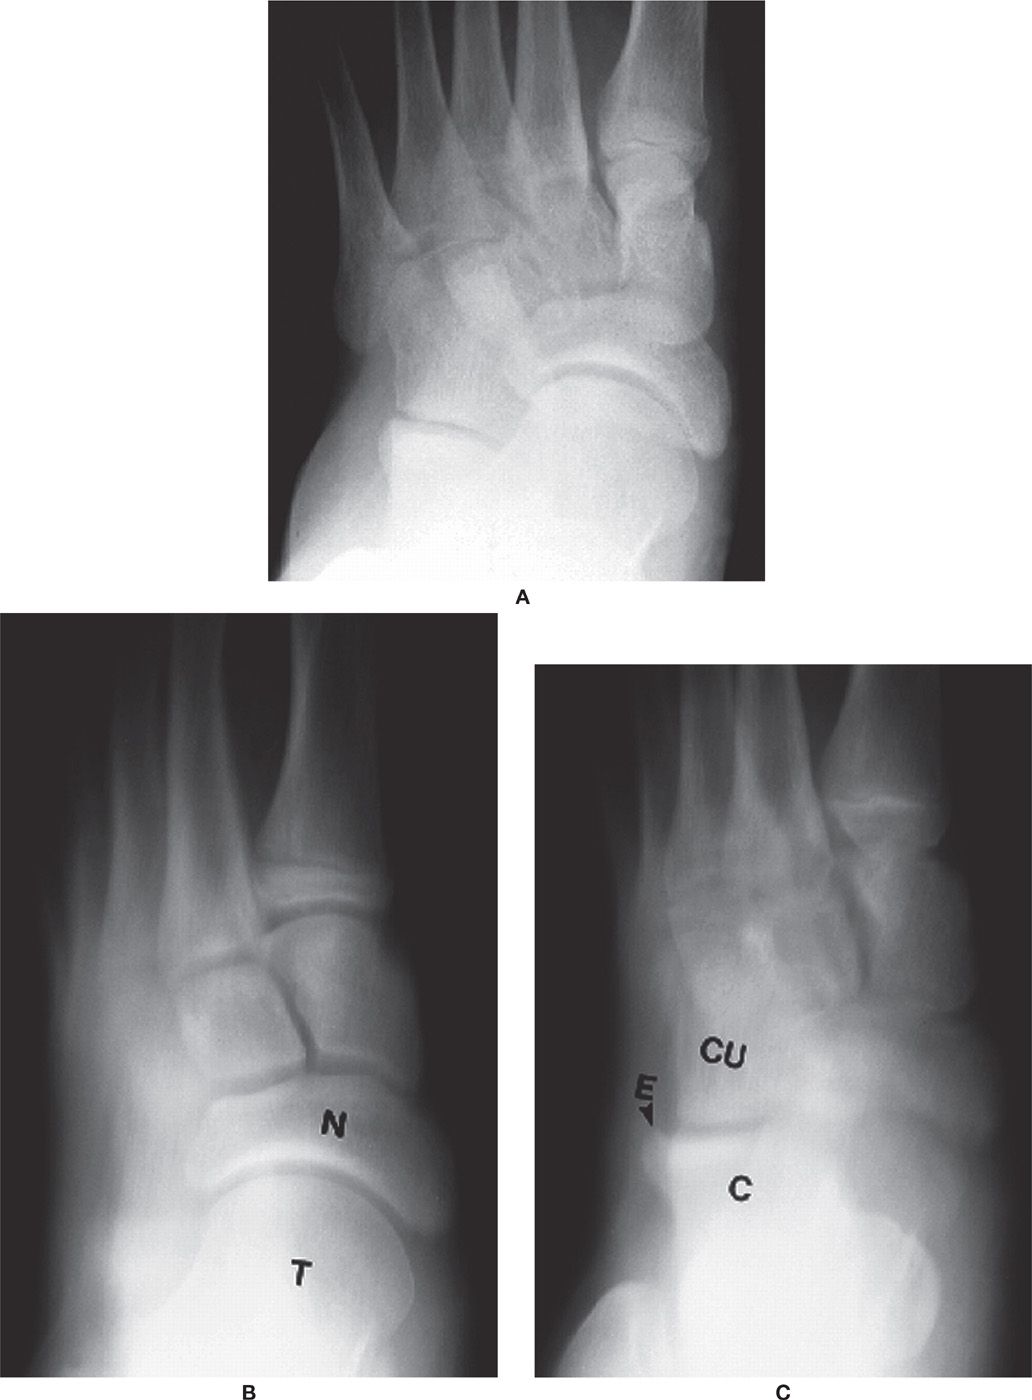
FIGURE 24-19. Conventional tomography, dorsoplantar foot view, transverse sections (T, talus; N, navicular; C, calcaneus; CU, cuboid; E, exostosis). A: Radiograph. B: Section at 7.5 cm (from sole of foot). C: Section at 5.5 cm.
CT has the advantage of high-contrast resolution; that is, it can distinguish between two tissue types that have only slightly different attenuation characteristics.124 Overlying tissue blurring found with conventional tomography is not seen in the CT image. The patient’s extremity is placed inside the gantry of the unit. An x-ray tube rotates 360° around the extremity.125 A ring of sensitive radiation detectors around the gantry measure the x-ray beam after it is transmitted through the patient. Attenuation values (also known as CT numbers) can be determined for all tissues and are expressed as Hounsfield units (HU). In addition, the image can be software adjusted so that either soft tissue or bone is more visible; these are referred to as soft tissue and bone windows, respectively (Figure 24-20).
A newer generation (VI) of CT is known as spiral or helical CT. It improves on the previous generations of CT by reducing motion blur, imaging time, and partial volume artifact. The patient slowly moves mechanically through the gantry as the x-ray tube rotates continuously in one direction; hence the terms helical and spiral CT. As a result, the overlapping images improve contrast resolution, high-contrast multiplanar (3-D) images can be obtained, and shaded surfaces can be displayed to enhance the 3-D effect.
Recently, multidetector CT (MDCT, generation VII) has significantly improved on conventional (fan-beam) helical CT by incorporating multiple rows of detector rings and using cone-beam reconstruction.118,126 This increases the patient area covered by the x-ray beam, allowing multiple slices per each tube rotation to be acquired.
One of the newest modalities for imaging the lower extremity uses cone-beam technology.127 The scanner is small enough for in-office use. It can be used for weight-bearing and non–weight-bearing views.
Magnetic Resonance Imaging
Unlike conventional and computed tomography, MRI does not use ionizing radiation. High-quality images are obtained as radio frequency (RF) pulses are absorbed and then reemitted by the extremity that is positioned inside a large magnet.128 Simply speaking, the patient is placed in a very strong magnetic field. The body’s protons align with the external magnet. The anatomic area of concern is subjected to sequences of very short RF pulses. During intervals between the RF pulses, detectors receive signals from the body tissues. The signals are processed by a computer and converted into high-resolution images that are displayed on a computer monitor.
There are three principle parameters that the MR imager detects and converts into pixel character: SD (spin density, aka proton density), T1 (spin-lattice relaxation time), and T2 (spin-spin relaxation time). Each parameter has different values for various tissues, providing imaging contrast, which, therein, lays the great diagnostic value of MRI.
Protons in different tissues have different properties. And, each body tissue has a characteristic SD, T1, and T2. MR generates images in which unique tissues can be distinguished from each other by applying differing combinations of RF pulses in a pulse sequence. Pulse sequences differ in the number, strength, and timing of these pulses.
Pure SD, T1, and T2 images are not usually obtained but are combined and “weighted”; RF pulse sequences are used to produce images that blend the SD, T1, and T2 characteristic of tissues.
The weighted images determine image contrast and can suppress or enhance tissue/pathology. Examples of RF pulse sequences are listed in Box 24-4. Parameters distinguishing between T1- and T2-weighted images are listed in Box 24-5.
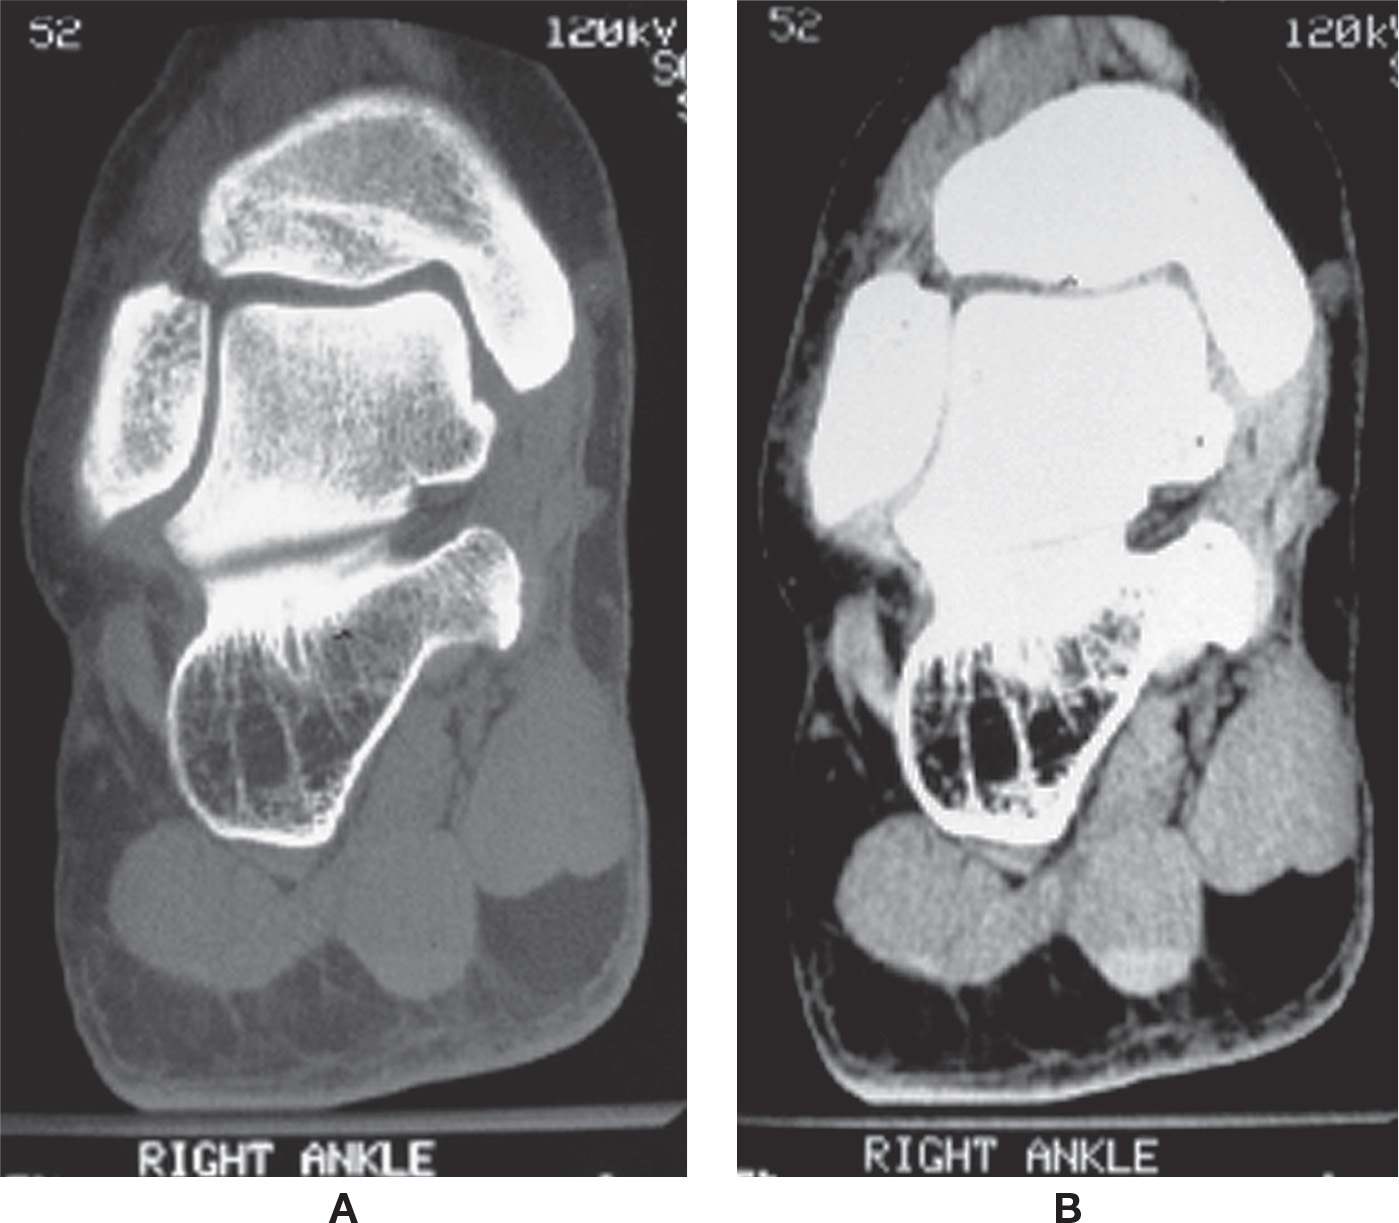
FIGURE 24-20. CT, ankle/rearfoot (coronal plane). A: Bone window. B: Soft tissue window.
BOX 24-4 Examples of Different MRI Pulse Sequences
T1-weighted image
T2-weighted image
Proton density–weighted image (marrow)
Partial saturation (SD-weighted image)
Inversion recovery
Spin echo (SE), Fast spin echo (FSE)
Gradient echo (cartilage)
STIR (short tau inversion recovery)
Related posts:

Stay updated, free articles. Join our Telegram channel

Full access? Get Clinical Tree


