Osteonecrosis and Osteochondrosis
ROBERT A. CHRISTMAN, CRISTINA MARCHIS-CRISAN, AND RANDY E. COHEN
Osteonecrosis and osteochondrosis are two radiographically similar disorders associated with multiple etiologies. Overlap between these disorders often confuses the novice. Osteonecrosis can affect either epiphyseal or nonepiphyseal bone and demonstrates distinct pathologic features that can occur in all age groups. Trauma is probably the most common etiology of osteonecrosis in the foot. Osteochondrosis, however, represents a group of disorders with similar radiographic features affecting epiphyses and apophyses only; they have been associated with three underlying etiologies: osteonecrosis, trauma without underlying osteonecrosis, and variant ossification.1 Osteochondral injury is often discussed in relation to osteonecrosis and osteochondrosis; the latter has been considered a juvenile form of osteochondral injury.2
OSTEONECROSIS
Osteonecrosis, or bone death, results from bone ischemia. Several terms have been used synonymously with osteonecrosis: ischemic necrosis, avascular necrosis, aseptic necrosis, and bone infarct. Osteonecrosis is the death of bone tissue due to a lack of blood supply.3 This may be due to interruption of the arterial supply or occlusion of the venous drainage, resulting in stasis and oxygen deprivation.4
Osteonecrosis is defined as massive death of bone and bone marrow, occurring as the most predominant or only abnormality.5 Causes may be local, related to pathology causing major stress to bone, such as infection, fracture, tumor, and severe osteoarthritis. It has also been reported postoperatively, for example, at the first metatarsal head following osteotomy for bunion correction.6 Systemic causes include alcohol abuse, corticosteroids, pancreatitis, systemic lupus erythematosus, caisson disease, Gaucher disease, gout, sickle cell disease, and hyperlipidemia; about 25% of the cases are iatrogenic.5,7–9 Etiologic theories that involve alterations of lipid metabolism include fat emboli causing vascular occlusion, sludging and hemorrhage, and a systemic buildup of lipid in the marrow that compromises vascular space. The elevated cholesterol content in the necrotic tissues may contribute to cell death by altering membrane metabolism.10
Bone death is followed by attempts at repair, which include revascularization, resorption of dead bone, and reossification. All osteonecroses undergo this sequence of events.11
Since dead bone has no vascular supply, its density does not change radiographically. It is the healing process that causes the subsequent radiographic changes.12 Initially, before the healing process has begun, the necrotic bone appears the same density as the viable surrounding bone. No appreciable changes have yet occurred radiographically. If hyperemia is present, the surrounding viable bone becomes osteopenic. The necrotic bone does not change density. However, the necrotic segment relatively appears more radiodense than the osteopenic bone surrounding it.
Healing varies radiographically depending on the anatomic site and vascular status of the area. In general, as revascularization and resorption occur around the area of necrosis, a radiolucent rim appears. Fibroblastic ingrowth within the necrotic bone may appear as irregular radiolucencies, which can give the radiographic appearance of fragmentation. New bone being laid down on necrotic trabeculae causes an absolute increased bone density and appears more radiodense than normal bone. If the dead trabeculae are reabsorbed, the bone regains its normal density.4,11–13
Osteonecrosis occurs most commonly within the epiphysis during skeletal development and the metaphyseal/diaphyseal marrow cavity of an adult long tubular bone. The femoral and humeral heads are common epiphyseal sites, but the lesser metatarsal heads are also affected.7 Osteonecrosis also involves irregular bones such as the talus and calcaneus, which varies in etiology, size of area affected, and age predilection.
Osteonecrosis can affect any bone in the foot or ankle, especially in chronically ill children on long-term steroid therapy. Common sites affected include the talar dome, navicular, and second metatarsal distal epiphysis. MRI (magnetic resonance imaging) is often used to identify and characterize osteonecrosis in its early stages when radiographs are normal and to assess progression over time.14
Radiographically, diametaphyseal osteonecrosis (commonly referred to as bone infarct) differs significantly from epiphyseal osteonecrosis. Diametaphyseal infarct shows nothing radiographically for weeks or months. As necrotic bone is reabsorbed and repair occurs, an area of serpiginous calcification and ossification surrounds a lucent region (Figure 17-1). The entire area often calcifies (Figure 17-2).11
Epiphyseal osteonecrosis (commonly referred to as ischemic or avascular necrosis), in contrast, affects the weight-bearing capacity of the joint and results in concomitant changes of the articulating cartilage and underlying subchondral bone. The radiographic appearance of epiphyseal osteonecrosis varies depending on its stage of repair. Initially radiographs are normal. Early findings include osteopenia mixed with ill-defined sclerosis (Figure 17-3). A radiolucent fracture line that parallels the subchondral bone plate, referred to as the crescent line (Figure 17-4), follows. The weakened subchondral bone collapses, with subsequent deformity of the epiphysis (Figure 17-5). Osteoarthritis develops secondarily (Figure 17-6).
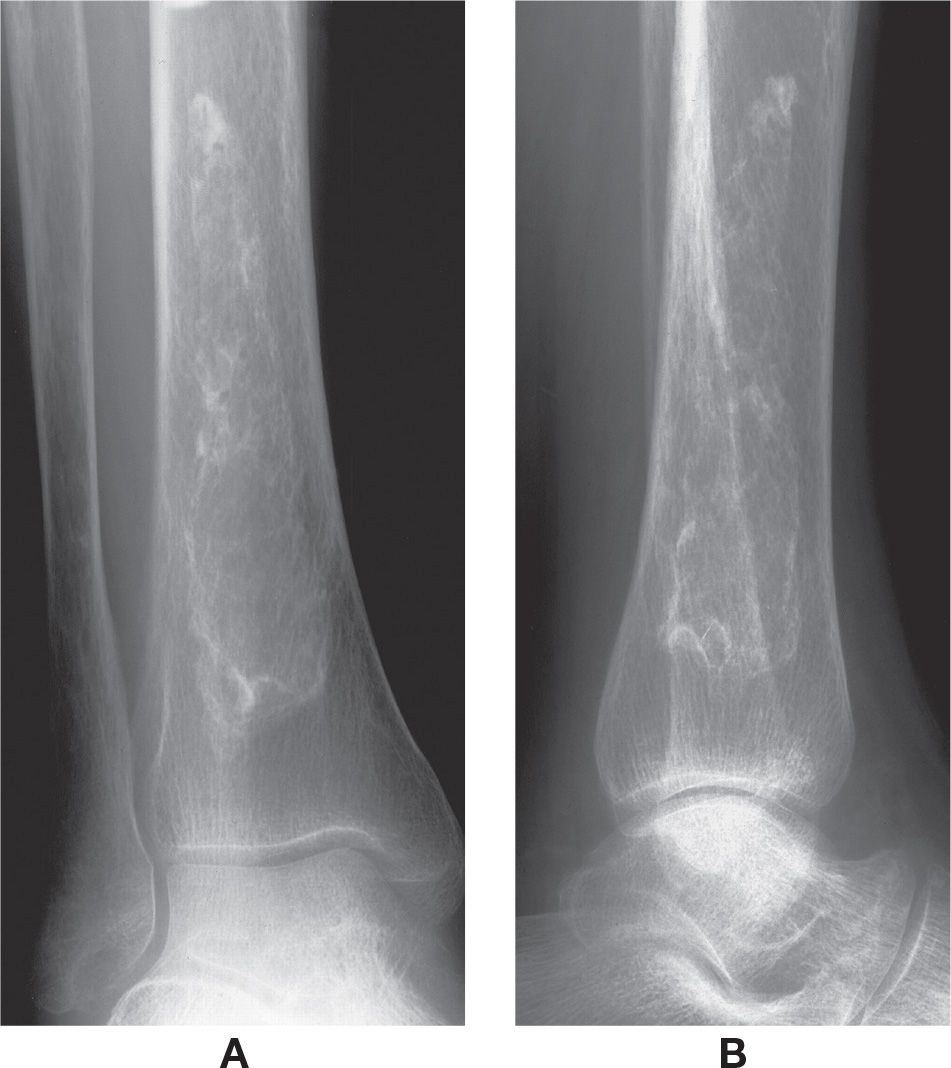
FIGURE 17-1. Bone infarct/diametaphyseal osteonecrosis, distal tibia. Classic appearance, a large, serpiginous calcification surrounding an area of relative lucency. A: Mortise view. B: Lateral view.
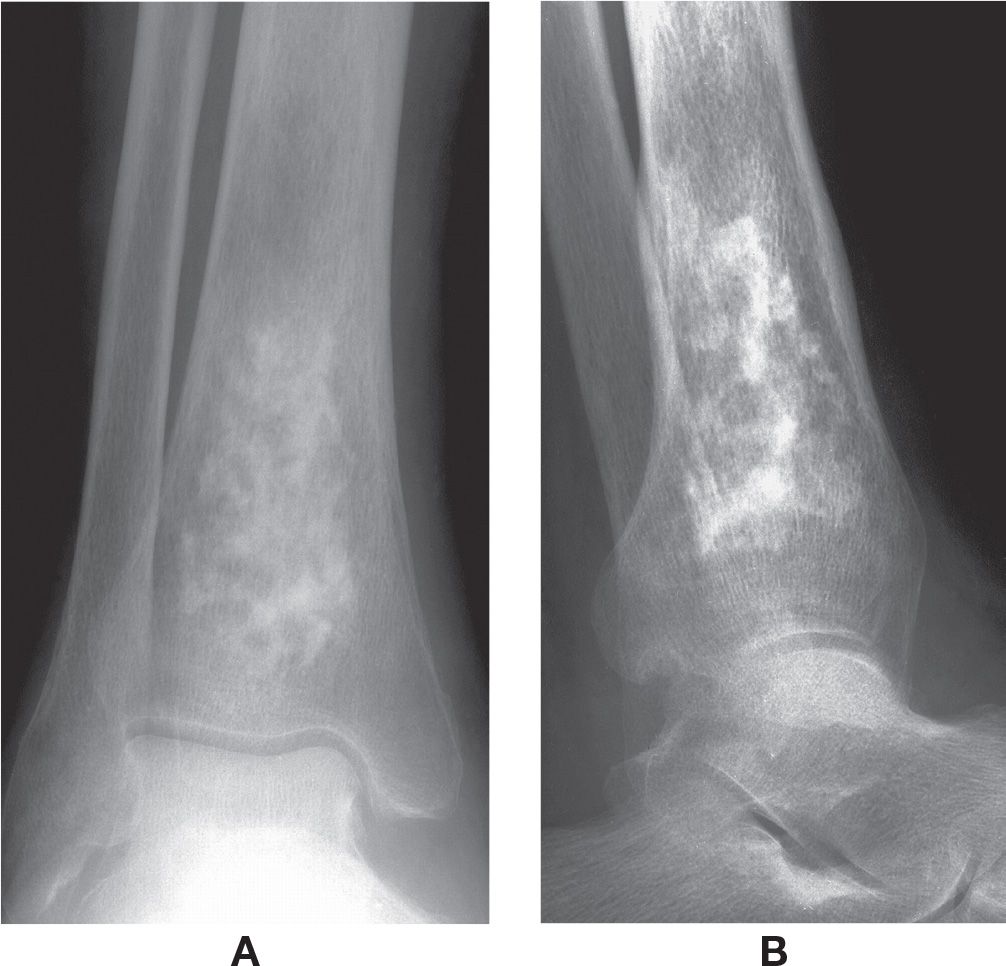
FIGURE 17-2. Bone infarct/diametaphyseal osteonecrosis, distal tibia. Nearly solid calcification. A: Anteroposterior view. B: Lateral view.
Osteonecrosis of irregular bone may be radiographically similar to the appearance of bone infarct in diametaphyseal bone (Figure 17-7). However, posttraumatic osteonecrosis in certain bones, such as the talus and navicular, eventually demonstrate sclerosis following normal radiographs (Figure 17-8). In the traumatized talus, with patent vascularity, Hawkins15 described a linear radiolucency that parallels the articular surface of the talar dome, now referred to as Hawkins sign. This finding may be found in other bones as well (Figure 17-9).
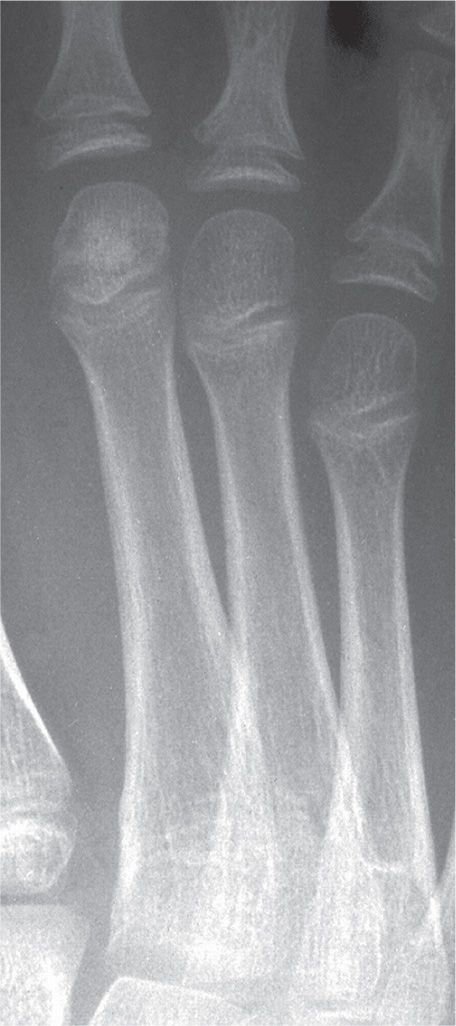
FIGURE 17-3. Epiphyseal osteonecrosis, second metatarsal. Centralized sclerosis mixed with ill-defined rarefaction.
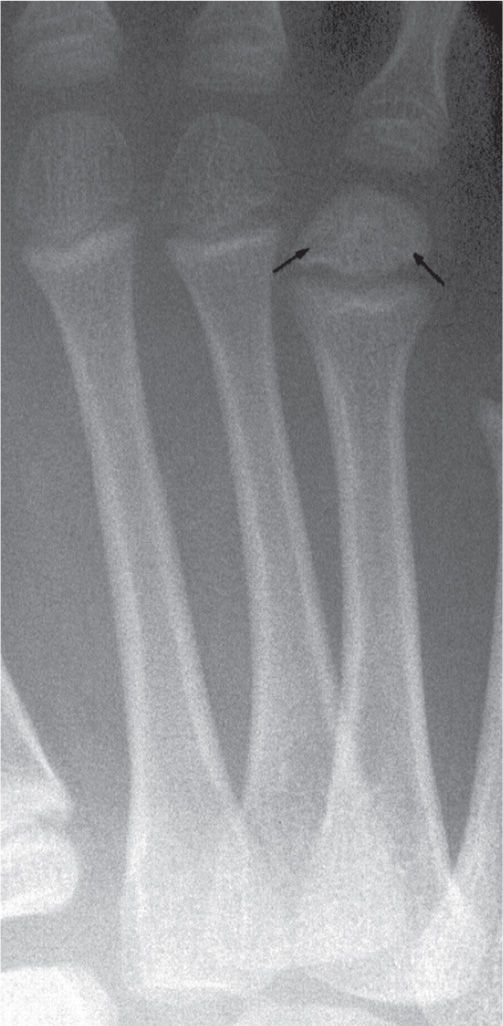
FIGURE 17-4. Epiphyseal osteonecrosis, fourth metatarsal. Collapse of subchondral bone; an ill-defined curvilinear radiolucency parallels the subchondral surface, the “crescent” sign (arrows).
Dysbaric osteonecrosis (caisson disease), which occurs in people who work with compressed air (high-pressure environments), was first described by Bornstein and Plate.16 Bone infarction occurs during decompression; at lower atmospheric pressure, nitrogen leaves solution and forms bubbles in its gaseous state. These nitrogen bubbles can occlude vessels and are thought to cause the characteristic bilateral osseous lesions.4 Histopathologic changes suggest that a disturbance of blood supply caused by platelet aggregation, red cell sludging, and thrombosis associated with intravascular air bubble formation is related to the occurrences of osteonecrosis in divers.17 Radiography demonstrates large bilateral and symmetrical serpentine lesions. The lesion is initially radiolucent with a calcific or ossific rim and usually calcifies over time.11 Juxta-articular lesions may progress to fragmentation and structural failure of the subchondral plate, resulting in symptomatology and osteoarthritis.18
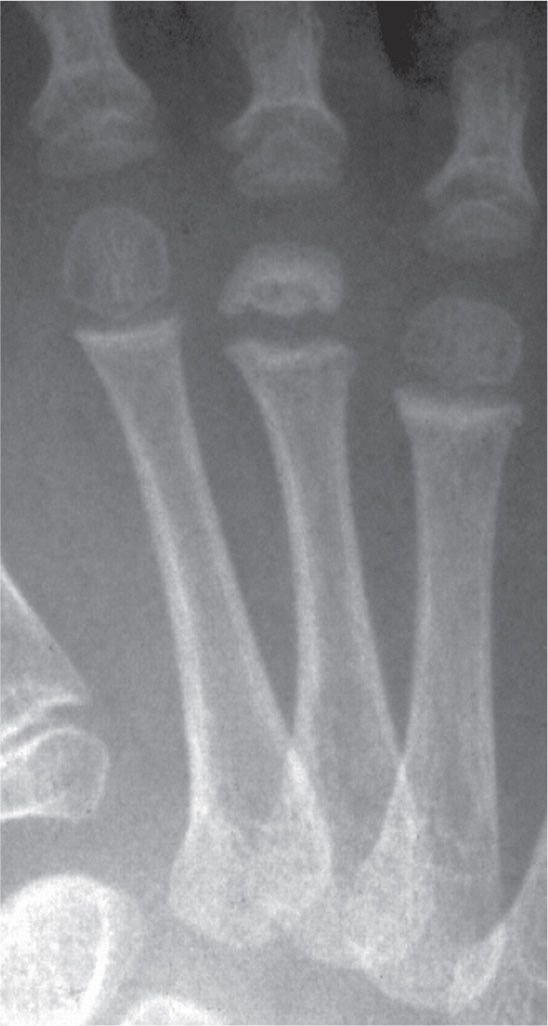
FIGURE 17-5. Epiphyseal osteonecrosis, third metatarsal. Flattened subchondral surface, fragmentation of epiphysis resulting in large, central loose body.
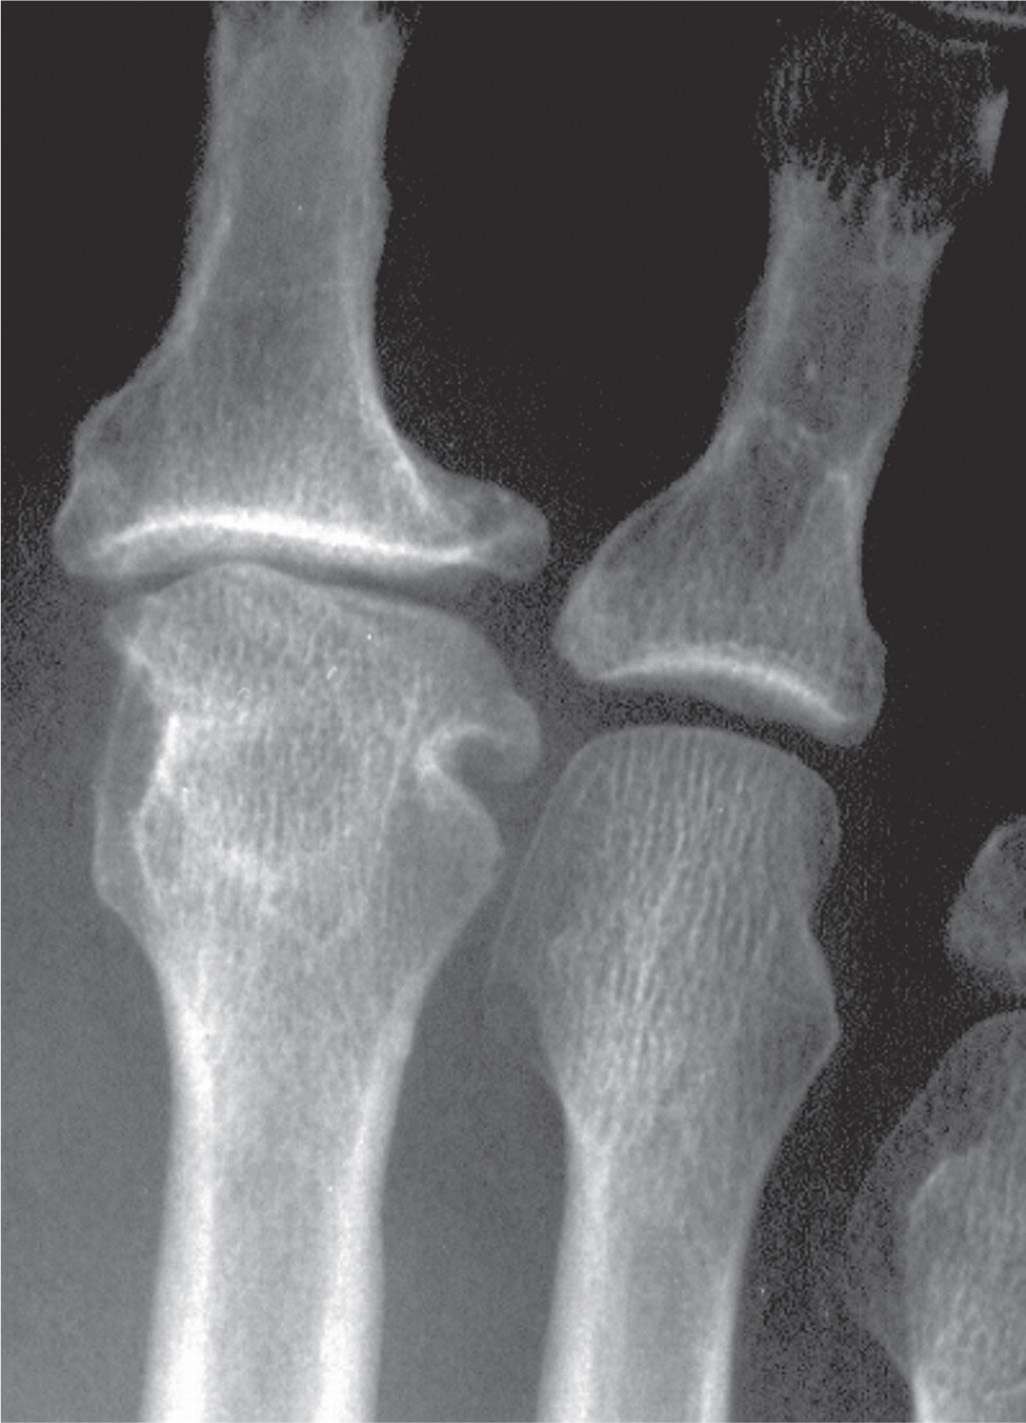
FIGURE 17-6. Old, healed epiphyseal osteonecrosis, second metatarsal, and secondary osteoarthritis. The second metatarsal head and proximal phalangeal base are flattened and deformed with increased girth, along with osteophyte formation and uneven joint space narrowing.
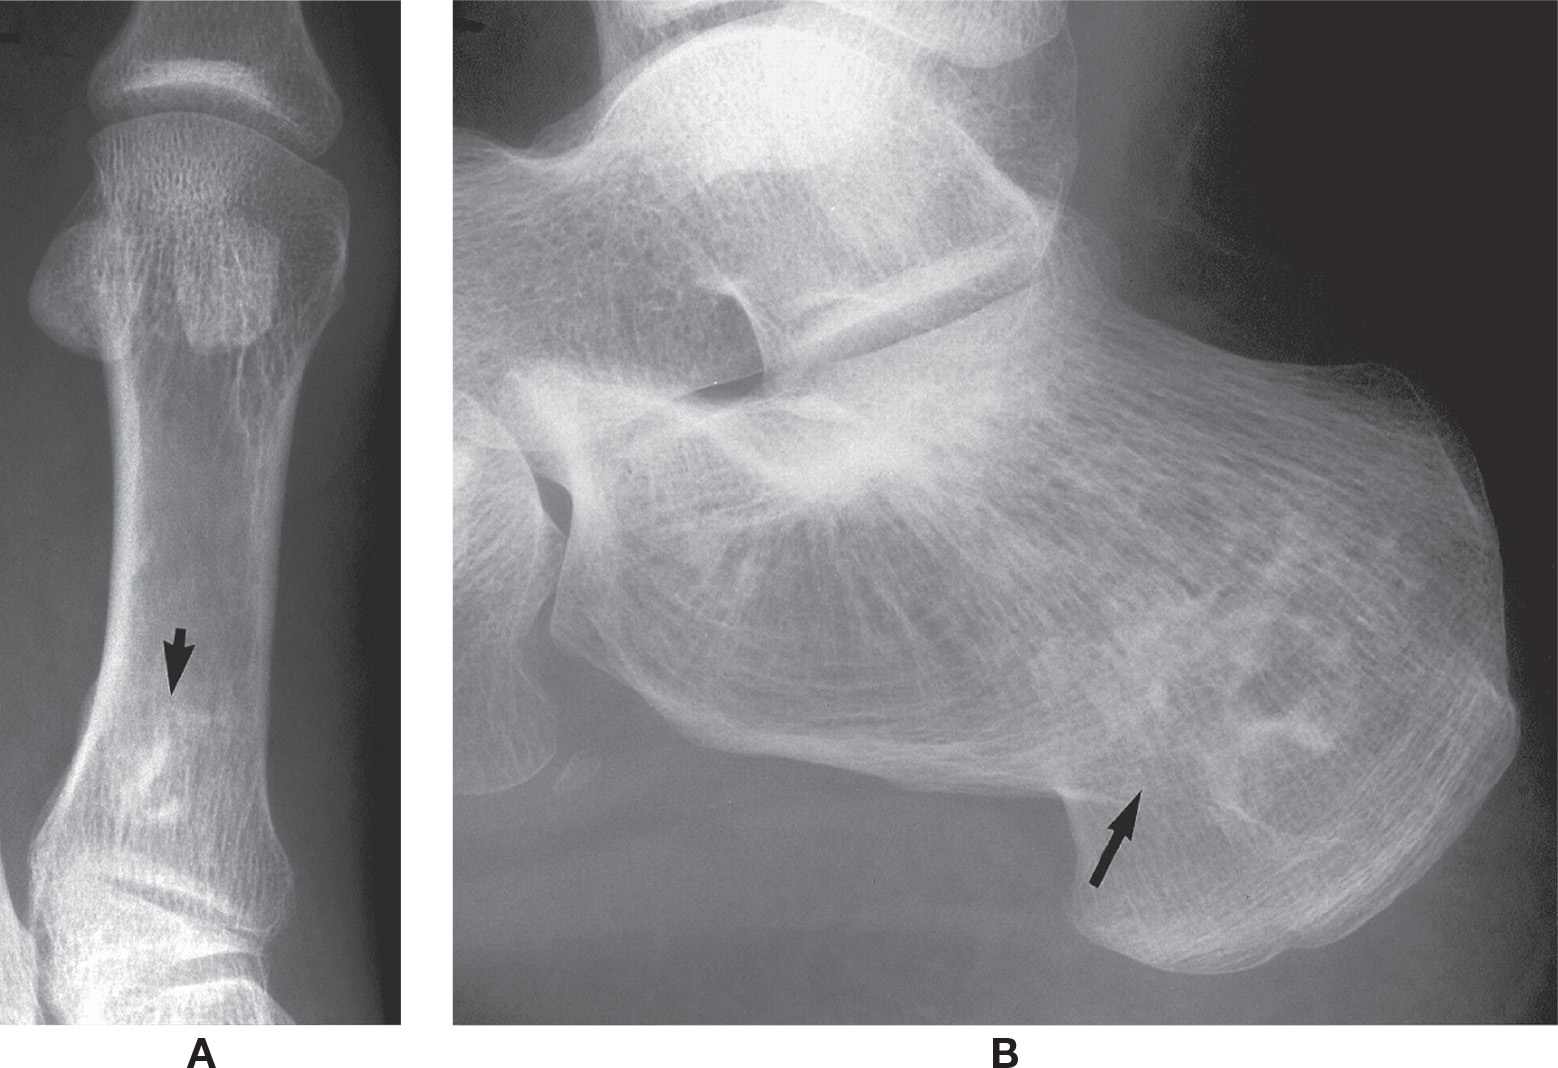
FIGURE 17-7. Osteonecrosis of diametaphyseal and irregular bones (arrows). A: First metatarsal. B: Calcaneus. Note the serpiginous calcification similar to that seen in the diametaphyseal infarct.
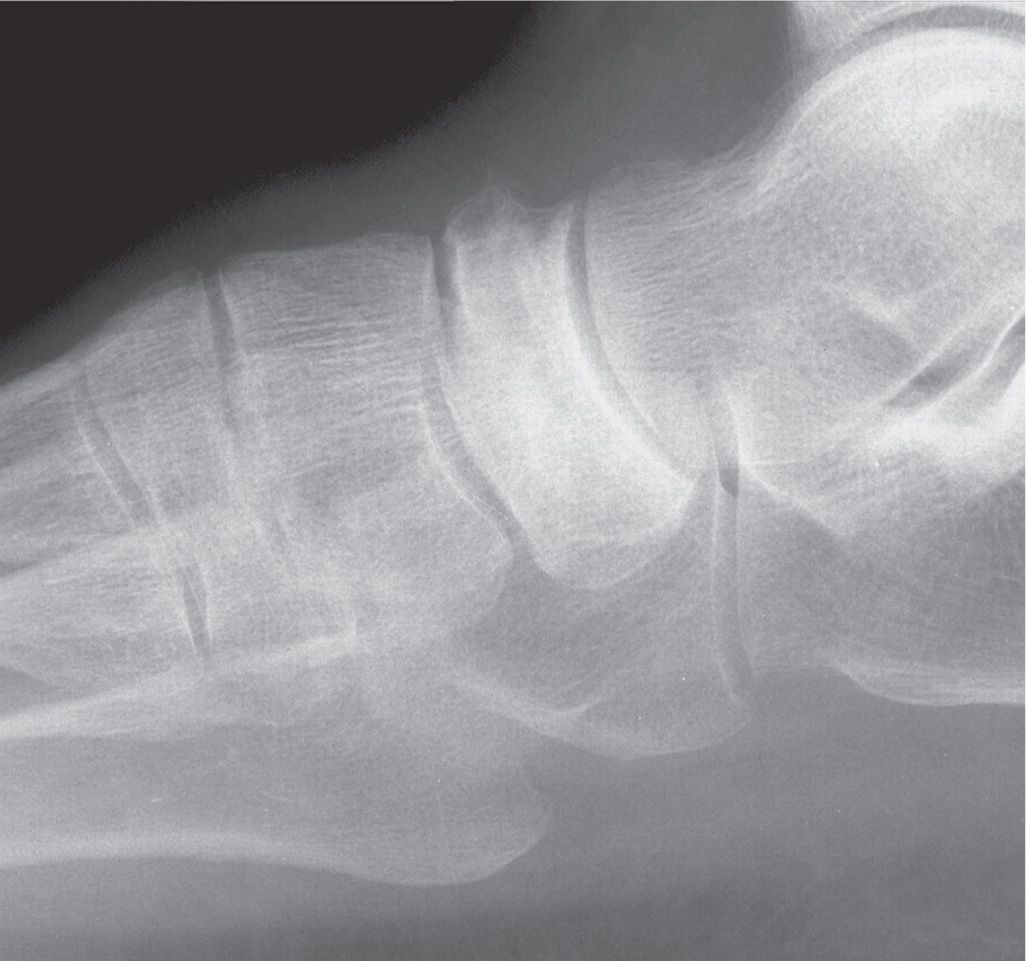
FIGURE 17-8. Healed osteonecrosis of an irregular bone, the navicular. It is sclerotic and deformed.
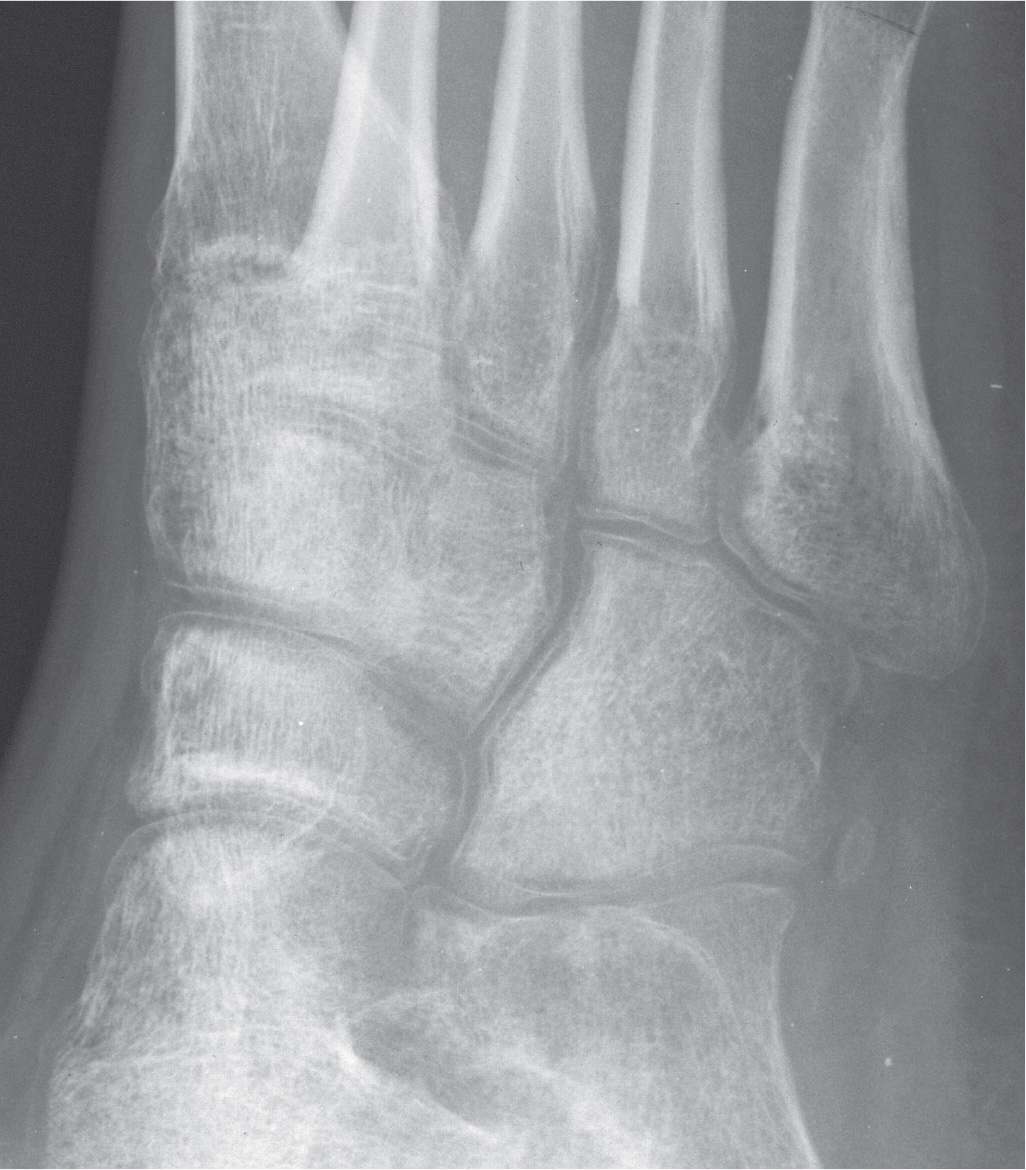
FIGURE 17-9. The concept of Hawkins sign applies to other bones as well. Note the linear radiolucency that parallels the outer margin of every bone in the medial oblique view. This is a result of acute osteopenia, and depicts a patent blood supply to bone.
Gaucher disease is a metabolic disorder in which cerebrosides are deposited in the cells of the reticuloendothelial system. The skeletal changes are a result of the infiltration of the marrow with cerebrosides that occlude the vessels and produce osteonecrosis.19 Early radiographic changes of femoral head osteonecrosis include osteopenia of the distal femur that progressively expands the cortex distally to a contour resembling an Erlenmeyer flask.19,20
The hemoglobinopathies are subdivided into two groups. The first group, sickle cell anemia, results from an inherited structural alteration in one of the globin chains. The second group, the thalassemias, results from inherited defects in the rate of synthesis of one or more of the globin chains.21
The fundamental abnormality in sickle cell disease resides in the abnormal structure of the globin portion of the hemoglobin molecule. Sickle cell hemoglobin (HbS) is much less soluble than normal adult hemoglobin (HbA) in the deoxygenated state. The insoluble hemoglobin molecules aggregate in erythrocytes, which distorts the shape of the red cells and produces the characteristic sickle cell deformity.22 Sickle cell disease and the other hemoglobinopathies can cause either epiphyseal osteonecrosis or metaphyseal and diaphyseal infarcts.22 Sludging of sickled erythrocytes within the sinusoidal vascular bed results in occlusion.11 The painful vaso-occlusive crisis is probably caused by infarction of bone marrow. Signs of acute long bone infarction in children are common and can resemble those of acute bacterial osteomyelitis. Acute long bone infarction is at least 50 times more common than bacterial osteomyelitis in sickle cell disease.23 In older patients, infarcts can also appear in flat bones. Radiographs do not show the infarcts for several weeks. Lesions in long bones often affect the femoral and humeral heads.22
The thalassemias are a group of anemias that are hereditary and manifest hypochromic microcytic anemia with a decreased synthesis of one or more of the constituents of hemoglobin.21 Cooley anemia is the homozygous form of the disease inherited from both parents, and the children rarely survive past adolescence. The small bones, including the metatarsals and phalanges, appear rectangular, due to loss of the normal concavity of the shaft and cortical thinning.23 Trabecular resorption occurs, and the remaining trabeculae appear coarsened11 (Figure 17-10).
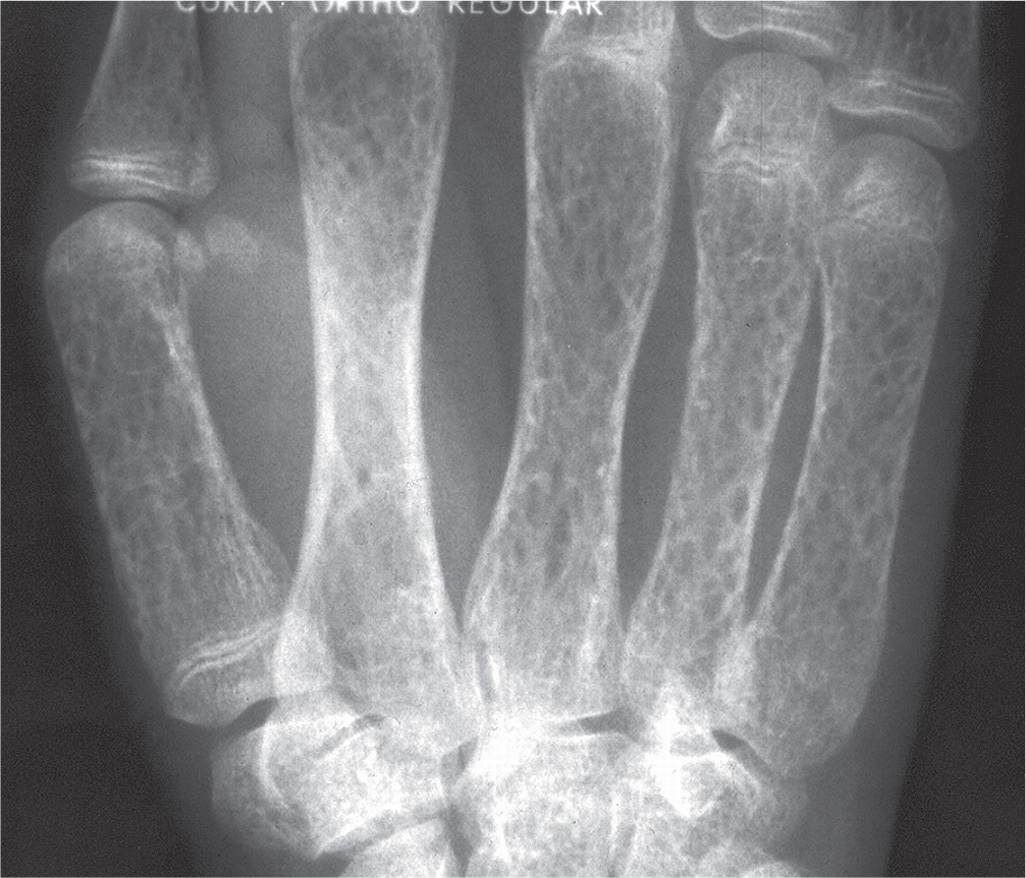
FIGURE 17-10. Thalassemia major.
OSTEOCHONDROSIS
Osteochondrosis is defined based upon the radiographic appearance of an ossification center (epiphysis or apophysis) that is sclerotic and fragmented (Figure 17-11).1 It also can appear irregular and smaller than the expected size.12 Epiphysoid bones that can appear sclerotic and fragmented, such as the navicular, are also included, which form from a cartilaginous precursor by ossification from the center outwards, like an epiphysis.24 Though Koulouris and Morrison25 believe the term osteochondrosis, which was originally believed to be avascular necrosis, is anachronistic, it still is in common use today. Some of the so-called osteochondroses are normal variations, others are true osteonecroses, and some are growth disturbances with no evidence of necrosis.12 Table 17-1 lists the named osteochondroses in the lower extremity, based upon the author who (in most cases) first described it in the literature.
Osteochondroses have also been classified based upon anatomical site of involvement: articular (Freiberg), nonarticular (Sever), or physeal (Blount).26 The nonarticular osteochondroses are further divided into the following sites: (1) tendon attachment, (2) ligament attachment, and (3) the site of impact26,27; Some osteochondroses could easily fit into two if not all three of these subdivisions.28
OSTEOCHONDRAL INJURY
The terms osteocartilaginous body, joint mouse, transchondral fracture, osteochondral lesion, osteochondral defect, osteochondrosis dissecans, and osteochondritis dissecans have all been used to refer to osteochondral injury.29 The term osteochondral injury is preferred because it encompasses both traumatic and nontraumatic causes (such as repetitive microtrauma, primary ischemic event, genetics, and corticosteroid use).9,14,29–33 It has been observed in two age groups, the juvenile with open physes (between 5 and 15 years of age) and adults and older adolescents with closed physes (between 15 and 50 years of age).34 The juvenile group has at times been referred to as osteochondrosis2; it has also been referred to as localized osteonecrosis in adults because the underlying subchondral bone may become necrotic.11
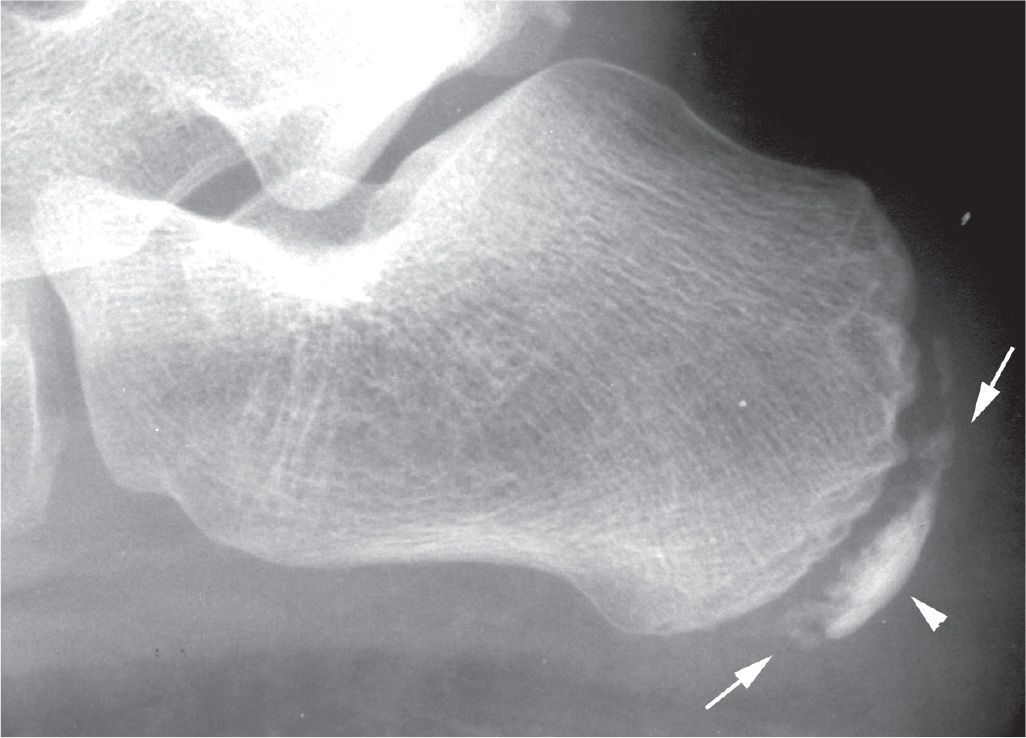
FIGURE 17-11. Osteochondrosis of the calcaneal apophysis demonstrating characteristic features of fragmentation (arrows) and sclerosis (arrowhead).
|
Eponymous | Location |
Legg–Calve–Perthes | Capital femoral epiphysis |
Osgood–Schlatter | Tibial tubercle |
Blount | Posteromedial aspect of proximal tibial physis (involving metaphysis and epiphysis) |
Liffert and Arkin | Distal tibial epiphysis |
Diaz; Moucheta | Talar body |
Sever | Calcaneal apophysis |
Köhler | Navicular |
Buschkea | Tarsal cuneiforms |
Iselin | Apophysis at base of fifth metatarsal |
Freiberg | Metatarsal head, most frequently the second and third |
Renander; Trevesa | Tibial sesamoid |
Thieman | Base of proximal phalanx hallux |
aThough listed by Breck,166 no direct references to these authors could be found in the literature.
Osteochondral injury occurs most commonly in the knee; the most common site in the foot is the talar dome.34 Most osteochondral injuries appear to be related to trauma, which could have been either acute or chronic and repetitive.25
The characteristic radiographic picture is a “button” of subchondral bone sitting in a radiolucent defect (Figure 17-12).11,35 Bone scintigraphy, arthrography, computed tomography (CT), and especially MRI have all been shown useful in identifying and staging osteochondral lesions.2,30,36,37
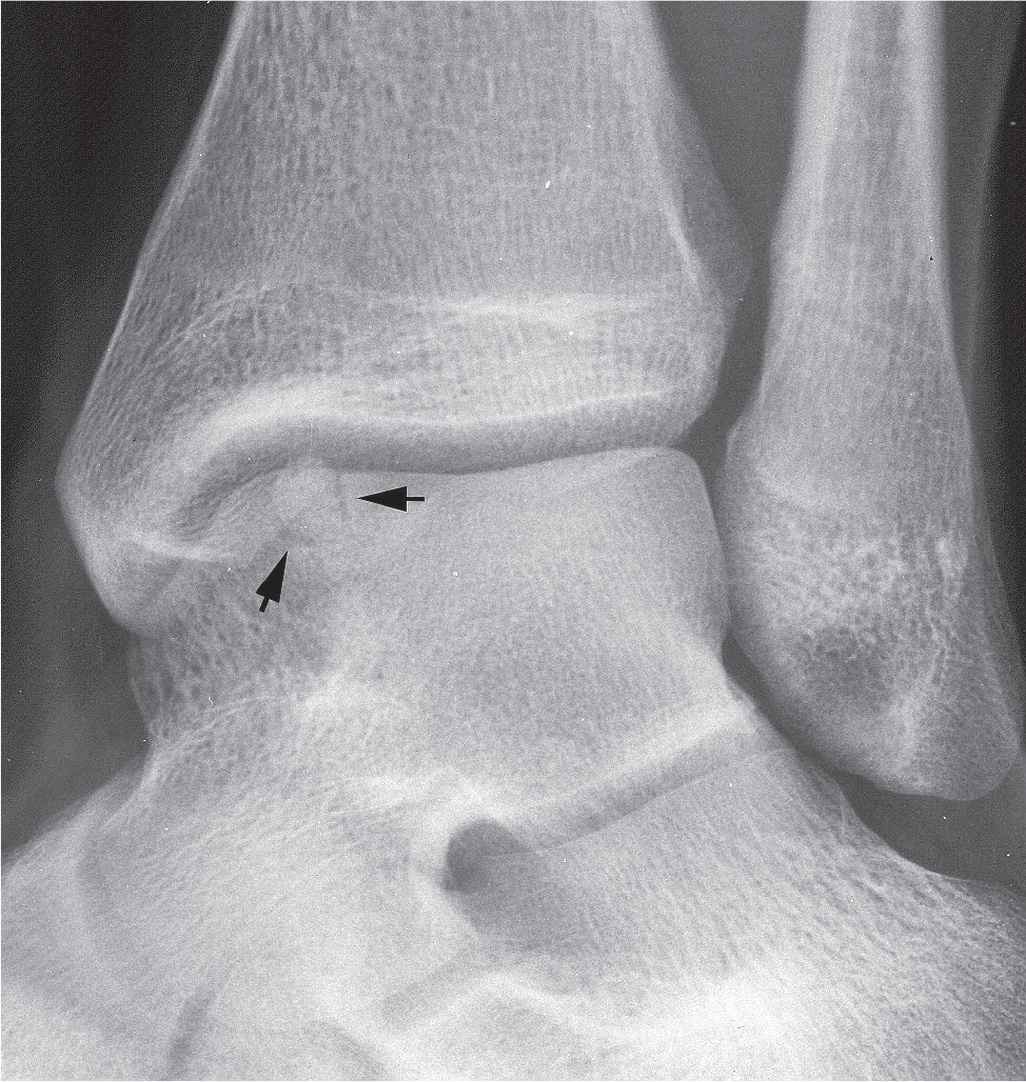
FIGURE 17-12. Osteochondral injury of the talar dome demonstrating a “button” of subchondral bone sitting in a well-defined lucent defect (arrows).
PRESENTATIONS OF OSTEONECROSIS, OSTEOCHONDROSIS, AND OSTEOCHONDRAL INJURY IN INDIVIDUAL BONES
Femur
Osteonecrosis of the femoral head epiphysis is known as Legg–Calvé–Perthes disease, based upon three separate descriptions of a similar abnormality affecting the hip joint published in the early 1900s. It is a true osteonecrosis that occurs between infancy and age 16 with the greatest incidence at age 5; it occurs much more frequently in boys than girls but is rare in black individuals.11 The diagnosis of capital femoral epiphysis osteonecrosis relies on imaging methods, including radiography, CT, scintigraphy, and MRI.38
The radiographic features and stages of epiphyseal osteonecrosis in general are based upon the research and descriptions of capital femoral epiphysis osteonecrosis. It is characterized by necrosis and followed by a regenerative process that is variable, depending on the patient’s age, the adequacy of treatment, and the rapidity with which treatment is instituted.39 Radiographic findings consist of initial joint space swelling with lateral displacement of the hip.40 In this early phase, mottled, scattered radiodense areas may be mixed with osteopenia. Subchondral fracture shows up radiographically as a radiolucent line and is called the crescent or rim sign38; this is visible only before collapse of the articular cartilage and attached necrotic bone.41 Later, after flattening of the femoral head, joint space narrowing occurs and secondary osteoarthritis results.42
In the initial stages, when radiographs are normal, MRI is the method of choice for the diagnosis of osteonecrosis, as it is more sensitive than radiography or CT. Literature shows the sensitivity of MRI to be 97% in differentiating osteonecrosis from normal hip, and 85% in differentiating femoral head osteonecrosis from other hip disorders.43 MRI is accurate in detecting osteonecrosis before clinical or radiographic changes become evident. Gadolinium-enhanced spin echo sequences and fat-suppressed images have improved MRI specificity even more (75%–100%). MRI is considered the “gold standard” noninvasive diagnostic method for osteonecrosis and is indicated when differential diagnosis with other hip disorders is difficult using other methods.38
Tc-99 bone scintigraphy is very useful in the early stages when the radiographs are normal, and helps in mapping the extent of the disease when multiple sites of osteonecrosis are present.
Proximal Tibia
Osteochondrosis of the tibial tubercle, or Osgood–Schlatter disease, is not osteonecrosis. It is considered to be a traction apophysitis, due to repetitive strain or pull, where the patellar tendon attaches to the secondary ossification center of the tibial tuberosity.35,44 This condition is more frequent in boys between the ages of 11 and 15 who are involved in jumping and running activities, just as the ossification center of the proximal tibial tubercle appears radiographically.11,45,46 Pain, swelling, and tenderness over the tibial tubercle are noted.12 Pain is exacerbated by physical activity such as running, going up or down steps, or squatting, which can result in traumatic avulsion of the quadriceps tendon or a tendonitis of the tendon with heterotopic new bone formation.12,47,48 The normal tibial tubercle is often fragmented and sclerotic; more than one ossification center is frequently evident (Figure 17-13). In patients with Osgood–Schlatter disease, lateral radiographs may show anterior soft tissue swelling and irregularity of the apophysis, with separation from the tibial tuberosity in early stages. Widening or fragmentation of the tibial tuberosity, with the presence of bony ossicles at the patellar tendon insertion, is noted in later stages (Figure 17-14).
MRI can demonstrate details not visible on radiographs and can help differentiate Osgood–Schlatter disease from acute tibial apophyseal fracture, infection, and tumor.44,49,50 Hirano50 demonstrated five stages in the progression of this disease on MRI: normal, early, progressive, terminal, and healing. A normal MRI study does not necessarily rule out the diagnosis, as it might very well mean that the patient is in an early stage of the disease. Ultrasound may reveal pretibial edema, thickening of the patellar tendon, and fragmentation of the ossification center.49,51
Blount disease, also known as tibia vara and osteochondrosis deformans tibiae, is also not a true osteonecrosis; it is a growth disturbance of the posteromedial part of the proximal tibial physis. Growth of the epiphyseal cartilage is arrested, resulting in varus medial torsion of the tibia and a degree of flexion of the diaphysis on the upper tibial epiphysis.52 Blount53 described two types of the disease, infantile and adolescent. The infantile form occurs between ages 1 and 3 and is much more common and severe. The adolescent form occurs between ages 6 and 13, and is rare in comparison.54 In contrast to Osgood–Schlatter disease, Blount disease is common in black children.55 Radiographically, the medial part of the epiphysis is poorly developed and shows a beak on the posteromedial aspect of the metaphysis; these changes are progressive (Figure 17-15).52 The sharply angular appearance of infantile Blount disease differs from the gradual curve in physiologic bowed legs. The nature and severity of the osseous changes are highly variable.7
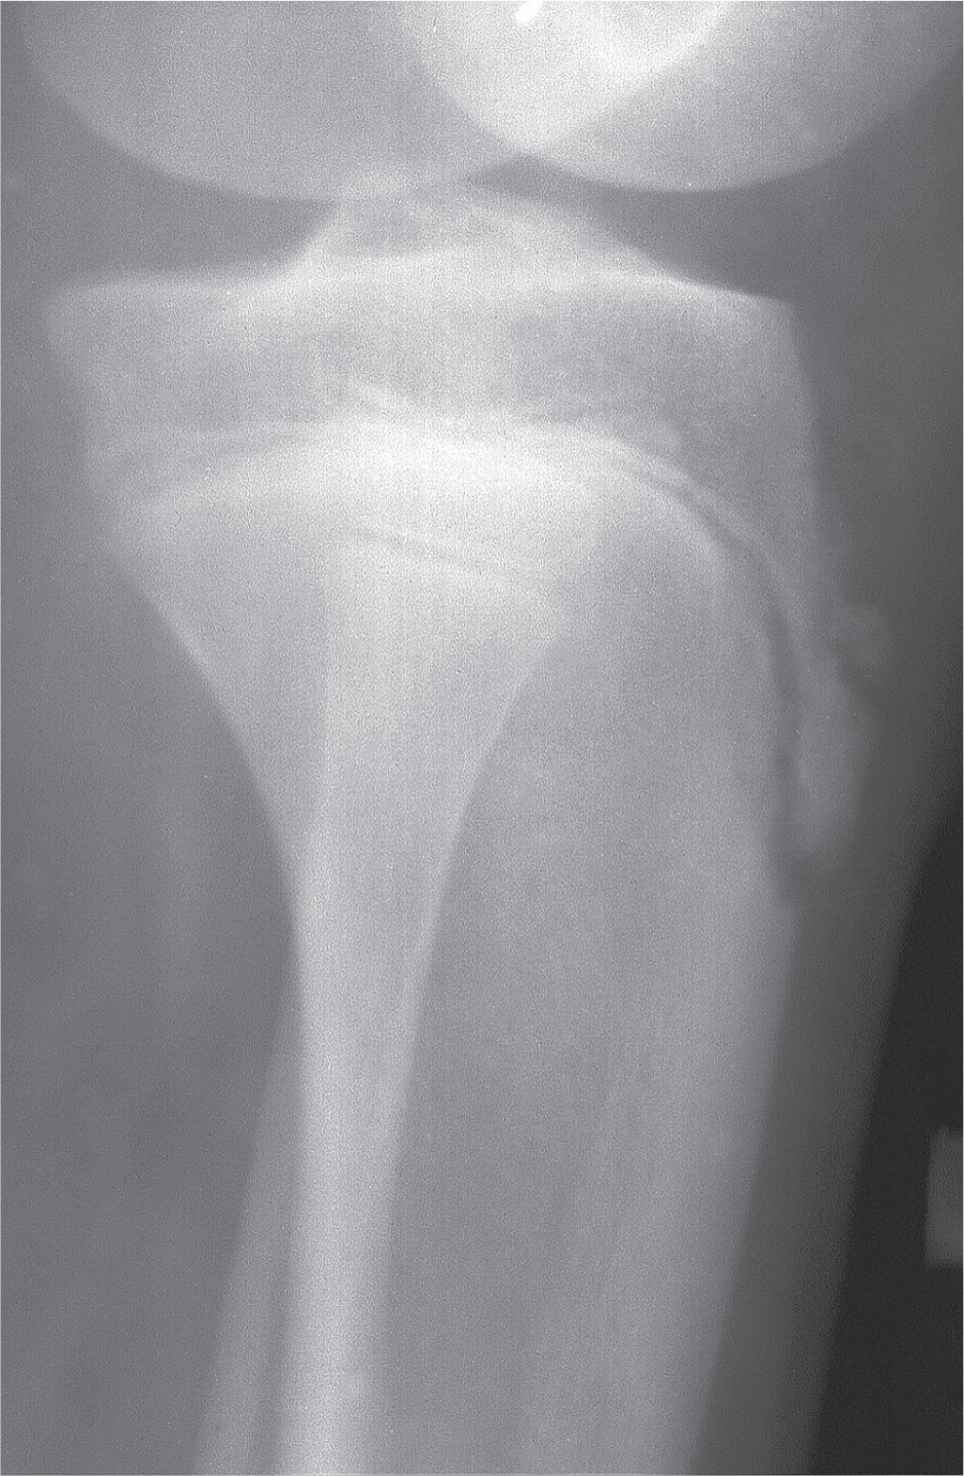
FIGURE 17-13. Variant ossification and segmentation of the tibial tubercle ossification center mimicking Osgood–Schlatter disease. This patient was asymptomatic at that location.
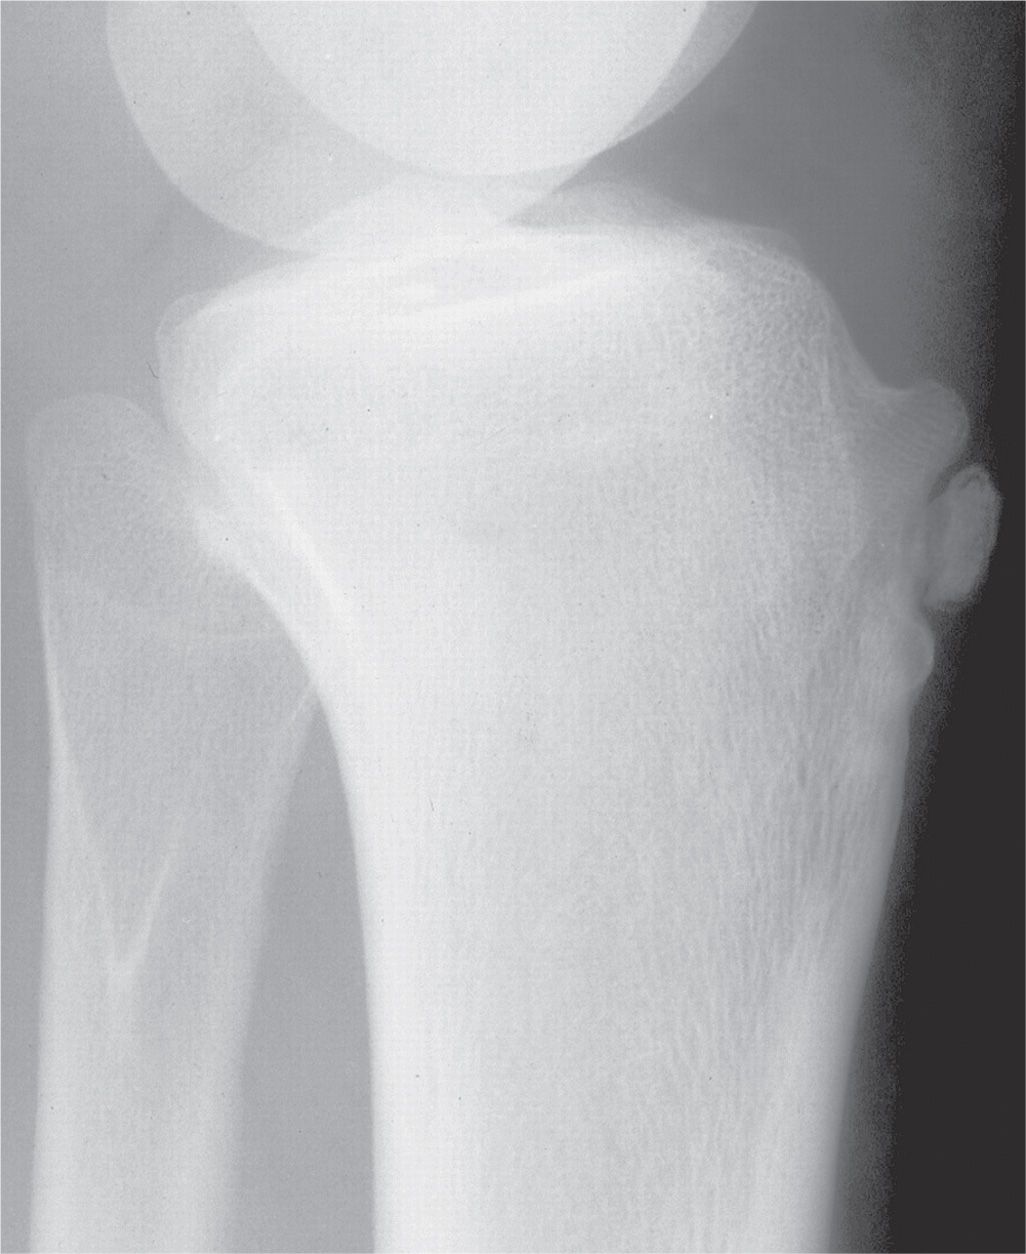
FIGURE 17-14. Osgood–Schlatter disease. Prominent tibial tubercle with fragmentation associated with positive clinical symptomatology, consistent with osteochondrosis of the tibial tubercle.
Distal Tibia
Siffert and Arkin56 were the first to report a case of avascular necrosis of the distal tibial epiphysis. It resulted from a crush injury to the lateral half of the epiphysis. Radiographic findings included sclerosis and fragmentation, and portions of the bone were histologically positive for osteonecrosis.
Osteochondral injury of the distal tibial plafond has been rarely described in the literature, but may not be as rare as the number of cases reported. The etiology, though unknown,57 is probably traumatic, as in the talar dome.58 It is seen better in the anteroposterior (AP) ankle view than the lateral view (Figure 17-16). There does not appear to be any location preference along the tibial plafond as there is on the talar dome. The imaging characteristics are similar to those seen in the talar dome, described next.
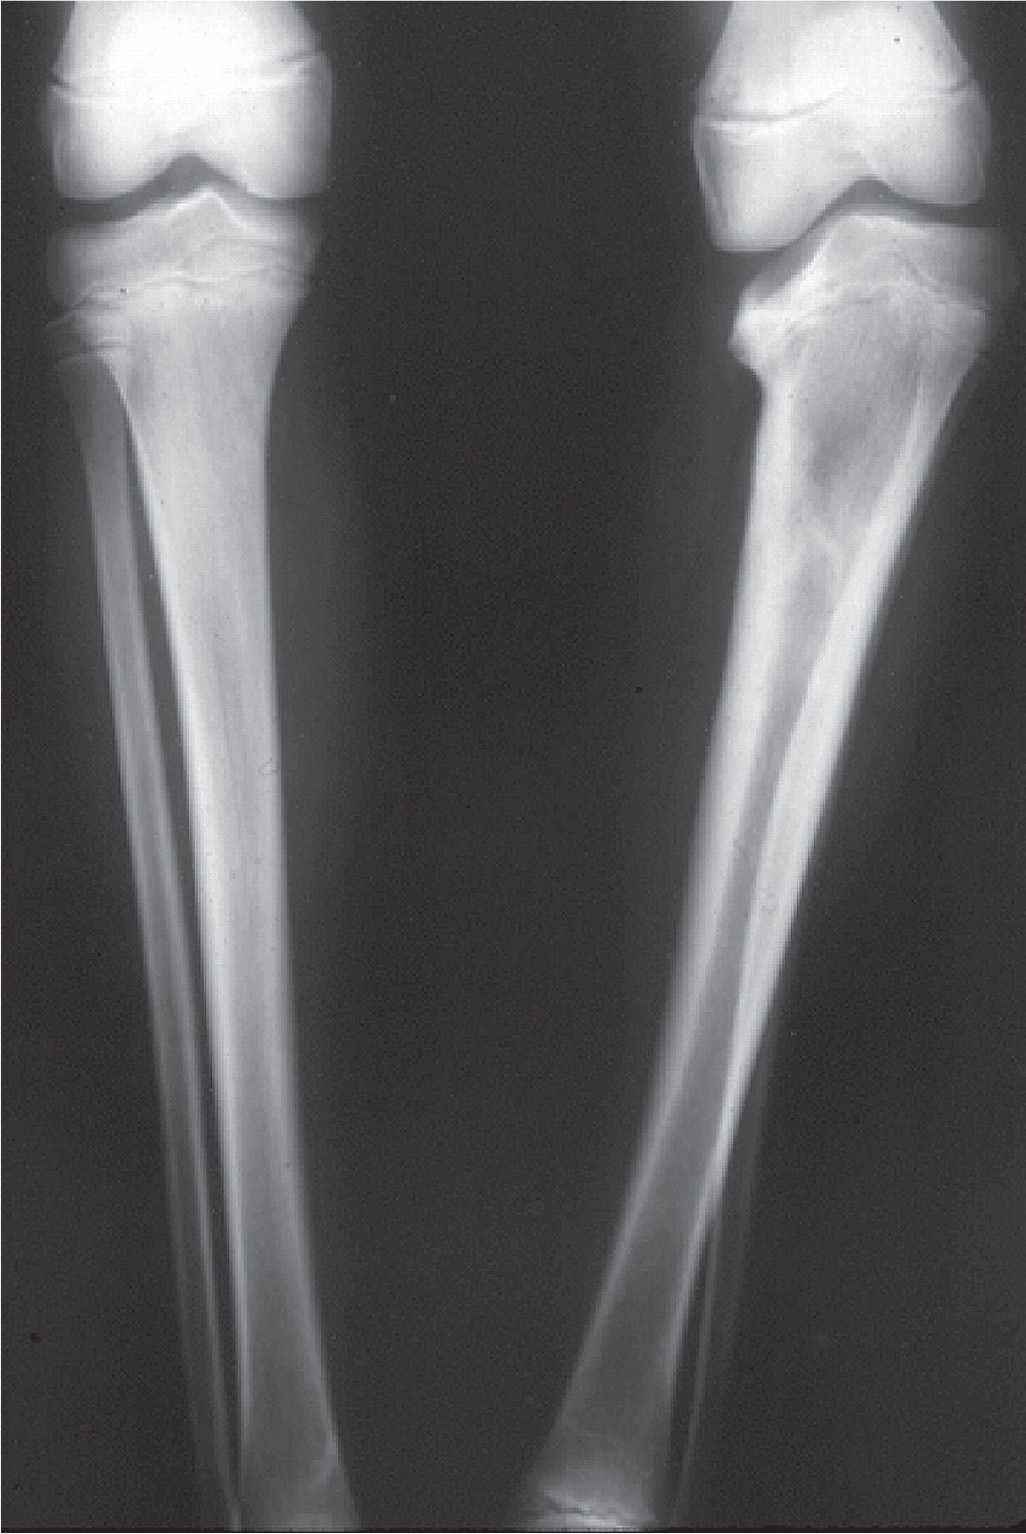
FIGURE 17-15. Blount disease. There is severe varus deformity of the left leg.
Talus
Diaz first described talar body osteonecrosis in 1928.59 Its etiology is most commonly posttraumatic with secondary disruption of the talar body’s blood supply.9 Osteonecrosis of the talar dome is a well-recognized complication of talar neck fractures, occurring in 30%–50% of such injuries.14,60
Radiography is the initial imaging study of choice. The necrotic area of bone may appear sclerotic relative to surrounding osteopenia earlier in the disease (Figure 17-17). As repair progresses, the area of osteonecrosis becomes more sclerotic as new bone is laid down upon necrotic trabeculae. A radiolucent rim eventually surrounds the sclerosis. The talar dome may collapse and fragment in more severe cases (Figure 17-18).9
CT has been used to confirm the radiographic findings.61 MRI is the most sensitive technique for detecting talar osteonecrosis. Bone scintigraphy is not commonly used in clinical practice and is less sensitive than MRI in diagnosing symptomatic avascular necrosis.9,62
Avascular necrosis of the talus has occurred after a variety of surgical procedures, including medial and lateral release of congenital clubfoot, tibio-talar-calcaneal arthrodesis, triple arthrodesis, and talonavicular arthrodesis, which may disrupt talar vascularization.6,63,64 When evaluating patients with persistent pain and disability postoperatively, artifacts from metallic implants may obscure characteristic imaging signs of osteonecrosis.
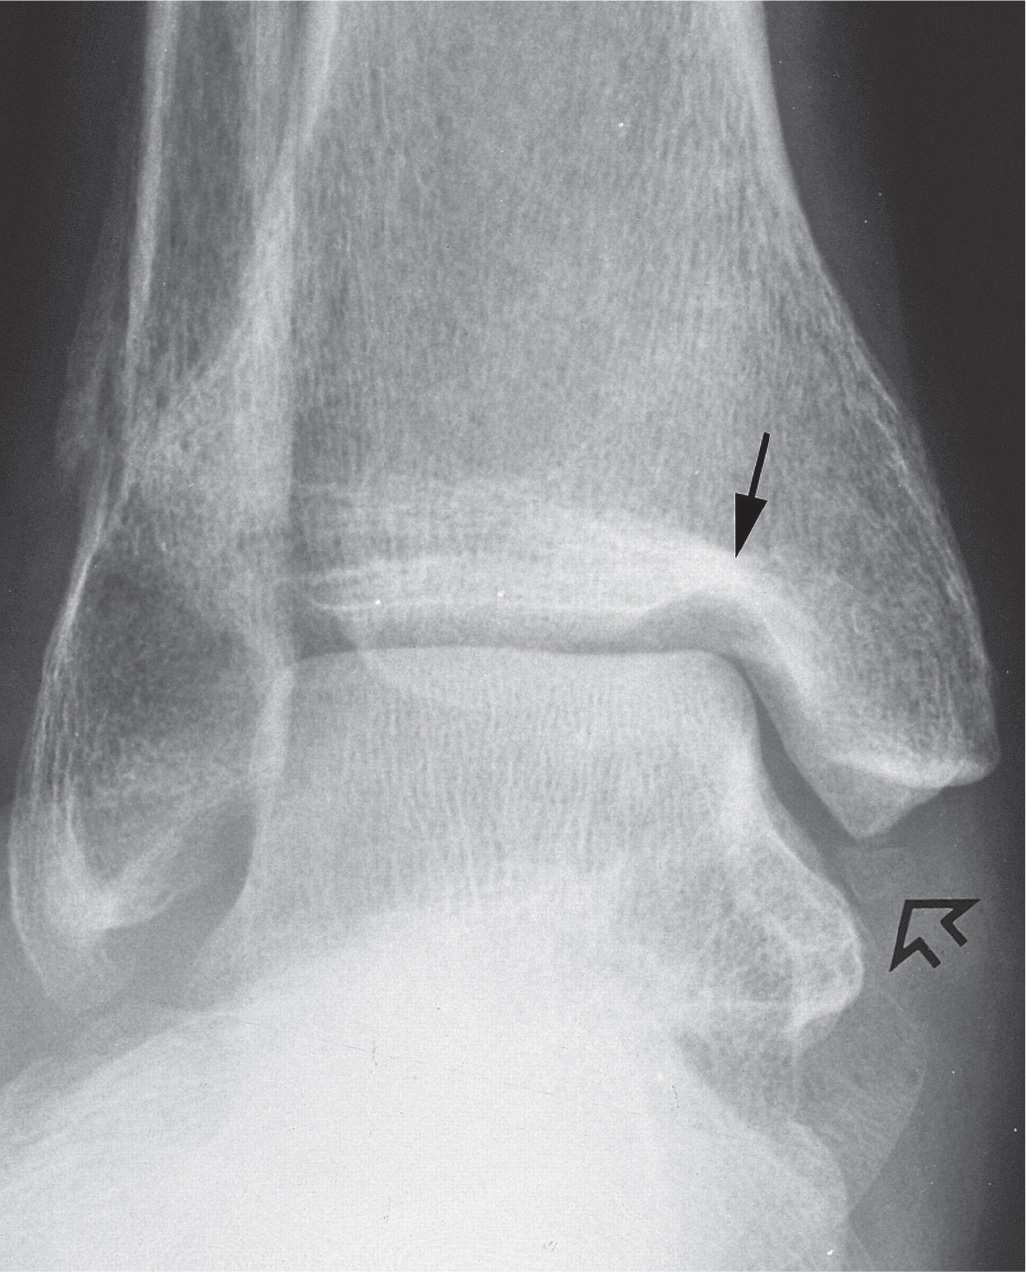
FIGURE 17-16. Osteochondral injury of the tibial plafond. There is a large defect in the superomedial corner of the tibial plafond (closed arrow); the open arrow points to an ossicle that may have originated from here.
Radiography and CT are the mainstay imaging modalities of the postoperative ankle and foot. MRI and bone scintigraphy play an important complementary role in differentiating avascular necrosis from infection, nonunion, occult fracture, and secondary osteoarthritis.6 Thordarson65 has noticed that, after open reduction internal fixation of talar neck fractures, the use of MRI in less than 6 weeks postoperatively had a high false negative rate, a finding confirmed by other authors as well. He noted that it might take 3 to 6 weeks before osteonecrosis is seen on MRI. Radiographs in this post-op period may show a negative Hawkins sign, indicative of osteonecrosis, while MRI might be negative.9,66
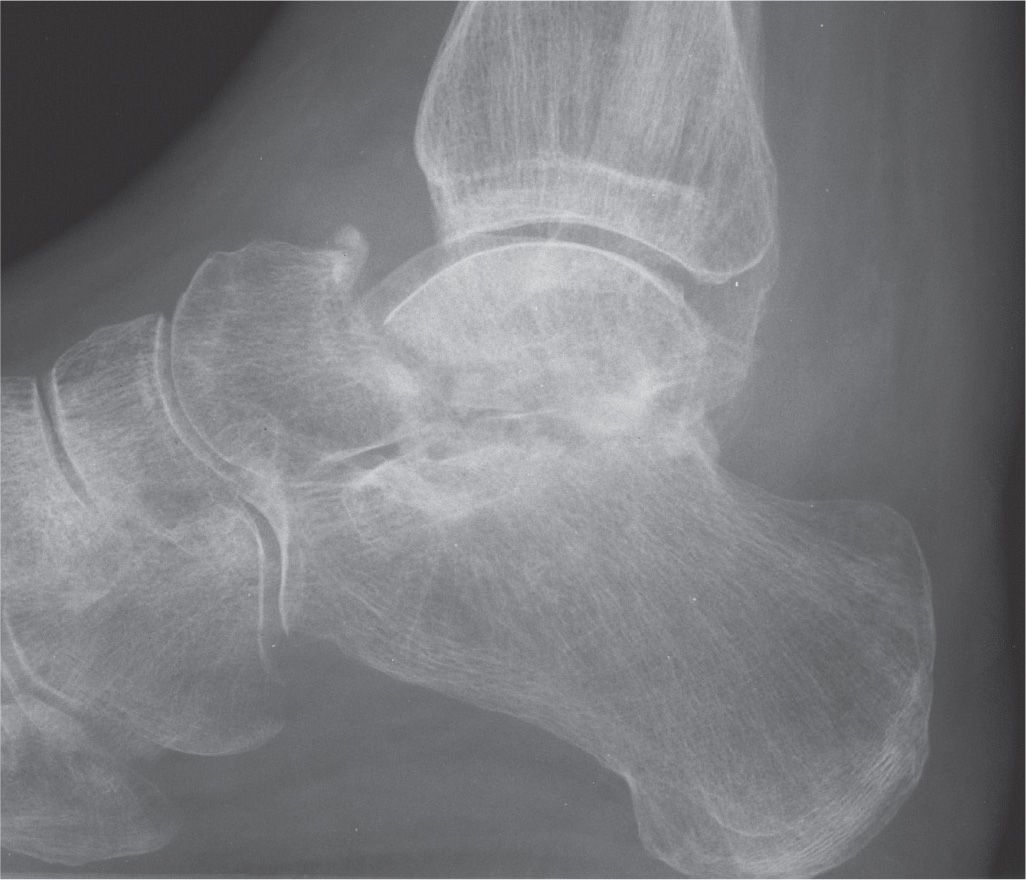
FIGURE 17-17. Osteonecrosis of the talus, early. Lateral view demonstrates fracture of the talar neck and diffuse osteopenia; the talar body appears relatively increased in density.
Hawkins sign, characterized by subchondral osteopenia on AP or mortise radiographs (Figure 17-19), classically begins at the medial subchondral bone of the talar dome and progresses laterally.15,67–69 Typically, it results from the resorption of subchondral bone in the setting of disuse and a sufficient vascular supply. Thus, Hawkins sign, indicating partial revascularization, is a reliable indicator of talar viability and its presence serves as an early negative predictor of osteonecrosis. However, the absence of Hawkins sign does not confirm osteonecrosis, because it has greater sensitivity than specificity.9,68 Detection of Hawkins sign 4 to 8 weeks after fracture or surgical intervention is suggestive of revascularization of the relevant portion of the talar body.6,9 A partial Hawkins sign is more commonly observed in the medial talus, which is indicative of incomplete osteonecrosis; this indicates the susceptibility of the lateral talar dome or inferior articular surface of the body to osteonecrosis.6,61 Complete revascularization after surgery may take between 6 months and 3 years. During this time, fractures may heal as the progressive sclerosis and cysts of osteonecrosis either resolve or lead to osseous collapse.6 CT is particularly useful in the assessment of healing or evolution of osteonecrosis after triple arthrodesis.6
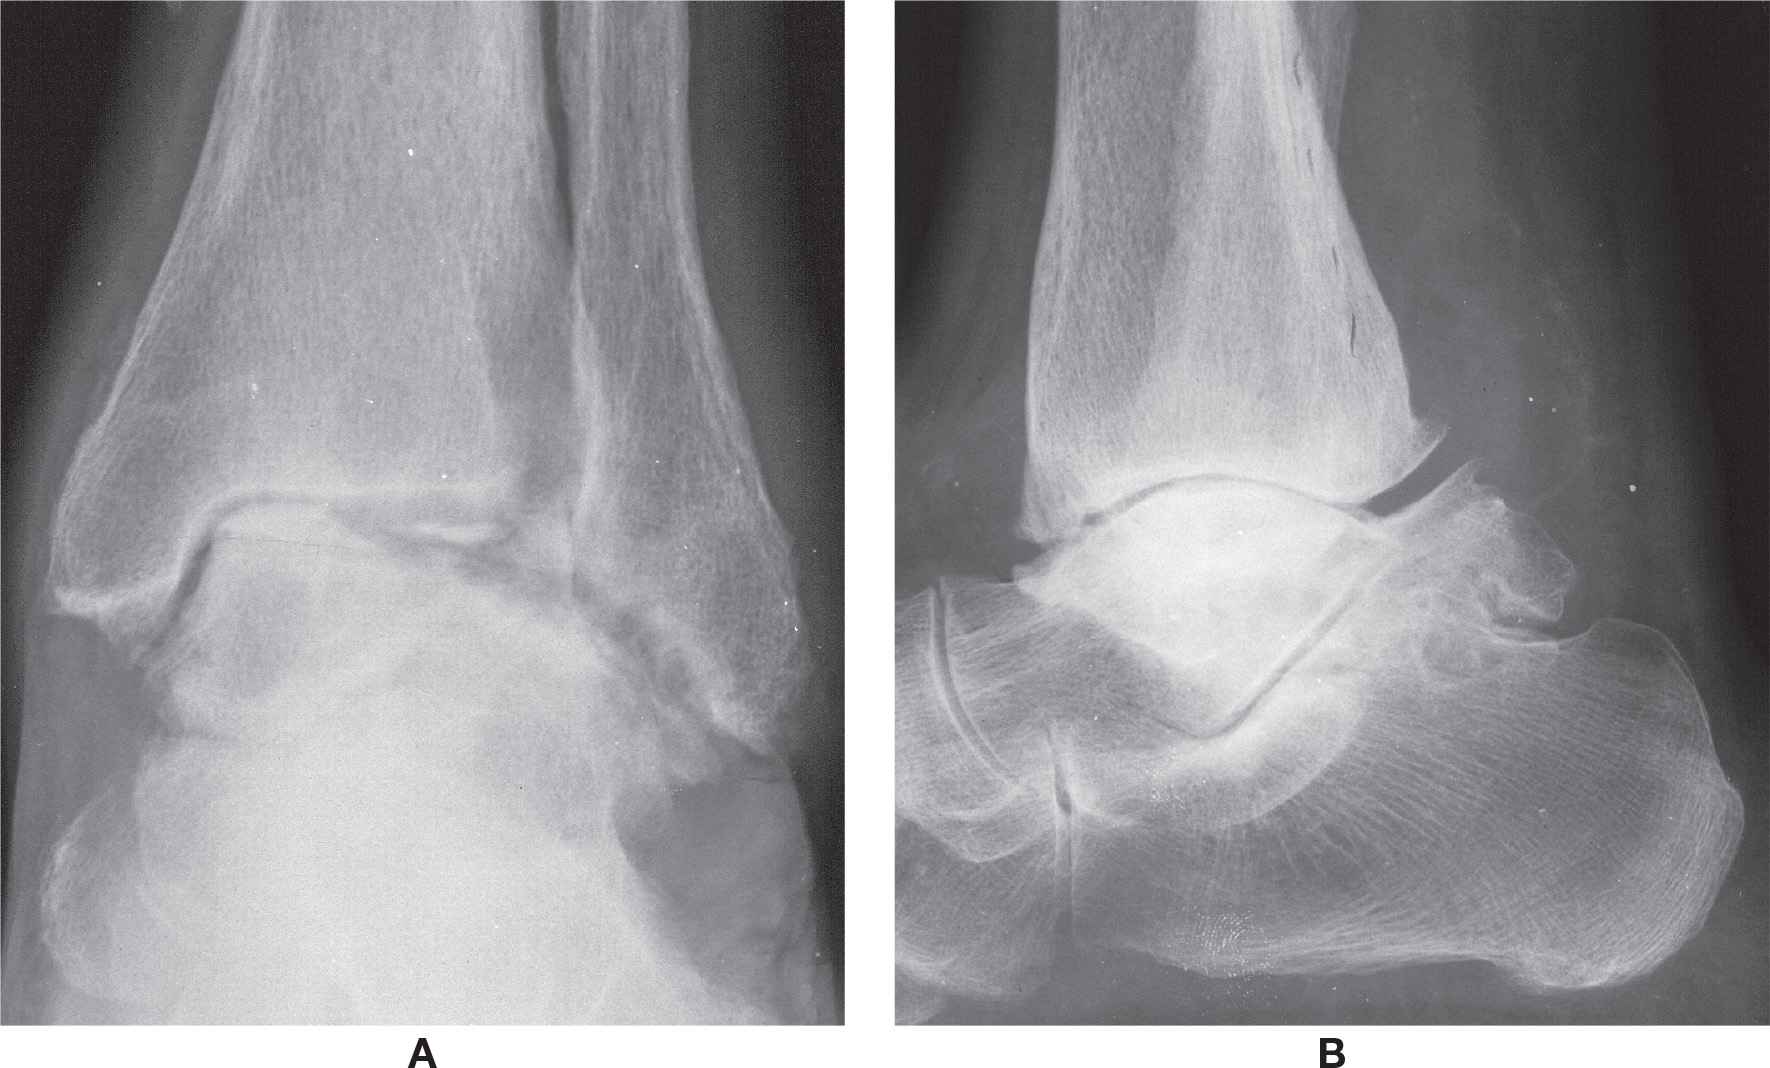
FIGURE 17-18. Osteonecrosis of the talus, late and severe deformity. A: Anteroposterior view. B: Lateral view.
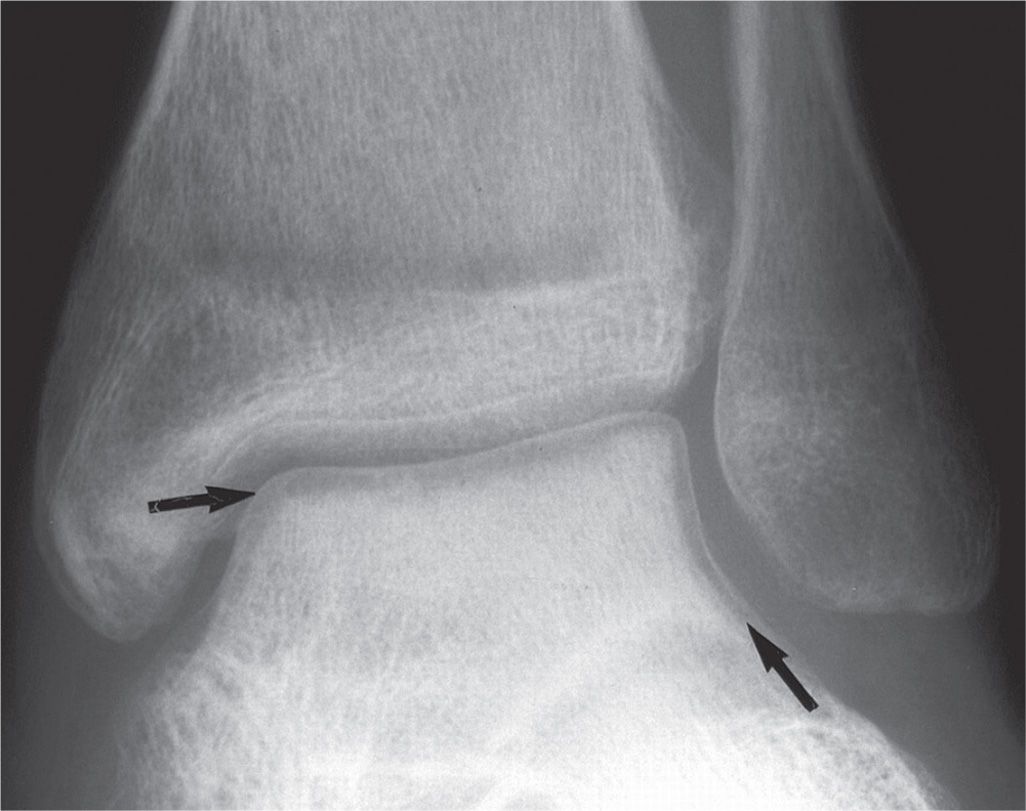
FIGURE 17-19. Hawkins sign. Note the linear radiolucency that parallels the articular surface of the talar dome (arrows). This is a result of acute osteopenia, and depicts a patent blood supply to the talar body.
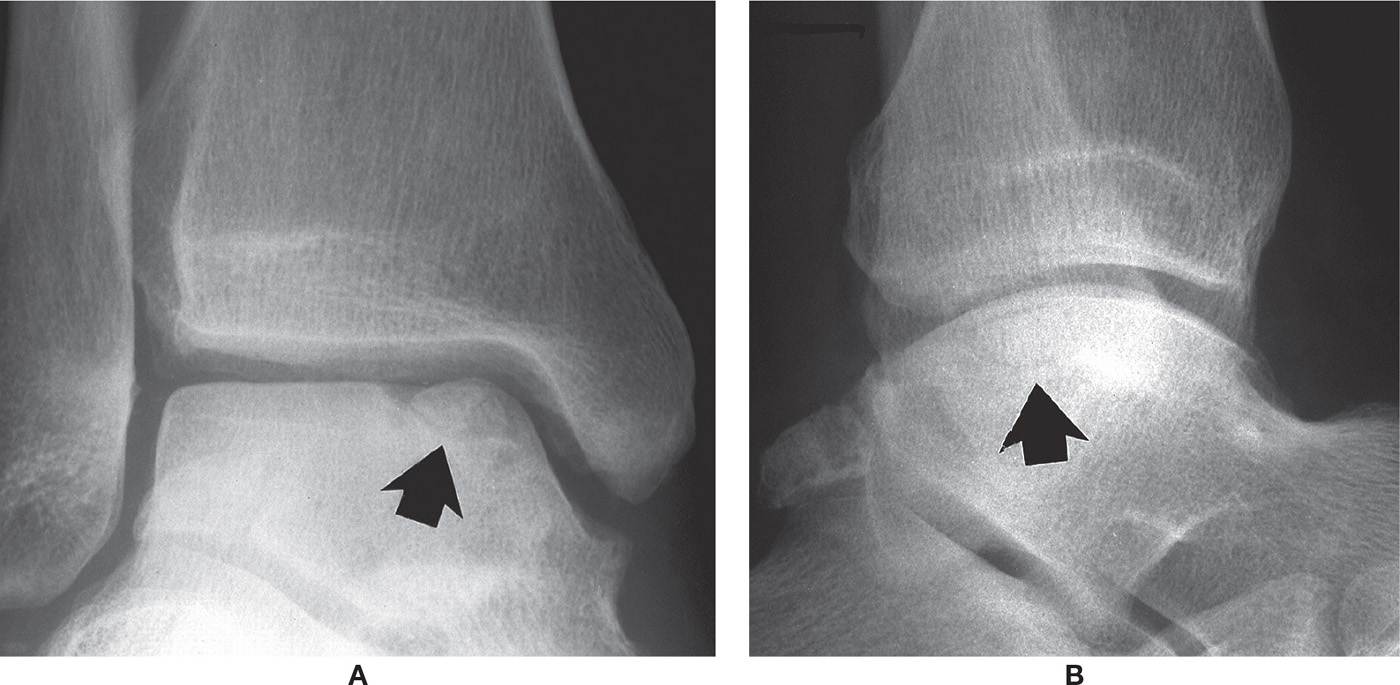
FIGURE 17-20. Osteochondral injury, talar dome, superomedially (arrows). A: Mortise view. B: Lateral view.
Osteochondral injury of the talar dome has also been referred to as osteochondritis dissecans (a confusing term as it implies inflammation), osteochondral defect, transchondral fracture, talar dome fracture, osteochondral fracture, and avascular necrosis of the talus.6,14,70 It frequently occurs between 20 and 30 years of age, with a slight preponderance in males, and is mostly unilateral, with only about 10% of the cases being bilateral finding.70 According to Van Buecken, osteochondral injury is noted as a complication in 6.5% of ankle sprains.70,71 It is fairly common and occurs in either the upper medial or lateral aspect of the dome72 (Figure 17-20). Flick and Gould studied hundreds of OCLs and found that 98% of the lateral dome lesions and 70% of the medial dome lesions were associated with a history of trauma.29,33 Medial lesions are most common in the posterior third of the dome and may have a deep cup or crater appearance. Lateral lesions are often situated in the middle third of the dome and are shallower. Central dome lesions are uncommon.14,37,73
It is suggested that, for the initial evaluation of acute ankle injury, radiography should be the first choice for diagnosis and temporal observation of talar osteochondral injury.61,70 Even if radiographs cannot detect early and less advanced disease, it is recommended to be obtained in all cases of suspected or known osteonecrosis.9 If any lesions are detected, further details should be obtained via CT. If radiographs are normal, but the patient continues to have persistent pain, an MRI study may be warranted.70,74
Radiography, using standard weight-bearing views (AP, lateral, oblique), remains the preferred first line imaging study when suspicion of osteochondral injury arises, in part to rule out fracture.29 Canale and Kelly67 used a special positioning technique in order to detect any “offset” or varus deformity of the talar head and neck; the image is performed as a non–weight-bearing (or semi–weight-bearing) dorsoplantar (DP) foot view with the ankle joint maximally plantarflexed and the foot pronated 15°, while the x-ray beam is angled at 15° from vertical. Posteromedial lesions are best visualized in the mortise view of the ankle in plantar flexion.70,75 The main disadvantage of radiography in assessing osteochondral injury is that it is unable to assess the state of the cartilage.29,76
CT is useful for assessing in greater detail the bony injury, including the site, size, shape, and extent of fragment displacement.
MRI, is becoming the gold standard for diagnosis of osteochondral injury because it is able to detect early bone bruise, cartilage damage or other soft tissue injury; MRI also correlates well with arthroscopic findings.29,70,77–79 MRI is the most sensitive technique for detecting talar osteochondral injury and can be used when it is strongly suspected clinically despite normal radiographs61; however, the signal patterns in the talus may overestimate the severity of the bone injury.29,80 MRI is also performed to evaluate stability of the osteochondral fragment.
The radiographic classification system developed by Berndt and Harty81 in 1959 is still in current use; Anderson et al.30 and Loomer et al.76 later modified it. (The reader is referred to Chapter 16 for further discussion of talar osteochondral injury and the Berndt and Harty classification.) There are several other grading systems used to assess fragment stability of talar dome osteochondral injury based on arthroscopic, MRI, and CT findings.29,77,82–85
Calcaneus
Osteochondrosis of the calcaneal apophysis is known as Sever disease.86 In 1912, Sever reported heel pain in adolescent boys with the radiographic picture of a sclerotic apophysis with fragmentation.87 For decades it was believed that these findings were diagnostic of calcaneal apophysitis. Osteochondrosis of the calcaneal apophysis, however, is now generally considered to be a variation of normal development.
The calcaneal apophysis is an accessory ossification center and appears radiographically at 4 to 7 years in girls and 4 to 10 years in boys; it fuses at an average of 16 years of age.88,89 The center of ossification is oriented perpendicular to the axis of the calcaneal tuberosity. The Achilles tendon inserts on its posterior aspect and the plantar fascia originates at its inferior extent (the calcaneal tubercle); superiorly it forms the bursal projection.49 The normal calcaneal apophysis is sclerotic, relative to the calcaneal body, and often appears fragmented because of the presence of multiple ossification centers (Figure 17-11).90–92 It is also normal during development to see a jagged or serrated appearance along the margin of the adjacent metaphysis (Figure 17-21).93
Radiographically, it has been shown that increased density of the calcaneal apophysis is normal and attributed to weight bearing because it is absent in children without normal weight bearing.91,92 There is no consensus on the radiographic appearance of calcaneal apophysitis in the relevant literature, and no signs have been accepted as pathognomonic for the diagnosis of Sever disease.86,94 Furthermore, there is no study on the interobserver and intraobserver reliability of any of the radiographic findings regarding Sever disease, and neither their sensitivity or specificity are known.86,94 However, Perhamre et al.92 concluded that a high degree of fragmentation was significantly more frequent in patients with calcaneal apophysitis than in the control group. As such, the use of radiographs as a routine screening procedure does not seem to be cost-effective and there is the risk of ionizing radiation. Therefore, radiography should be considered only to aid in differential diagnosis when considering other pathologic conditions in recalcitrant cases.86,89,94–96
Heel pain in the patient with an unfused apophysis may represent apophysitis, especially in boys 10 to 12 years of age.49,89–92 However, growth disturbances and bone density changes are not typical.49 No radiographic criteria have been established for the diagnosis of Sever disease.91,92 The diagnosis of Sever disease is clinical (via the highly sensitive and specific one heel standing test and heel squeezing test).92
Ogden et al.93 have indicated that Sever disease may result from repetitive compression injury to the actively remodeling trabecular metaphysis, rather than being a traction apophysitis. They used the microfracture, hemorrhage, and edema visible on MRI to sustain their conclusions. MRI in Sever disease shows bone edema in the metaphysis adjacent to the apophysis, suggesting metaphyseal stress fracture; the adjacent apophysis was normal. The metaphyseal bone edema resolved after immobilization.93,97
Navicular
Osteochondrosis of the navicular bone is known as Köhler disease; it is an abnormality of endochondral ossification.98 True atraumatic osteonecrosis of the navicular is extremely uncommon. It occurs more frequently in males than females, typically between the ages of 3 and 7. This condition is self-limiting, with unilateral involvement present 75% to 80% of the time, and has an excellent prognosis.7,14,99 According to Ozonoff,13 the diagnosis can only be made by showing that a normal navicular was present before the development of sclerosis and fragmentation, or by showing progressive bone resorption followed by progressive bone repair on serial radiographic studies.
Much more common is an anatomic variation, delayed appearance of the navicular ossification center.100 In this case, the navicular radiographically appears sclerotic, fragmented, and narrow in its AP diameter with a hazy outer border (Figure 17-22). Ferguson found irregular ossification of the navicular in about one-third of normal children.100 Although navicular osteochondrosis may present bilaterally, contralateral radiographs are helpful for comparison.97 The differential diagnosis includes acute or stress navicular fracture.97 Even though the navicular in the developing skeleton is not an epiphysis or apophysis, Köhler disease is considered an osteochondrosis because it is an epiphysoid bone that forms from a cartilaginous precursor by ossification from the center outwards, like an epiphysis.24
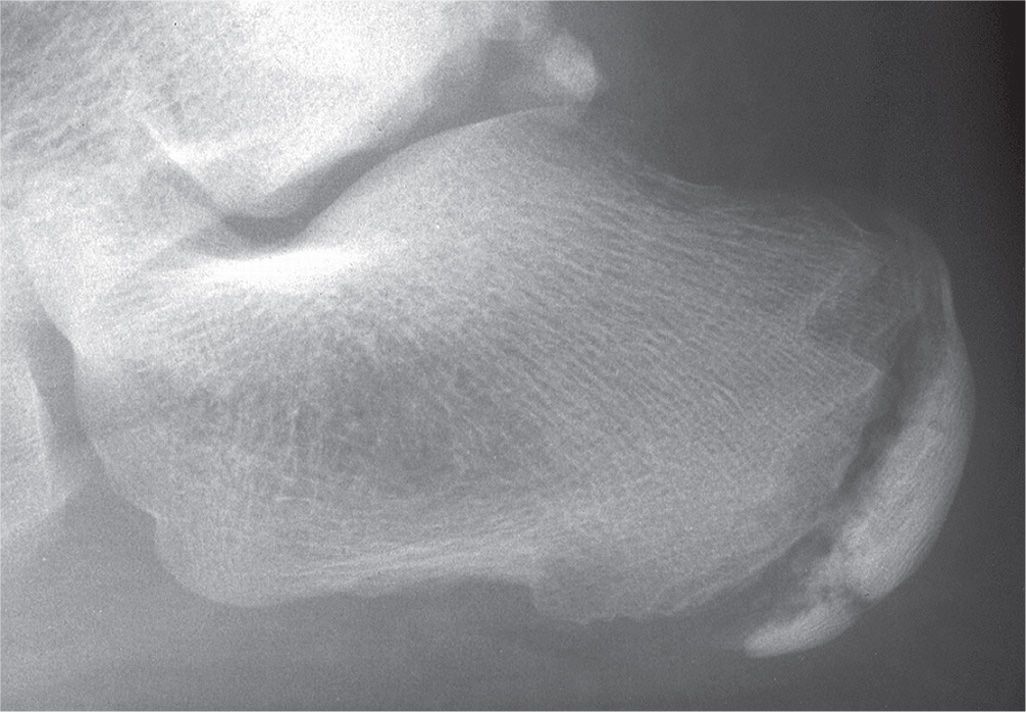
FIGURE 17-21. Osteochondrosis of the calcaneal apophysis. The appearance of sclerosis and fragmentation are variations of normal. The adjacent serrated metaphysis is normal development.
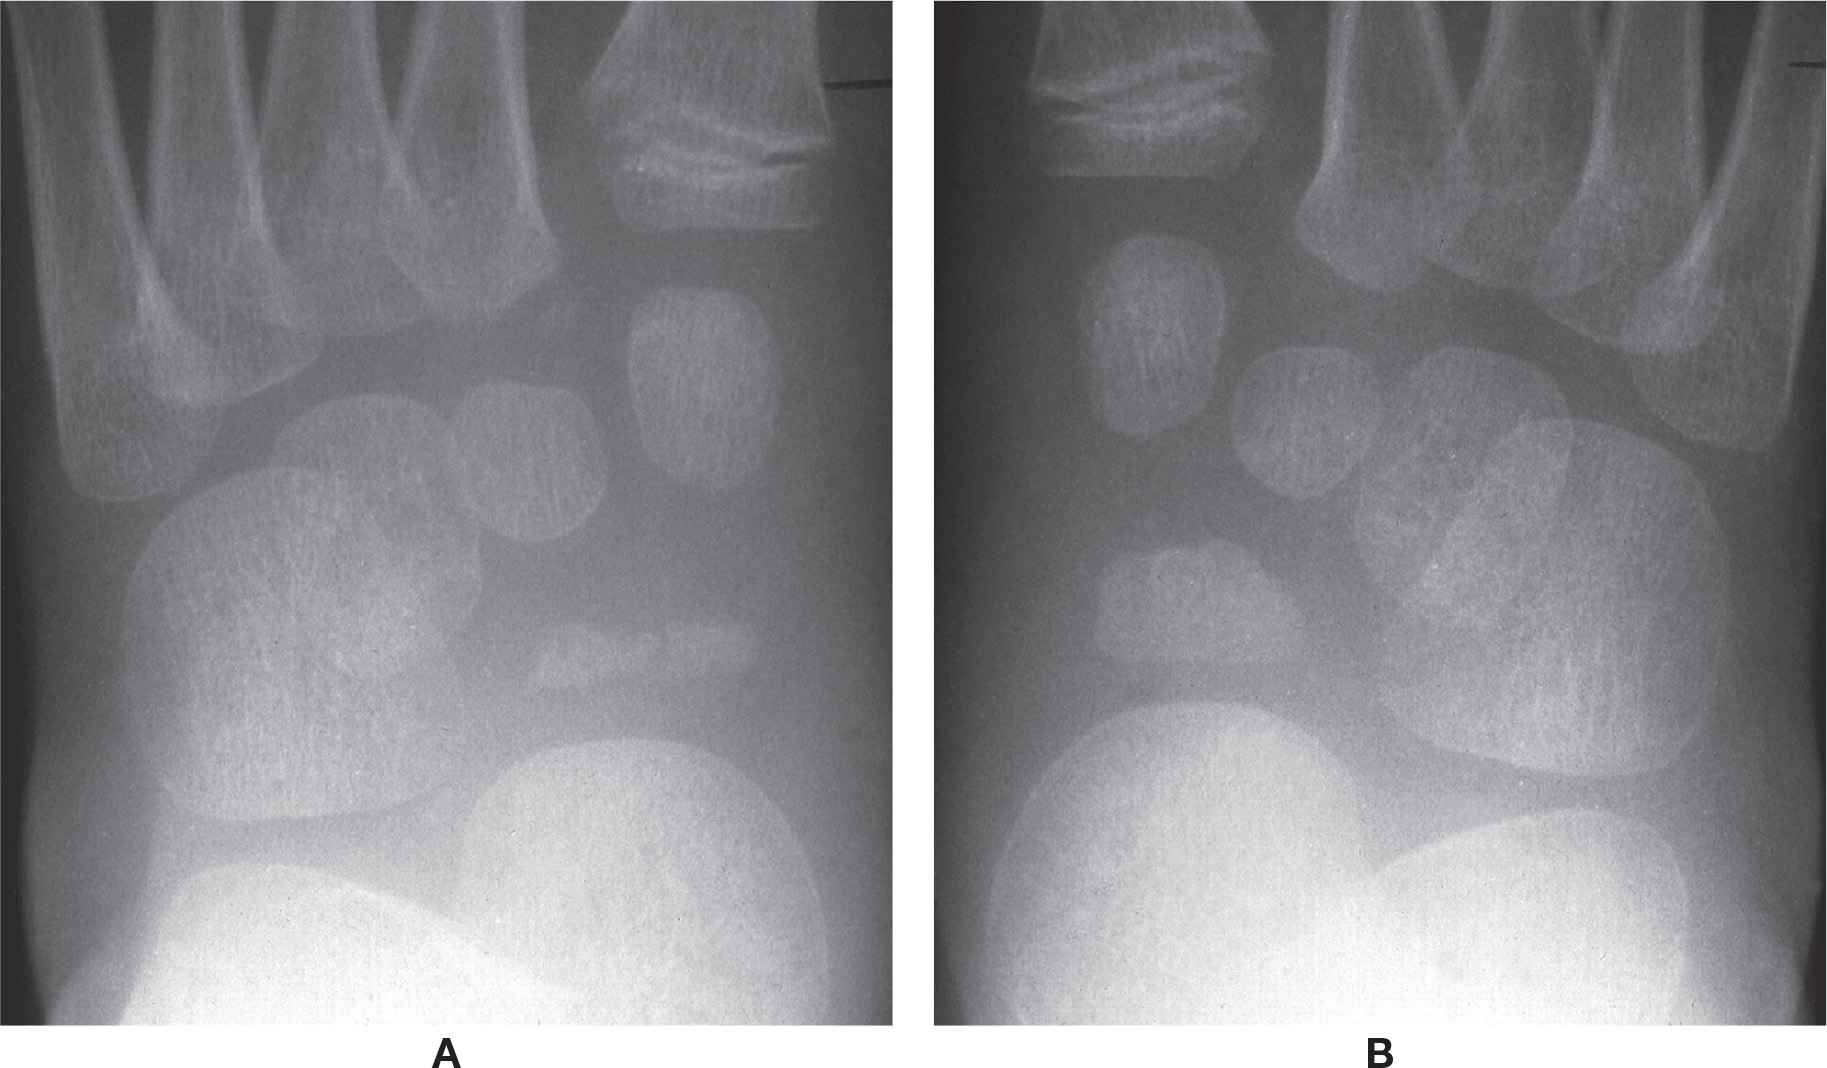
FIGURE 17-22. A: Variant ossification and segmentation of the navicular ossification center mimicking Köhler disease. B: Opposite foot, same patient.
McCauley and Kahn101 used bone scintigraphy to evaluate a possible Köhler disease. He found decreased uptake of the symptomatic navicular, which he argued supported a diagnosis of true osteonecrosis. However, Brower12 suggested that the decreased uptake was probably caused by delayed ossification at the growth center. She goes on to argue that, because a true osteonecrosis must involve a hypervascular state, to support the diagnosis the scan should be hot at some point. Weston demonstrated an increased focal uptake of scanning agent in a true Köhler disease.102 Whereas true osteonecrosis requires immobilization to prevent collapse of the navicular, the anatomic variation generally ossifies normally regardless of treatment.
Mueller–Weiss syndrome is an idiopathic, painful deformity of the adult navicular bone. Although it resembles osteonecrosis on MRI, this not been supported by histopathologic studies in the literature. It also has been suggested that it is the sequella of undiagnosed navicular stress fracture.103 This syndrome occurs predominantly in females in their 4th to 6th decades and is usually bilateral.104
Maceira and Rochera105 propose that Müller–Weiss syndrome is related to delayed ossification of the navicular that becomes deformed secondary to abnormal force distribution on the bone. They have grouped the radiographic presentations of increasing deformity into five stages, which are chronic and progressive (Table 17-2).106
The “3rd stage” of Müller–Weiss syndrome appears similar to the bipartite navicular; the division or partition separates the bone into a smaller superolateral segment and a larger inferomedial segment107 in the DP view, the larger navicular segment is shaped like a wedge107 or comma.105 Its base is positioned medially and apex points laterally; the smaller segment is superimposed on the lateral cuneiform and cuboid (Figure 17-23A). In the lateral view, the smaller segment is shaped like a wedge and positioned along the dorsal aspect of the larger segment; its apex is directed inferiorly (Figure 17-23B).22 The smaller bipartite segment appears to articulate with the intermediate cuneiform superoposteriorly.
Osteochondral injury of the navicular is rarely reported in the literature.58,108 The few cases reported were in patients ranging in age from 19 to 42; its etiology is unknown.109 The lesion is found along the concave proximal articular surface for the talus, in its central one-third. Radiographically, the lesion is seen in a localized depression or lucency along the subchondral bone plate, surrounded by sclerosis (Figure 17-24). Both CT and MRI can be used to confirm the lesion and determine its extent.
| Mueller–Weiss Syndrome: Five Progressive Deformity Stages in Lateral View as per Maceira and Rochera105 |
Stage | Radiographic Findings |
1 | Normal radiograph despite abnormal MRI |
2 | Talar axis superior to first metatarsal; navicular appears to subluxate inferiorly relative to talar head; mild compression of navicular |
3 | Talar axis returns parallel to first metatarsal; space between talar head and cuneiforms is greatly reduced; the navicular bone fragments and begins to subluxate off talar head superiorly; lowering of longitudinal arch |
4 | Talar axis inferior to first metatarsal; further compression of navicular; greater navicular subluxation superiorly; collapse of longitudinal arch |
5 | Extrusion of navicular, dislocation of navicular fragments such that lateral and intermediate cuneiforms appear to articulate with talar head; rearfoot equinus attitude; ultimately, progression of deformity results in osteoarthritis of talonavicular joint |
Related posts:

Stay updated, free articles. Join our Telegram channel

Full access? Get Clinical Tree


