Congenital and Developmental Pediatric Abnormalities
Radiography is a valuable tool for assessing the pediatric patient. Many clinical conditions can be easily visualized with radiographs.1 However, radiographs may be underused for the pediatric population. This underuse may be prompted by strong concern over the greater sensitivity of the pediatric patient to ionizing radiation. However, relatively speaking, radiation exposure is very low for foot and ankle studies and no critical organs are exposed. Thus, the risk in failing to use radiography to diagnose a condition in a child may be greater than is the radiation exposure in many, if not all, cases.
Also, some practitioners believe that, because many bones in the child’s foot and ankle have not fully ossified, a radiograph may not provide useful information. However, the relationships among the bones of the foot are well established and can be identified by using the visible ossified portions of the bones. Radiographs can easily detect abnormalities early in the child’s development. The clinician should be able to determine the difference between normal and abnormal radiographic findings at any stage. Clinical history and physical findings combined with radiographic assessment provide valid documentation of a pediatric abnormality.2
Radiographs can also be used to monitor and document the progress of a patient’s condition. Clinical signs of no improvement or lack of change in the severity of the deformity determine the frequency with which radiographs should be performed in children.
To determine what constitutes a radiographic abnormality, one must be familiar with the normal and variant expectations in a pediatric radiograph (see Chapters 7 and 8). Although some bones in the newborn and infant are in a preossification state, they do exist in their cartilaginous form. What appears as a “blank” space on a radiograph between bones is actually cartilaginous tissue, which is radiolucent. This cartilaginous precursor is also generally in its adult shape and form.
Radiographs in children are valuable for assessing orthopedic, biomechanical, and congenital abnormalities. Analysis of the osseous axes and associated angles is also valuable for determining the pathology present. The normal angular values and their applications to deformities are discussed later in this chapter.
When possible, weight-bearing (standing) foot and ankle radiographs are preferred for the pediatric patient. The weight-bearing study reveals the functional anatomic relationship of the bones under the influence of body weight. This relationship frequently is the primary cause of the deformity. Weight-bearing views are also the best method for reproducibility.3,4 Weight-bearing views are not possible in infants, because they are obviously unable to stand erect, but simulating a standard positioning technique is beneficial.1
Some references relate that some of these angular measurements change from birth to approximately 6 years of age.5,6 After this age, most sources state that these angles remain relatively unchanged through adulthood. They feel that this change is a direct effect of weight bearing and ambulation as the child grows. Although it is difficult to dispute that this apparent change in the relationship between the bones of the foot is partially caused by weight bearing, the author feels more significant factors are creating this effect.
It is difficult to say if these changes in measurement actually represent a true change in the relationship between the bones and the weight-bearing surface. It may be due to the fact that the points used to draw axes on the radiograph change as the bones ossify and grow from their cartilaginous precursors. In other words, lines drawn on a radiograph in an infant are drawn in a different location on the bones in the same child years later. This may not represent an accurate method of determining a change in the bony relationships.
For example, Vanderwilde et al.5 measured and statistically analyzed several angles and axes in children from 6 to 127 months. The dorsoplantar measurements were made using the midline of the long axis of the ossified portion of bone at the time of the study. The lateral views included measurements using a line along the plantar surface of the calcaneus. Although the midline bisection may be more consistent as the bones ossify, the measurements are not consistent at the different ages and should not be used in comparison. Thapa et al.7 established a thorough review of normal parameters in the radiographic evaluation of the pediatric foot.
Although Vanderwilde et al.5 did not draw any conclusions in their article, this result can lead the reader to presume that an infant with an abnormally low calcaneal inclination angle clinically representing a flatfoot deformity will improve with age and the child will have a normal foot in later childhood. This is a dangerous conclusion to reach, because a large number of children may, therefore, be left untreated at an early age and continue through adulthood with the same deformity they were born with.
AXES AND ANGULAR RELATIONSHIPS
To properly evaluate a child’s radiograph, it is frequently necessary to make an objective analysis of the presence, severity, and progression of the deformity. A radiograph is a verifiable means of evaluating the condition at a particular point in time. In a majority of congenital deformities, we can measure the severity of the condition in a reproducible manner that allows other observers to visualize the deformity. A radiograph also provides objective evidence about the success or lack of progress that clinical treatment is having in regard to the child’s condition.
A number of angular relationships can be measured in the child’s foot. Axes are the lines that are drawn to determine the angular bony relationships seen on the radiographs. These axes are well described by Whitney8 and are illustrated in Chapter 13. The best way to perform this analysis on radiographic film is to tape a clear acetate sheet on to the x-ray film. The observer can either draw the lines on the acetate, which can be preserved for later measurements, or can purchase rub-off art lines, which are placed on the acetate. (These axes can also be easily generated and the angles measured on digital radiographs.)
Axes: Dorsoplantar View (Figure 14-1)
Talar Axis
The talar axis is the bisection of the long axis of the head and neck of the talus. In talipes equinovarus deformity, the bisection of the body of the talus is used to measure the deviation of the head and neck of the talus relative to the talar body.
Calcaneal Axis
The calcaneal axis is the bisection of the long axis of the ossified portion of bone.
First and Second Metatarsal Axes
A line connecting several midpoints along the length of the metatarsal forms a metatarsal axis.
Axes: Lateral View (Figure 14-2)
Talar Axis
The talar axis is measured the same way as in the dorsoplantar view. (In an infant, the axis is drawn through the midline of the ossified portion of visible bone.)
Calcaneal Axis
The calcaneal axis is a line formed by connecting the two most plantar points at the proximal and distal ends of the calcaneus. (In the infant, this axis is drawn through the midline of the ossified portion of bone.)
First Metatarsal Axis
An axis for the metatarsal is made from a line connecting several midpoints along the length of the metatarsal.
Angles: Dorsoplantar View
The dorsoplantar view (Figure 14-1) is perhaps the most useful foot radiograph in the child. In this view, the observer can examine the anatomy of all the visible foot bones to the greatest extent. It also reveals the attitude and relationship of the foot bones underneath the talus and leg bones in a weight-bearing attitude. The weight-bearing radiograph gives a “real-time” picture of how the foot bones are functioning under the influence of gravity on the body weight as well as any superimposed structural abnormalities.
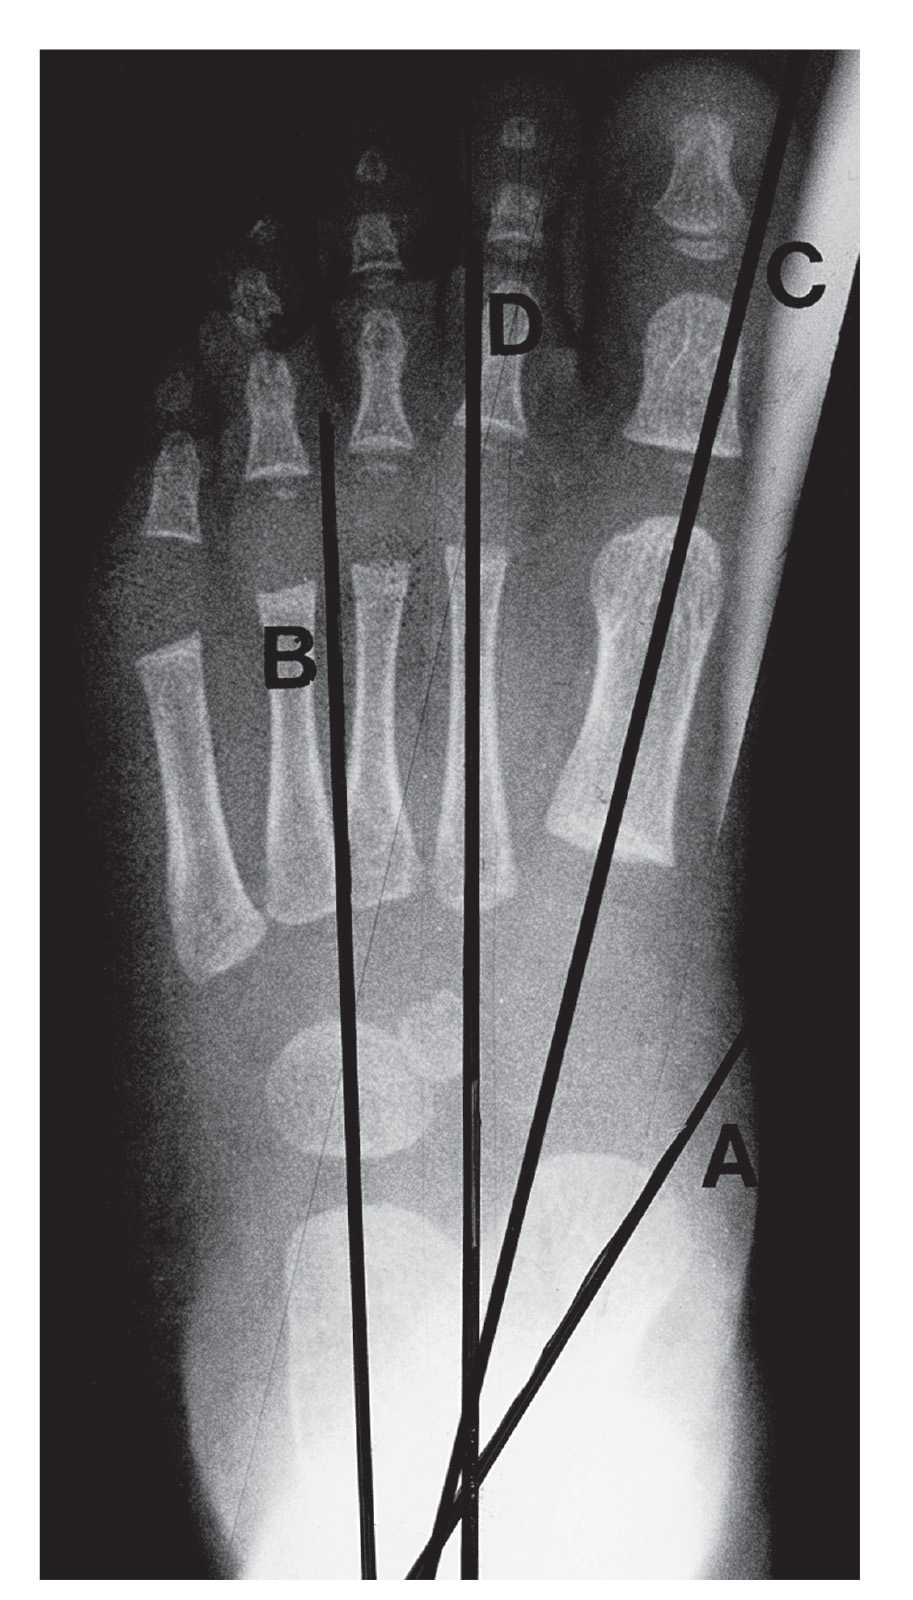
FIGURE 14-1. Dorsoplantar view axes and angles. Talar axis (A); calcaneal axis (B); first metatarsal axis (C); second metatarsal axis (D). Talocalcaneal angle (AB); metatarsus adductus angle (BD); talar–first metatarsal angle (AC).
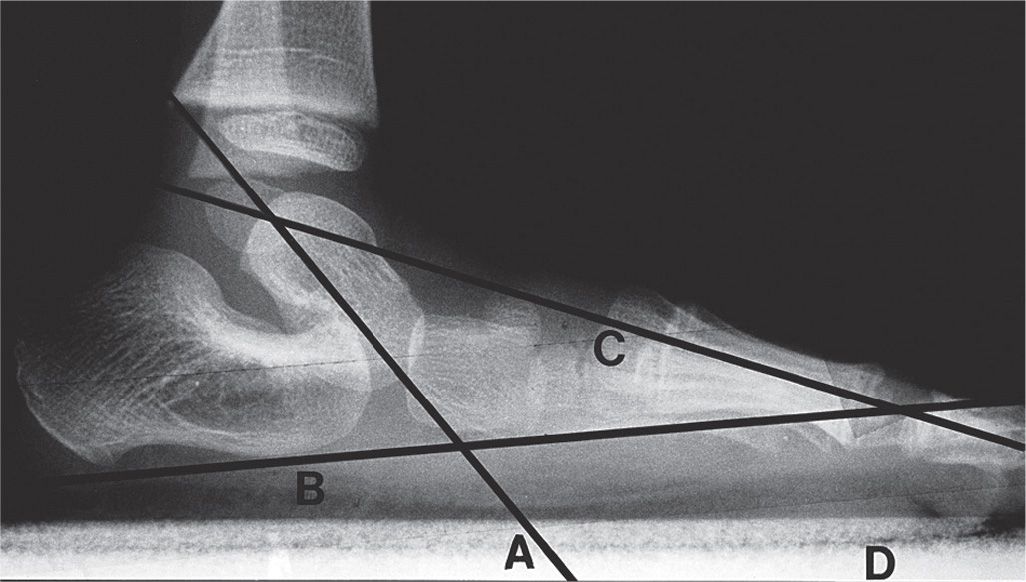
FIGURE 14-2. Lateral view axes and angles. Talar axis (A); calcaneal axis (B); first metatarsal axis (C); plane of support (D). Talocalcaneal angle (AB); talar–first metatarsal angle (AC); talar declination angle (AD); calcaneal inclination angle (BD); Hibb’s angle (BC).
Talocalcaneal Angle (aka Kite’s Angle)
The main feature of the dorsoplantar radiograph is the relationship between the talus and the calcaneus. This represents the attitude of the rearfoot and its relationship to the leg. In the infant, it is measured by the angle formed by the midline bisections of the long axes of the ossified portion of the talus and calcaneus. The normal range for the talocalcaneal angle is 30° to 40°.
The significance of this view includes the transverse-plane relationship of the talus over the calcaneus. The talus itself is locked in the ankle mortise, and it should be, for the most part, positioned above the calcaneus. An increase in the talocalcaneal angle indicates the calcaneus and the remainder of the foot have moved out and away (abducted and everted) from underneath the talus in the transverse and frontal body planes. This is seen clinically as a congenital pes valgus (flatfoot or calcaneovalgus) deformity. A decreased talocalcaneal angle indicates the calcaneus, and the remainder of the foot are directly underneath the talus and leg. A clinical example of this situation is talipes equinovarus deformity.
Metatarsus Adductus Angle
This angle reveals the relationship between the five metatarsal bones and the midtarsal bones of the foot at Lisfranc’s joint. An increase in this angle generally indicates a metatarsus adductus deformity, which is clinically seen as a form of intoeing, referred to as “pigeon-toed.” In infants, this angle is best determined by the lines representing the midline bisections of the long axes of the ossified portions of the calcaneus and the second metatarsal. The normal value for this angle is 10°. The calcaneus is the best rearfoot bone to use for this measurement in infants and young children. It is more closely linked to the metatarsals than is the talus, and most cases show little motion between the bones at these joints.
In older children, the metatarsus adductus angle can be determined by the angle formed between the axes of the second metatarsal and the intermediate cuneiform (Figure 14-3) as described by Engel et al.6 The normal mean value of Engel’s angle is approximately 18°; an angle greater than 24° is indicative of metatarsus adductus deformity. Root and Sgarlato described the relationship between the second metatarsal and the lesser tarsal bones (Figure 14-4). The normal metatarsus adductus angle with this method is approximately 21°.5,6,8 (See Chapter 13 for further discussion of these methods.)
Talar–First Metatarsal Angle
The talar–first metatarsal angle is measured using the bisection of the long axes of the ossified portions of the talus and first metatarsal. The talar–first metatarsal angle reveals the relationship between the forefoot and the rearfoot. Ideally, the talus and first metatarsal should be collinear. This alignment helps us determine how our body weight is carried over from the leg to the foot and indicates how the foot lines up with the leg. This measurement is valuable because these are the primary bones that are ossified and visible radiographically at birth. Simons is credited with the first study and description of this angle.5 He used it to evaluate the equinovarus deformity. The normal value is −20° to 0°.
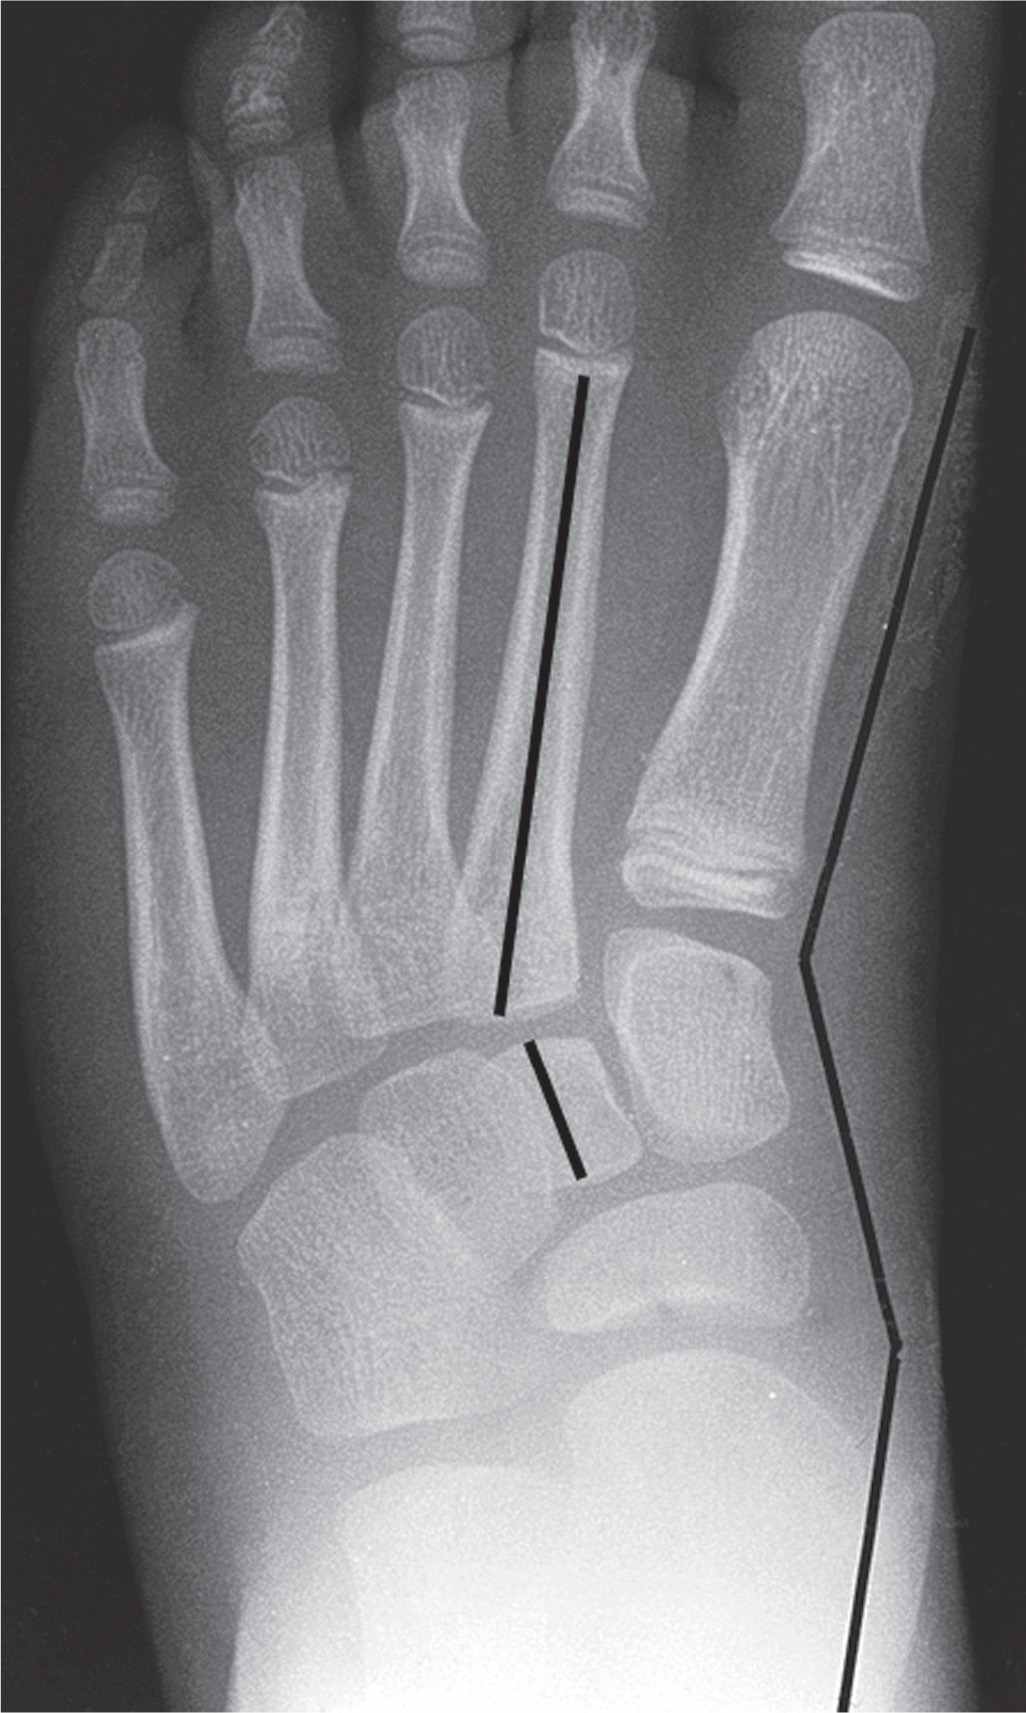
FIGURE 14-3. Engel’s angle; untreated metatarsus adductus deformity in an older child. The angle created between the second metatarsal and second cuneiform axes is Engel’s angle. Although the soft tissue outline of the foot appears generally straight as a whole, the forefoot, midfoot, and rearfoot components take a serpentine (Z) alignment (outer black lines). This alignment is caused by the rearfoot compensating for adduction in the forefoot. The talocalcaneal angle is mildly increased, and there is less talar head coverage by the navicular.
Angles: Lateral View
The lateral view (Figure 14-2) is best for viewing rearfoot deformities and reveals the relationship between the talus and the calcaneus. It should be performed with the patient in a weight-bearing attitude. (In infants, weight bearing is not always necessary but can be simulated.) A minimal “overlap” of the bones should be evident in normal feet where the talus rests over the posterior calcaneal facet and the sustentaculum tali. An increase in the “overlap” or “superimposition” of the bones on the lateral view indicates that the talus must have abducted away from underneath the talus, allowing the talar head to plantarflex beside the calcaneus.
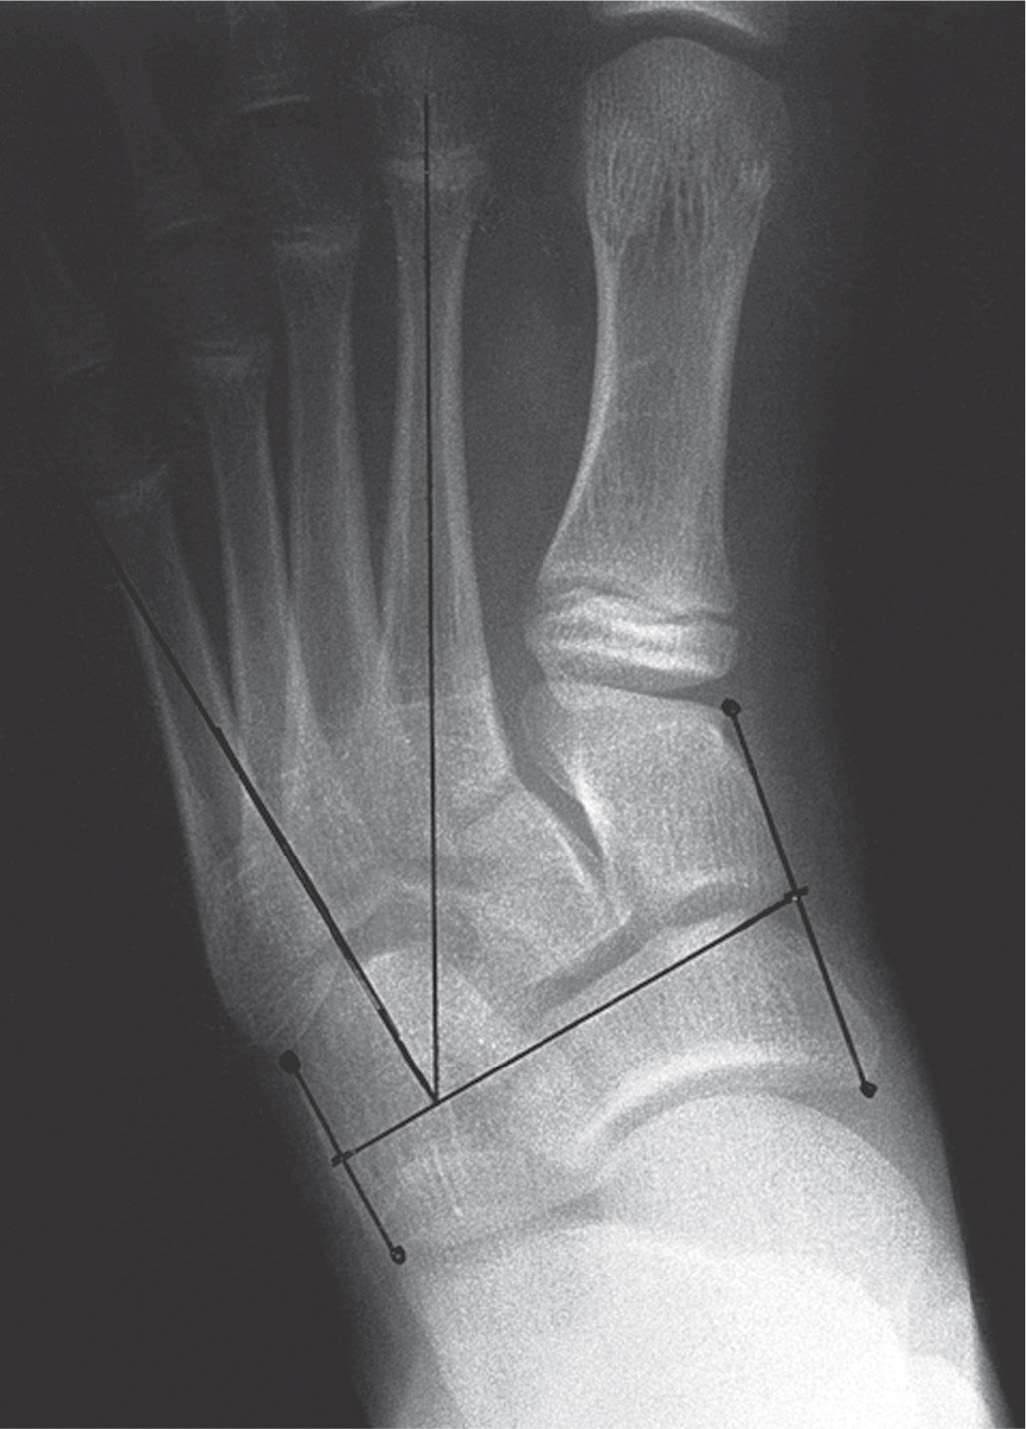
FIGURE 14-4. Lesser tarsus angle; metatarsus adductus in a 12-year-old. The second metatarsal and lesser tarsus axes are illustrated. Although the metatarsal bones are clearly adducted relative to the midtarsal bones, the foot appears somewhat straight overall because of the compensatory abduction/pronation in the subtalar joint. This gives the clinical appearance of a foot that has “outgrown” its intoeing that was present at birth.
Talocalcaneal Angle
The talocalcaneal angle is formed by the lines representing the bisection of the long axes of the ossified portions of the talus and calcaneus. The normal talocalcaneal angle is 35° to 40°. An increased talocalcaneal angle generally indicates that the talus has plantarflexed relative to and alongside the calcaneus as in calcaneovalgus or congenital pes valgus. A decreased angle indicates the talus is “riding” on top of the calcaneus as is seen in talipes equinovarus deformity.
Talar–First Metatarsal Angle (aka Meary’s Angle)
The long axis of the talus should normally pass through or be parallel to the long axis of the first metatarsal, resulting in a 0° angle. The talar and first metatarsal axes should, therefore, overlap or coincide. This angle reveals the sagittal-plane relationship of the forefoot and the rearfoot. When the first metatarsal axis is dorsiflexed relative to the talar axis, the talus is in a plantarflexed position clinically. This means that the talus is not directly over the calcaneus in its normal position. The calcaneus has moved away from underneath the talus and indicates a flatfoot deformity. The first metatarsal axis is plantarflexed relative to the talar axis in a cavus deformity.
Calcaneal Inclination Angle
Related posts:

Stay updated, free articles. Join our Telegram channel

Full access? Get Clinical Tree


