Systematic Evaluation of Bone and Joint Abnormalities
The radiologic thought process entails three processes: Detect, Describe, and Differential diagnosis (the 3 Ds). The interpreter must first recognize or detect an abnormal finding, describe the abnormal finding by using appropriate terminology, and, finally, determine a list of differential diagnoses based on the findings. This is no different from evaluating a new patient clinically; during the physical examination the clinician is looking for abnormal findings; if an abnormality is detected (e.g., a skin lesion), it must be described appropriately (papule, macule, scale, etc.); differential diagnoses are then determined (psoriasis, tinea, etc.).
The purpose of this chapter is twofold: (1) to illustrate detectable abnormal findings with appropriate terminology to describe them and (2) to provide a systematic method to evaluate a radiographic study and report the findings.
DETECT
To detect an abnormal finding, one must be able to predict the normal and variant expectations radiographically for each and every view. If not, normal and variant features of a structure will be misinterpreted as abnormal. Abnormalities are recognized and appreciated more readily if judged against the normal expected appearance of each structure. At the outset of image evaluation, consider all radiographic shadows normal anatomy until proven otherwise. If a shadow cannot be explained as normal radiographic anatomy, one can conclude that it is either variant or abnormal.
Familiarity with the normal and variant expectations takes time and requires looking at numerous radiographic studies. When doing so, consider all anatomical structures in every available view. Avoid the habit of immediately honing in on the area of question. Not only may you see other pathology but also as you analyze all anatomic structures, you will become more and more familiar with the normal and variant presentations. This, in turn, will greatly enhance your interpretation skills.
Do not rely on solely memorizing each and every pathologic picture; varying radiographic presentations are seen in many disorders. To complicate matters, since bone has a limited response to disease processes, different pathologies may have similar radiographic presentations.
The challenge is to recognize that an abnormality exists. A common pitfall when interpreting foot and ankle radiographs is mistaking normal anatomic shadows for pathology. It is, therefore, strongly recommended to keep at hand a loosely articulated set of foot and ankle bones when viewing radiographs of the same. (Familiarity with normal and variant radiographic anatomy cannot be emphasized enough.)
DESCRIBE
Anatomical structures display four primary radiographic features (Box 11-1). Every bone in a foot or ankle radiograph has a characteristic (1) position relative to other bones, (2) form in each view, (3) combination of densities, and (4) architecture. Therefore, if a bone is abnormal, it will display an abnormality of position, form, density, or architecture. This same terminology also applies to individual lesions found in bone. The few soft tissue structures encountered, such as the Achilles tendon and plantar fascia, have a characteristic position, form, and density in the radiographic image; however, most findings detected in the soft tissues are abnormalities of density.
Position
Appropriate terminology used to describe position abnormalities is listed in Box 11-2.
BOX 11-2 Terminology Used to Describe Positional Relationships
Apposition
Displacement
Alignment
Angulation
Distraction
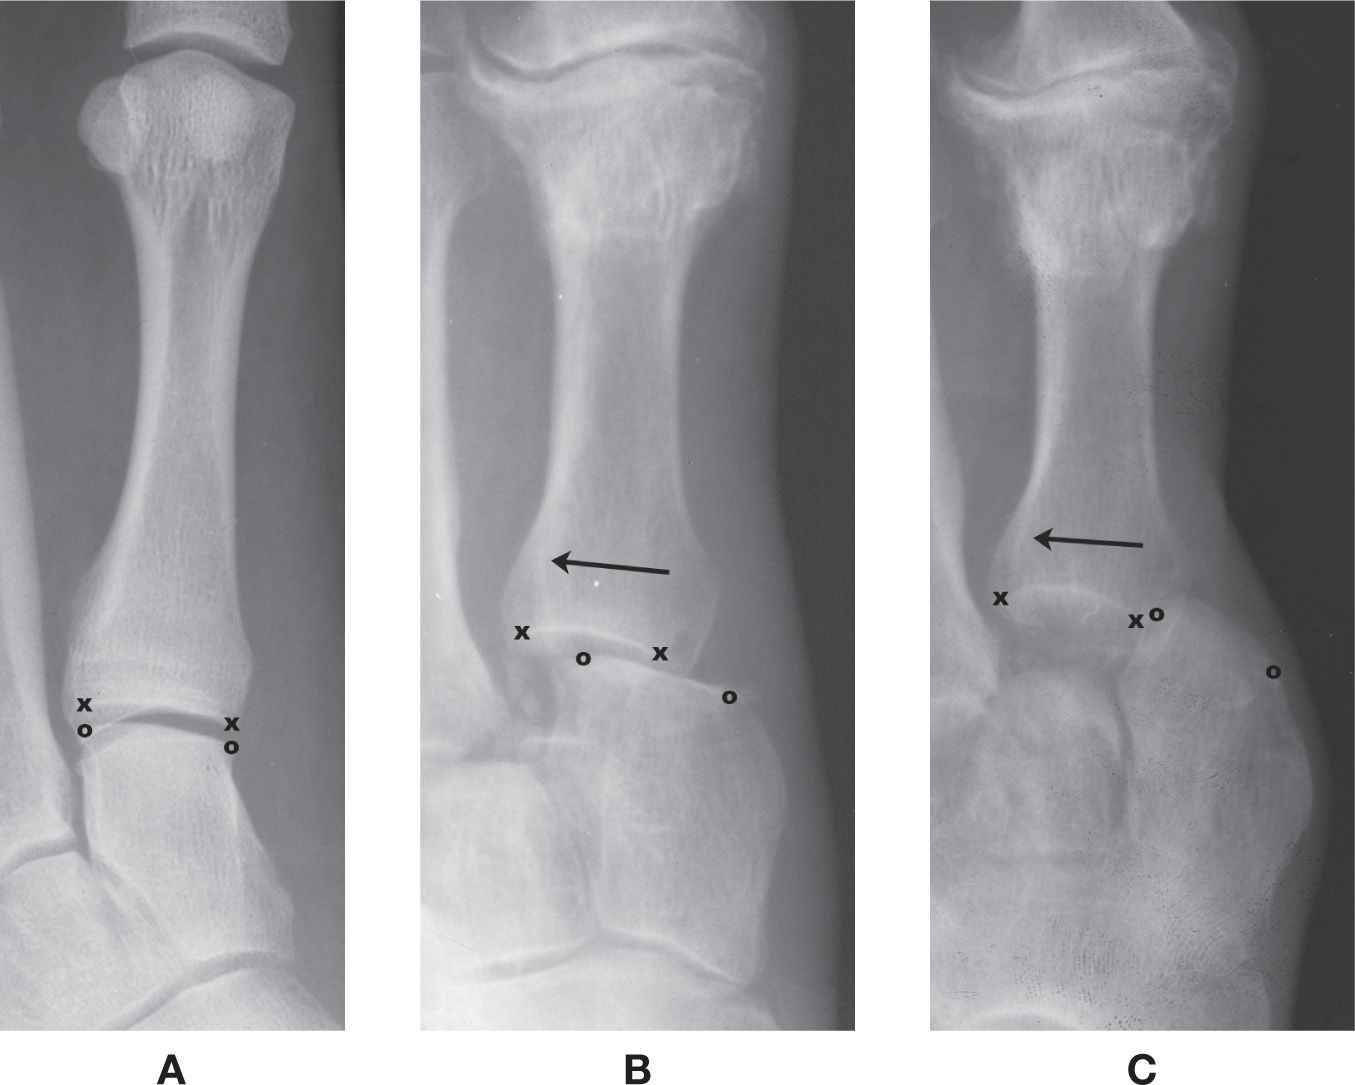
FIGURE 11-1. Apposition between two articular surfaces (x represents the medial and lateral margins of the first metatarsal base articular surface; o represents the medial and lateral margins of the adjacent medial cuneiform articular surface). A: 100% apposition (normal) between the first metatarsal base and the medial cuneiform. B: Partial (or ≈50%) apposition. C: 0% apposition. In B and C, the metatarsal is displaced laterally (arrow) relative to the cuneiform.
All normally occurring bones articulate with at least one other bone. The degree of contact (touching) between their two articular surfaces is referred to as apposition; there normally is 100% apposition between two bones at a joint%1 (Figure 11-1A). (An exception is the talonavicular joint, which also articulates with the plantar calcaneonavicular [spring] ligament.) When there is less than 100% apposition, the finding can be described as partial or no apposition (Figure 11-1B,C). Preferably, the amount of apposition would be described as follows: There is 50% apposition between the first metatarsal and medial cuneiform. The diagnosis for partial apposition is subluxation; 0% apposition represents dislocation.
If there is less than 100% apposition between two bones, then there must have been shifting of position or displacement of the distal bone in some direction relative to the proximal bone (Figure 11-1B,C). For example: The first metatarsal is displaced laterally relative to the medial cuneiform.
Alignment conveys the degree of parallelism of two bones.%2 Angulation is a lack of alignment or parallelism of two bones and can be described by the “tilt” of the distal segment relative to the proximal segment (Figure 11-2). (If this is difficult to ascertain, draw two lines, one parallel to the end of each bone; the two lines should cross if angulation is present. The apex formed by the two lines indicates the direction of angulation%3 [Figure 11-2B].) For example: The hallux proximal phalanx is angulated laterally relative to the first metatarsal.
The term distraction refers to when two bones are “pulled apart” from each other. There is a separation between the joint surfaces, which occurs without displacement and without ligament rupture.%4 Radiographically this will appear as an increased joint space (Figure 11-3).
The same position terminology described earlier is used when describing a fracture. Is there 100% apposition between the two fragments? If not, what direction is the distal segment displaced? Are the two fracture fragments aligned anatomically? If not, what direction is the distal segment angulated? A fracture must be described in two perpendicular planes to fully appreciate its three-dimensional position (Figure 11-4).
The axis of each bone has a characteristic position relative to neighboring bones; this is most applicable to the planar views, that is, dorsoplantar (or anteroposterior, if the ankle) and lateral. The angulation between two bones is assessed and compared to “normal” expectations, either by examining the nonangular positional relationships between bones (described later) or by measuring angles between axes. For example, in the dorsoplantar view the talocalcaneal angle (formed by the talar and calcaneal axes) is normally ≈21°; when the foot is pronated the angle increases (>24°), and it decreases (<18°) in supination (Figure 11-5). The finding may be, “The talocalcaneal angle is increased.” (Or, if it were measured, one could say, “The talocalcaneal angle is 30°.”) Symmetry should be compared between both feet if it is a bilateral study. For example: This finding is bilateral and symmetrical.
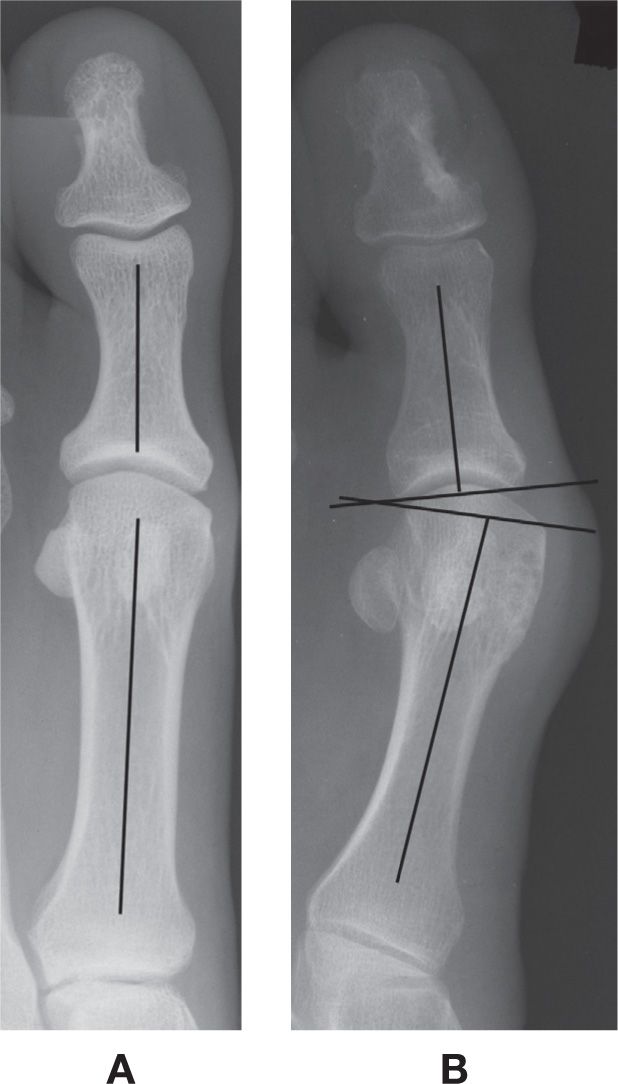
FIGURE 11-2. Bone position: alignment and angulation. A: Normal anatomic alignment (no angulation) between the hallux proximal phalanx and first metatarsal. B: Lateral angulation of the hallux proximal phalanx relative to the first metatarsal. The apex between the two articular surfaces points laterally.
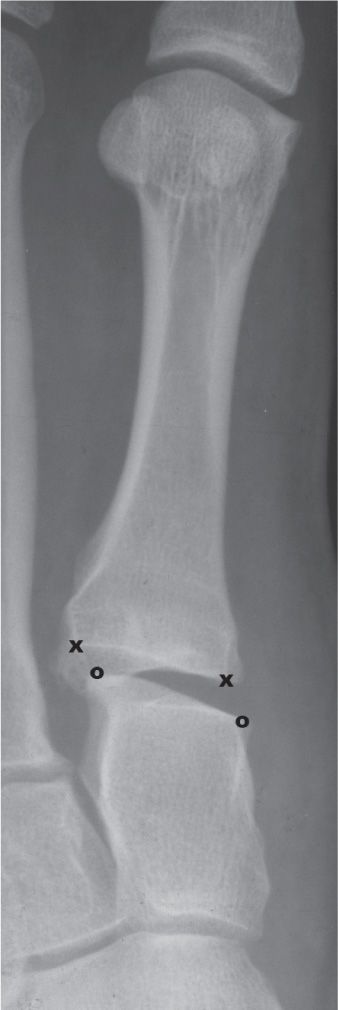
FIGURE 11-3. Distraction. There is separation between the first metatarsal base and the medial cuneiform. Though there appears to be slight displacement, there may not be full rupture of the binding ligaments. (x represents the medial and lateral margins of the first metatarsal base articular surface; o represents the medial and lateral margins of the adjacent medial cuneiform articular surface.)
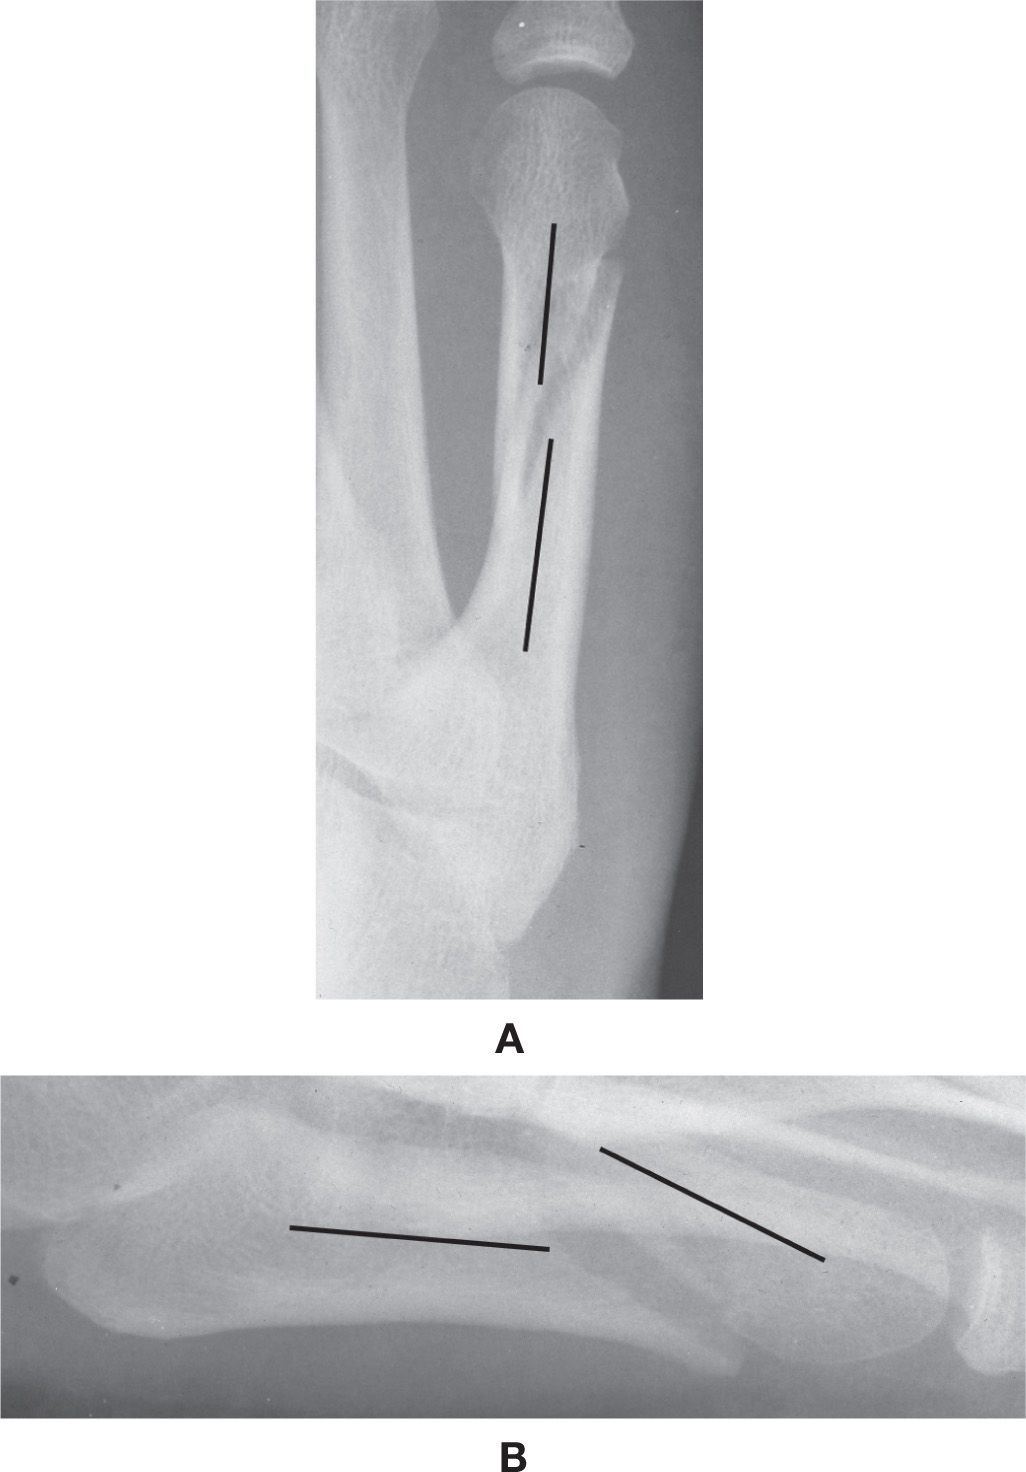
FIGURE 11-4. Fracture position: two perpendicular planar views of a fifth metatarsal diaphyseal fracture. A: Dorsoplantar view: The distal fracture segment (upper line) is slightly displaced medially with minimal to no angulation relative to the proximal segment (lower line). B: Lateral view: The distal segment (right line) is displaced superiorly and angulated inferiorly relative to the proximal segment (left line).
Form
Form refers to the natural features or characteristics of a bone. Terms used to describe form abnormalities are listed in Box 11-3. Simple, everyday terms may sometimes be useful to describe abnormalities of form.
BOX 11-3 Terminology Used to Describe Characteristics of Form
Shape (round, oval, geographic)
Definition (well- or ill-defined)
Size (large or small)
Length (short or long)
Contour (irregular, expanded, deformed, scalloped, undulating)
Girth (increased or decreased)
Tubulation (over- or under-)
Bowing
Describing the shape of an abnormality may be simple as it appears, such as round or oval. Other times a figurative term may suffice, examples being rice like or serpiginous.
The term geographic may be less specific but implies form and, more importantly, definition: if a lesion is geographic, it must be well defined; its opposite would be ill defined. The definition of a lesion is important for determining whether the related pathology is acute (ill defined) or chronic (well defined).
The girth of a short tubular bone (such as the metatarsal or phalanx) is affected by subperiosteal remodeling: apposition increases the girth; resorption decreases it. Decreased girth (overtubulation, overconstriction) of short tubular bones, for example, is seen with the variant spool-shaped phalanx and pathologic states such as osteogenesis imperfecta (Figure 11-6). Increased girth (undertubulation, underconstriction) is related to periosteal apposition of bone (as seen in hypertrophic osteoarthropathy, some congenital disorders and skeletal dysplasias), although it may be a variation of skeletal development (Figure 11-7).
Increased and decreased bone length should also be noted (Figure 11-8). Irregularity or deformity of the bone’s normal contour may be caused by periosteal apposition (Figure 11-7), an exostosis along the outer aspect of a bone (Figure 11-9A), or by “expansion” of the cortex (Figure 11-9B). Bowing of large tubular bones is associated with osteomalacia and rickets.
A bony “outgrowth” is often referred to as a spur, osteophyte, or exostosis. However, the author does not use these terms interchangeably and finds it valuable to distinguish between them based on location (Figure 11-10). A spur is a bony outgrowth at an enthesis (where soft tissue attaches to bone); if at the margin of an articulation, a spur is more specifically called an osteophyte. In contrast, a bony outgrowth that is not located at an enthesis (e.g., the diaphysis of a tubular bone) is an exostosis. This nomenclature is useful for narrowing down the differential diagnoses: enthesopathy (for spur), osteoarthritis (for osteophyte), and either posttraumatic exostosis or osteochondroma for an exostosis.
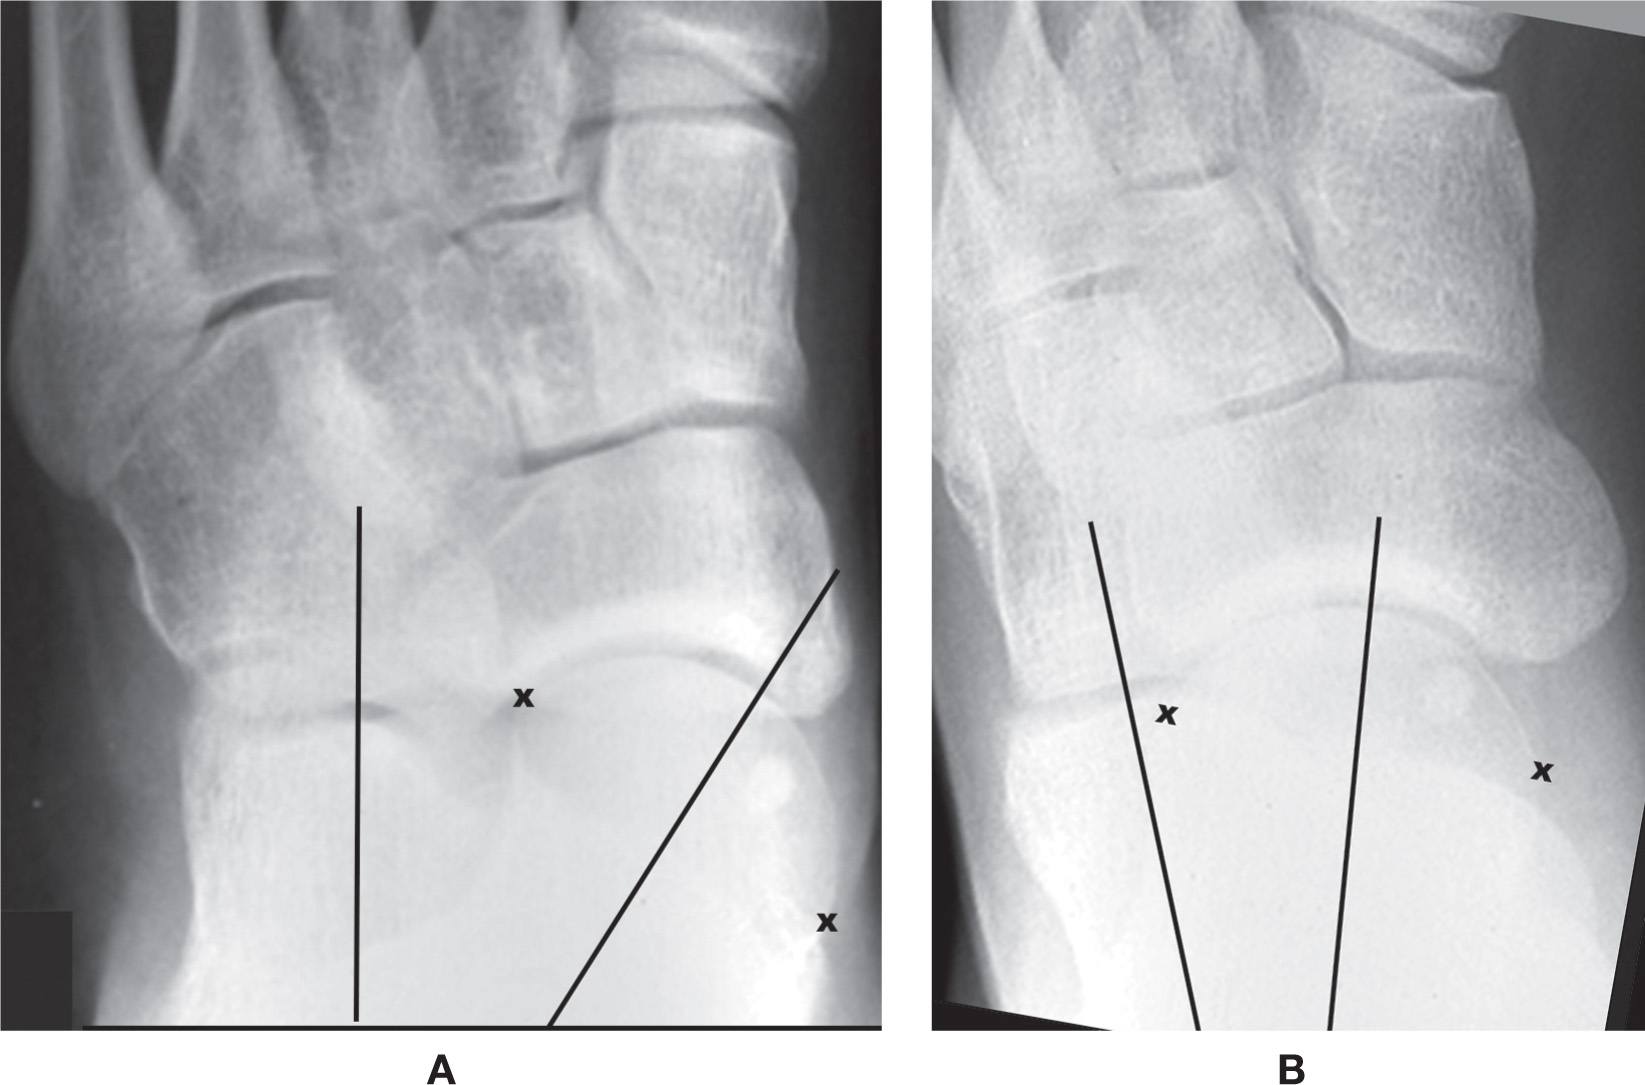
FIGURE 11-5. Changes in the position of the talar and calcaneal axes (lines) relative to one another in (A) pronation (the talocalcaneal angle is increased) and (B) supination (the talocalcaneal angle is decreased). (x represents the medial and lateral margins of the talar head articular surface.)
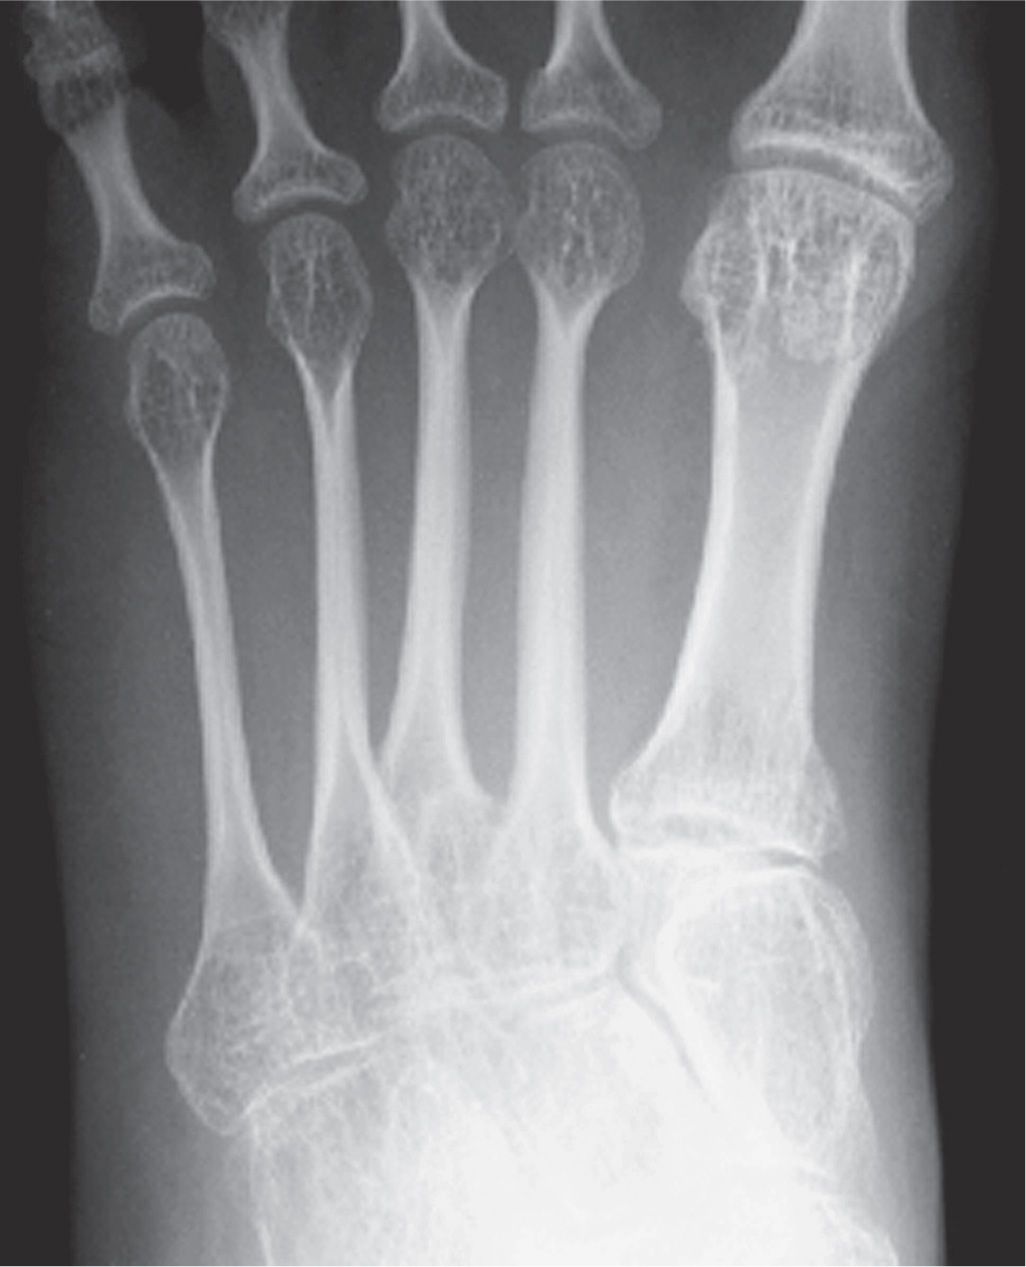
FIGURE 11-6. Overtubulation (decreased girth) of metatarsals (osteogenesis imperfecta).
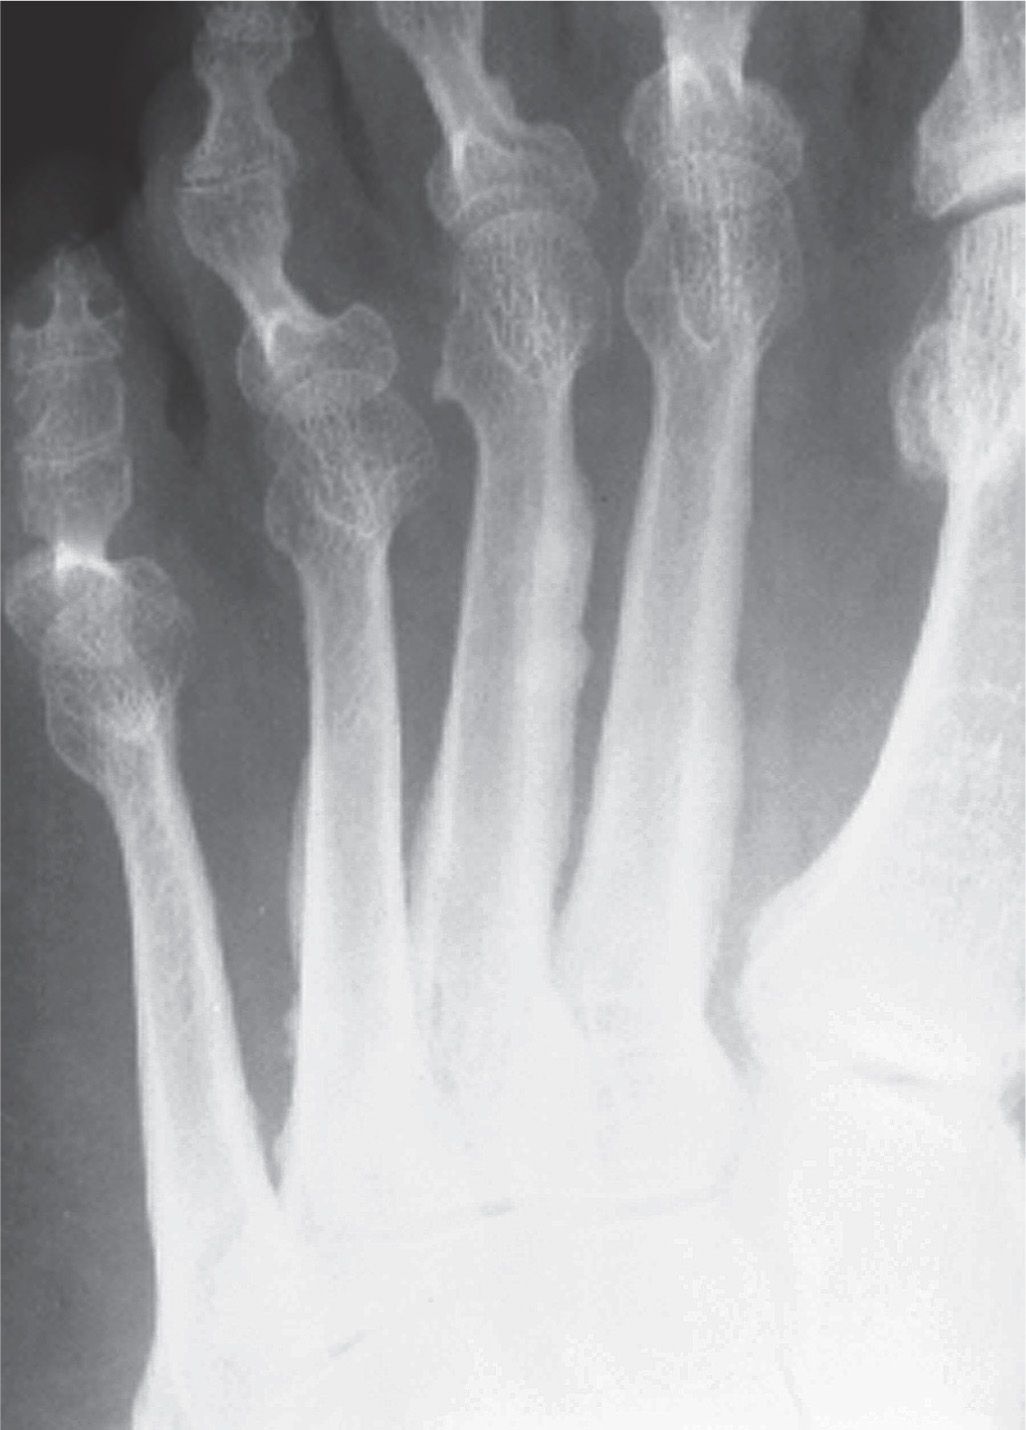
FIGURE 11-7. Undertubulation (increased girth) of metatarsals. Periosteal bone apposition of the second, third, and fourth metatarsals (unknown etiology, possibly a variation). The outer margins demonstrate contours that could be described as irregular, undulating, or serpiginous.
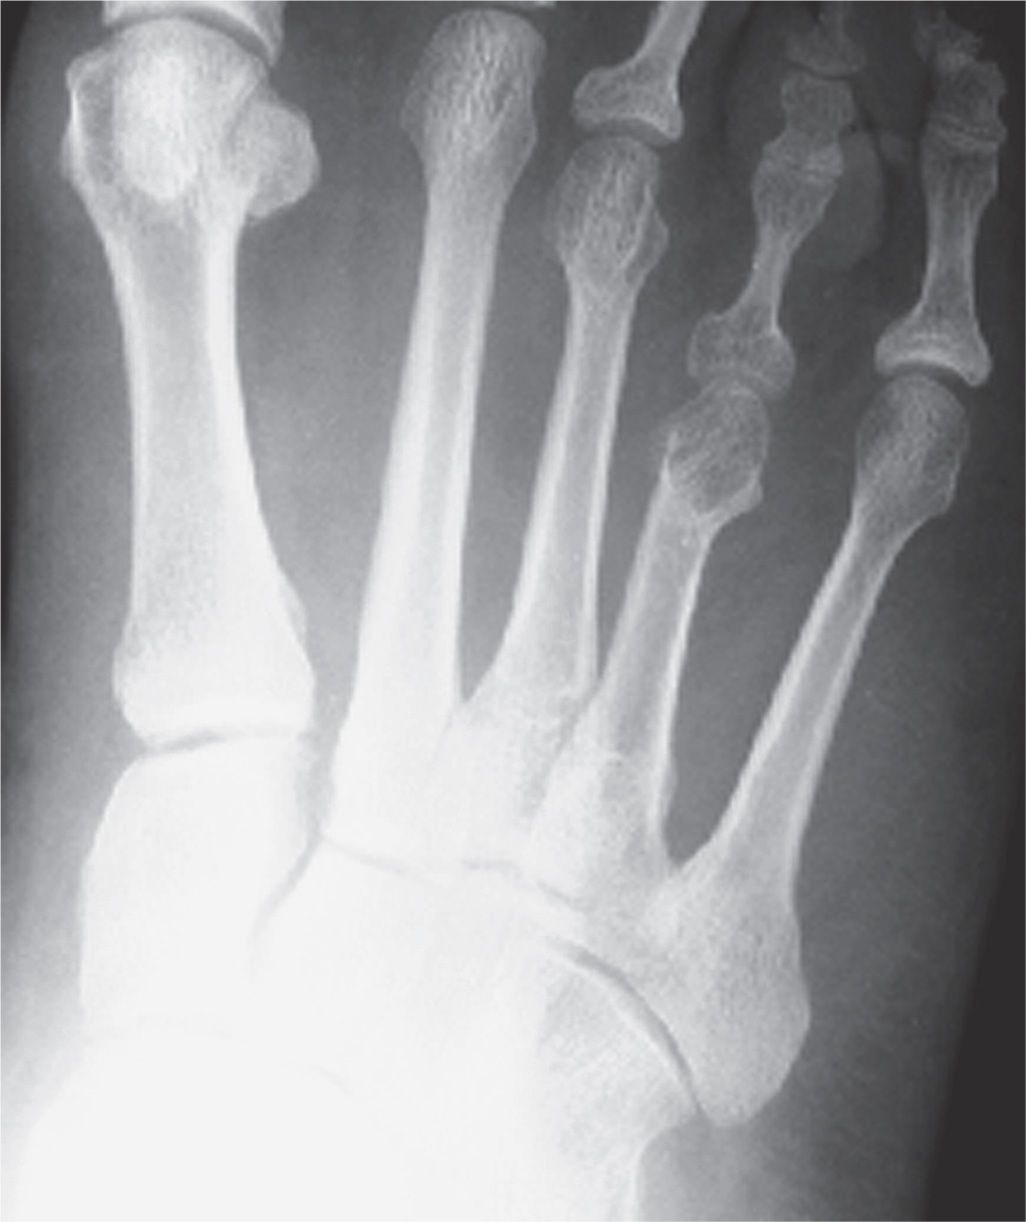
FIGURE 11-8. Abnormal bone length. Short fourth metatarsal.
If there is uncertainty as to how to describe an abnormality of form, one could simply use the term deformity. However, in most cases, a specific description is preferred.
Density
Density refers to the degree of blackness seen in the radiograph. The term is relative; that is, increased or decreased density depends on the blackness of surrounding structures. Differing degrees of subject radiodensity are what constitute the radiographic image. Therefore, some decreased densities are normal findings, and others are abnormal (Figure 11-11). The same holds true for increased densities (Figure 11-12). You must become familiar with the normal radiographic anatomy of all soft tissue and osseous structures before you can differentiate between normal and abnormal radiodensities.
Several terms are used interchangeably to describe subject radiodensity in the radiograph (see Box 11-4). For example, the terms sclerosis, eburnation, and radiopacity are used to denote increased bone density. Abnormal increased density in bone usually indicates reactive new bone or tumor bone formation. Other names for decreased bone density are osteopenia, radiolucency, and rarefaction. The terms osteoporosis, demineralization, undermineralization, and deossification should not be used for describing relative radiodensities because they imply specific etiologies.%5
Applicable adjectives should be used, when appropriate, to describe the form of an abnormal density (Box 11-4). For example, in bone, an ill-defined decreased density may have a permeative or moth-eaten (spotty, mottled) appearance; a well-defined, localized decreased density that has sharply delineated margins can be described as being geographic (Figure 11-13). An abnormal decreased density seen in soft tissues is air, especially gas produced by some anaerobic bacteria (Figure 11-14). Increased soft tissue densities may be related to ectopic calcification or ossification (Figure 11-15). The earliest finding of a periosteal reaction is a localized increased density at the interface between the bone’s outer margin and adjacent soft tissue (Figure 11-16). Joint effusion appears as a fairly well defined increased soft tissue density adjacent to an articulation (Figure 11-17).
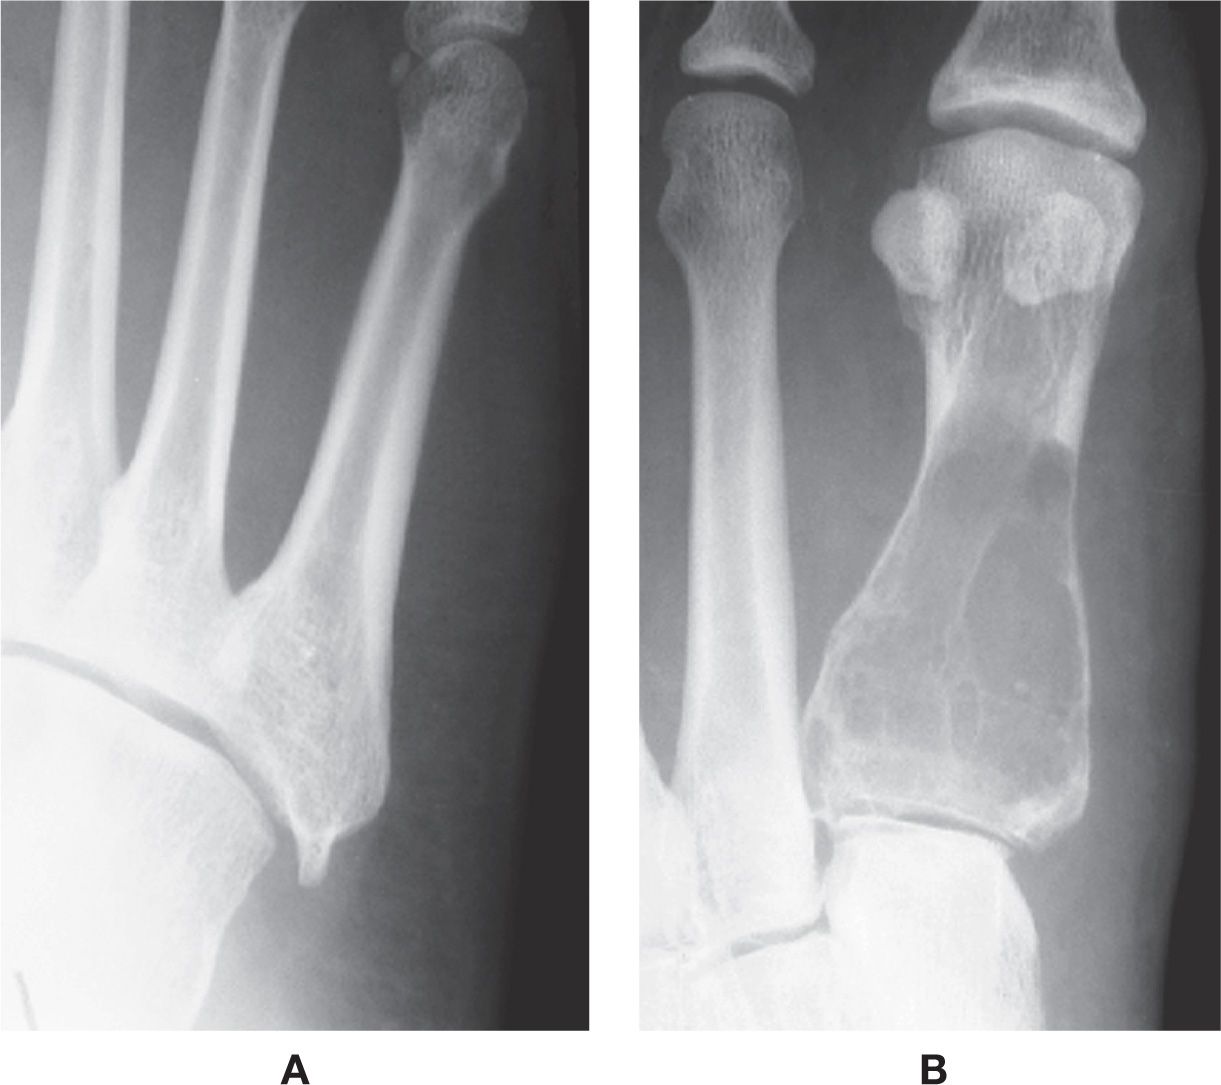
FIGURE 11-9. Abnormal contour. A: Spur at the fifth metatarsal tuberosity. B: “Expanded” cortex, also referred to as a shell periosteal reaction (first metatarsal).
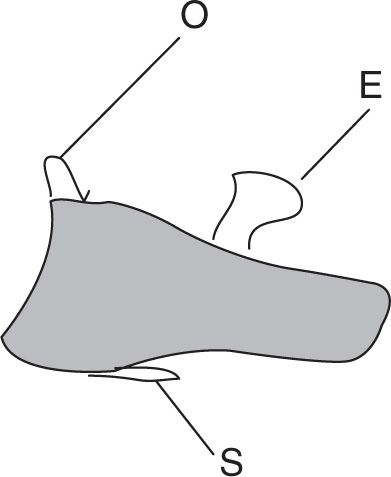
FIGURE 11-10. Examples of “bony outgrowth” on the hallux distal phalanx (lateral view). Spur (S), osteophyte (O), and exostosis (E).
BOX 11-4 Synonyms Used in Place of and Adjectives Used in Conjunction with Relative Increased and Decreased Densities
| Increased Density | Decreased Density |
Synonyms | Radiopacity | Radiolucency |
| Sclerosisa | Rarefactiona |
| Eburnationa | Osteopeniaa |
|
| Osteolysisa |
Adjectives | Cloudlike | Geographic |
| Solid | Mottleda |
| Ivory-like | Spotty |
| Stippled | Motheatena |
| Speckled | Permeativea |
| Rings and arcs |
|
| Flocculent |
|
| Hazy |
|
| Ground glassa |
|
| Serpiginous |
|
Related posts:

Stay updated, free articles. Join our Telegram channel

Full access? Get Clinical Tree


