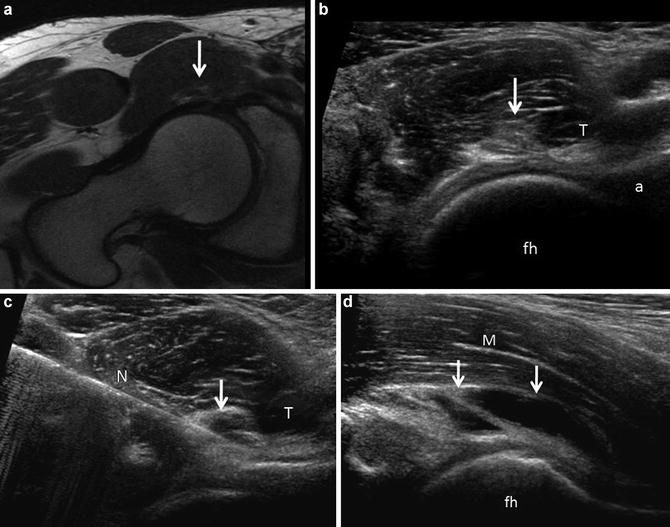
Fig. 1
(a) Representative long axis orientation obtained from a proton density acquisition of the hip showing the transducer position relative to the acetabulum and femoral head-neck junction. The femoral head (fh), femoral neck (fn), acetabulum (a), capsule (c), labrum (L) and iliopsoas muscle (m) are labeled. (b) Corresponding long-axis ultrasound image displaying the sonographic anatomy. A thin hypoechoic (dark) band overlies the femoral head, corresponding to the articular cartilage. Alternatively, fibrocartilage (labrum, black arrow) appears hyperechoic (bright) on ultrasound. Note the absence of echoes deep to the cortical surfaces due to the presence of posterior acoustic shadowing. The labels are similar to (a)
In short axis, the femoral head appears convex with overlying hypoechoic articular cartilage and echogenic joint capsule (Fig. 2). The iliopectineal eminence of the acetabulum is visualized as a cortical specular reflector medial to the femoral head. An echogenic ellipse abutting the acetabulum, which may lie within a thin capsular depression, corresponds to the iliopsoas tendon. The pectineus muscle belly lies medial to the iliopsoas tendon and superficial to the acetabulum. Superficial and medial to the iliopsoas muscle/tendon complex lies the neurovascular structures, femoral artery, and vein (hypoechoic ellipses in short axis), adjacent to the femoral nerve (variable echogenicity and may have a fascicular appearance). The iliopsoas bursa lies deep and often medial to the tendon at this anatomical level and is generally not distended in asymptomatic individuals [9].
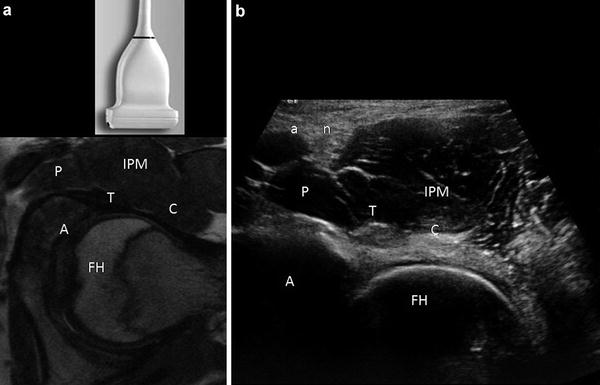

Fig. 2
Short-axis ultrasound of the hip. (a) Axial proton density image displaying the transducer position and relationship of the femoral head (FH), acetabulum (A), pectineus muscle (P), iliopsoas tendon (T), iliopsoas muscle (IPM) and capsule (C). (b) Corresponding ultrasound anatomy. Note that the iliopsoas tendon (T) appears hyperechoic in distinction to the low signal intensity of the tendon on MR. Muscle is hypoechoic, containing echogenic linear structures, corresponding to fascial boundaries and perimyseal connective tissue. The tendon sits in a small capsular depression and overlies the anterior labrum. The femoral artery (a) and nerve (n) are labeled. The remaining labels are similar to (a)
Distension of the joint capsule is appreciated as separation from the cortical margin, often appearing convex (Fig. 3). The nature of the material distending the joint is quite variable. Fluid is typically anechoic or hypoechoic, but can appear echogenic, such as in an acute hemarthrosis [11] Synovitis or capsular thickening may be difficult to distinguish from complex fluid. Various measurements of capsular distention have been suggested to assess for joint effusion [6]. Direct compression with the ultrasound transducer resulting in redistribution of the material or arthrocentesis is the only reliable method to distinguish fluid from other soft tissue processes. Material that is incompressible or demonstrates vascularity on Doppler imaging confirms its solid nature.
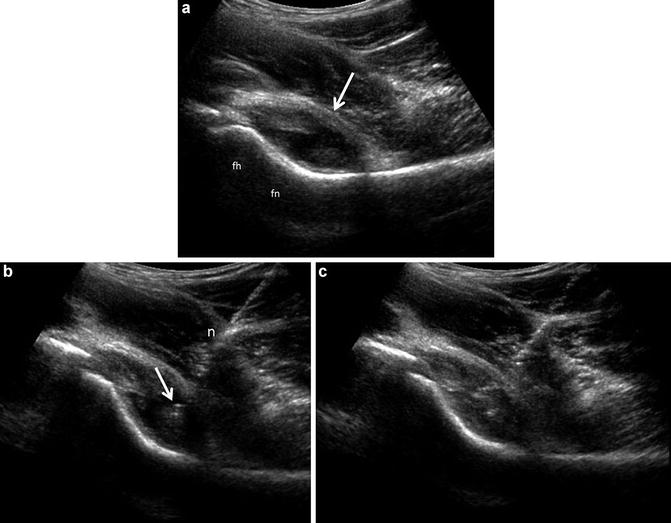

Fig. 3
Joint effusion with ultrasound guided aspiration. (a) Long-axis ultrasound image of the hip depicting distension of the anterior capsule (arrow), which assumes a convex margin. The material distending the capsule consists of hypoechoic effusion containing low level echoes as well as nodulular echogenic areas of synovial proliferation. The femoral head (fh) and femoral neck (fn) are labeled. (b) A 3.5 in. 20 gauge spinal needle (n) has been placed into the hip joint using a long-axis approach. The needle tip (arrow) is positioned within the hypoechoic material noted in (a). (c) Aspiration of the hypoechoic material confirmed its fluid composition, leaving only the echogenic proliferative synovium
The cortical surface is normally smooth and continuous. The presence of contour deformities, osteophytic ridges, and joint bodies may be evident on sonography (Fig. 4). Diminished offset of the femoral head-neck junction may be measured sonographically in the setting of a CAM-type femoral acetabular impingement (FAI) [12, 13]. Likewise, the presence of labral pathology, which often affects the anterior superior labrum, may be conspicuous as intrasubstance hypoechoic clefts, a blunted or fragmented labrum (Fig. 5). Fluid imbibition into the labrum following intra-articular injection can result in improved conspicuity of the labral tear (Fig. 6) [14–16]. Observation of the hip during flexion with internal rotation (FADIR maneuver) may help assess dynamic impingement. Likewise, real-time observation in patients with snapping hip syndrome (below) may provide useful information as to the etiology.
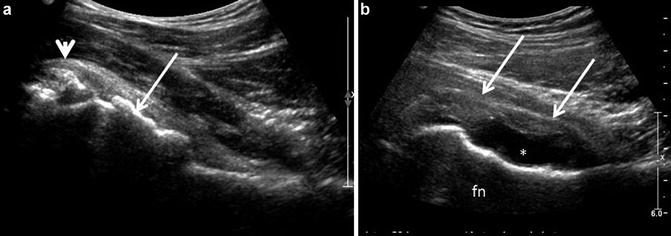
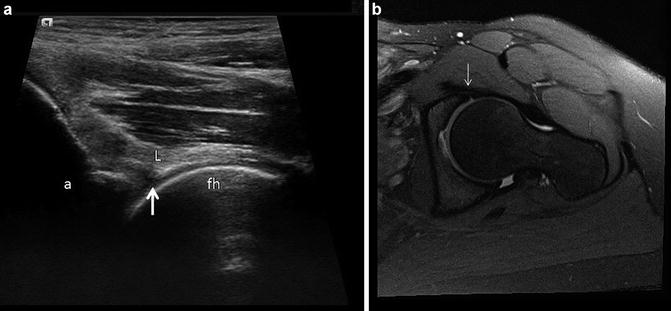
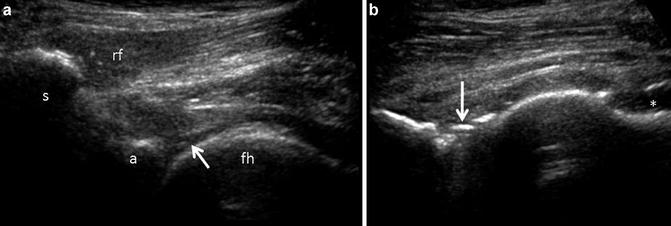

Fig. 4
(a) Osteoarthrosis. Hypertrophic changes at the femoral head-neck junction are evident (arrow) resulting in loss of the smooth convex/concave transition. In addition, a rounded echogenic area contiguous with the anterior joint capsule and overlying the anterior superior labrum (arrowhead) corresponds to a joint body. (b) Post-operative deformity. The patient has had previous resection of a CAM lesion with an irregular concave margin of the femoral head/neck (fn) junction. A moderate effusion (*) is present with proliferative synovium or thickened capsule (arrows)

Fig. 5
Labral tear. (a) Long-axis ultrasound image of the hip showing an obliquely oriented hypoechoic fissure (arrow) extending through the deep surface of the anterior labrum (L). The acetabulum (a) and femoral head (fh) are labeled. (b) Corresponding oblique axial fat suppressed proton density image shows fluid imbibition into an obliquely oriented intrasubstance tear (arrow) in the same patient and at approximately the same anatomic level

Fig. 6
Fluid/microbubble imbibition into a labral tear. (a) Patient with groin pain sent for ultrasound guided therapeutic injection. An obliquely oriented fissure (arrow) is present within the labrum, suggesting the possibility of a non-displaced labral tear. The direct head of the rectus femoris (rf) is present in this image and labeled. The anterior inferior iliac spine (s), acetabulum (a) and femoral head (fh) are labeled. (b) Following the therapeutic injection, there is fluid distension of the anterior joint capsule (*) and linear echogenic material present within the labral substance (arrow) that was not present on preliminary imaging, relating to fluid and microbubble imbibition into the labral substance and confirming the presence of a tear
Muscles and Tendons
It is convenient to separate the muscles/tendons into anterior, medial, lateral, and posterior compartments. The anterior compartment consists of the iliopsoas, rectus femoris, and sartorius muscles and the remaining quadriceps compartment muscles distal to the hip joint proper. The medial compartment consists primarily of the gracilis and adductor muscles. The pectineus and obturator muscles are not frequently examined on ultrasound; the lateral compartment consists of the tensor fascia lata, inclusive of the iliotibial tract, and gluteus minimus, medius, and maximus. The posterior compartment primarily consists of the hamstring tendons and muscles, piriformis, and short external rotators.
Muscles appear hypoechoic containing fine linear echogenic structures corresponding to the perimyseal connective tissue [17, 18]. The epimyseal connective tissue appears echogenic (Fig. 7). The rectus femoris and sartorius muscles can be traced proximally to their respective tendons. It is important to recognize that in distinction to MR, tendons appear as compact echogenic and fibrillar on ultrasound and are subject to anisotropy (Fig. 8) [19].

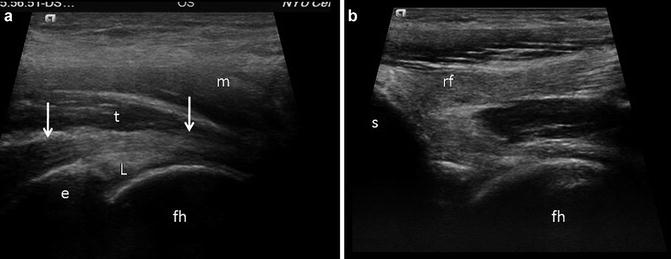

Fig. 7
Professional football player with semitendinosus strain. (a) Transverse sonogram of the semitendinosus muscle belly contrasting edematous (e) and normal (n) muscle. Normal muscles appear as a hypoechoic (dark) background containing fine linear echogenic structures corresponding to perimyseal connective tissue. The epimyseal connective tissue appears echogenic boundary (arrow). Edematous muscle (e) due to a grade 1 strain, as in this case, appears echogenic and often displays increased volume. (b) Long-axis extended field-of-view sonogram in the same individual shows the normal appearing muscle (n) with linearly oriented perimyseal connective tissue with a hypoechoic background in contrast to the superficial grade 1 strain, displaying increased echogenicity (e). The epimyseal connective tissue is denoted by arrows

Fig. 8
Normal tendon. (a) Iliopsoas tendon. Longitudinal ultrasound image of the iliopsoas tendon (t) as it passess over the iliopectineal eminence (e) and capsular labral complex (L). The tendon appears as a compact linear fibrillar structure that displays greatest echogenicity centrally and is more hypoechoic on either proximal or distal end (arrows) due to anisotropy. The overlying muscle (m) appears hypoechoic. The femoral head (fh) is labeled. (b) Longitudinal ultrasound image in the same patient obtained slightly more laterally shows the origin of the direct head of the rectus femoris (rf) arising from the anterior inferior iliac spine (s). Again the tendon appears compact, echogenic and fibrillar. The femoral head (fh) is labeled
The latter refers to the variable tendon echogenicity determined by the direction of insonation by the ultrasound transducer. The iliopsoas, direct head of the rectus femoris, and sartorius origins are well seen, while the indirect head of rectus femoris may appear artificially hypoechoic due to anisotropy, as it courses along the lateral margin of the acetabulum. Other tendons that are well evaluated on ultrasound are the adductor tendon origins (longus and brevis), abductor tendon insertions at the greater trochanter, and hamstring tendon origins at the ischium, including the adductor magnus, as well as the iliotibial tract (Fig. 9). Individual tendons may be traced to their respective muscles during real-time examination [7–9]. EFOV imaging may be of value in order to better display the myotendinous unit [10].
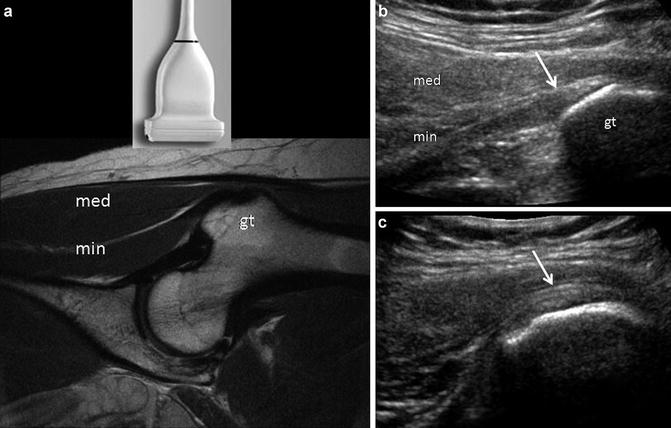

Fig. 9
Normal abductor muscles. (a) The abductor group is often best evaluated with the patient in a decubitus position and with the transducer positioned over the greater trochanter (gt), as depicted in this coronal proton density image. In this case the gluteus minimus tendon/muscle (min) is evident in the plane of the transducer, as is the gluteus medius muscle (med). (b) Sonogram obtained in the same plane as (a) depicts the echogenic gluteus minimus tendon (arrow) as it inserts on the anterior facet of the great trochanter (gt). The gluteus minimus (min) and medius (med) muscles are labeled. (c) Sonogram obtained in the logitudinal plane, slightly more posteriorly on the lateral facet shows part of the gluteus medius tendon insertion (arrow) onto the lateral facet of the greater trochanter
Knowledge of normal anatomic relationships allows identification of these structures. The sciatic nerve is seen as an echogenic ellipse at the level of the hamstring origin situated superficial to the quadratus femoris and abutting the inferolateral margin of the conjoint tendon (Fig. 10). The nerve is usually well seen below this level as it courses in the intermuscular fascia between medial and lateral hamstrings. Proximal to the ischium, the nerve assumes a flatter configuration as it enters the sacrosciatic notch and courses deep to the piriformis muscle.
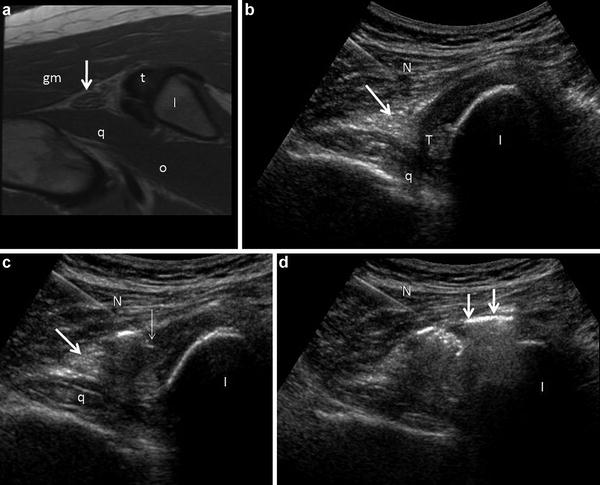

Fig. 10
Hamstring origin in short axis in 35 year old marathon runner. (a) Axial FSE proton density image depicts the hamstring origin (t), which appears tendinotic (containing intermediate background signal intensity), the sciatic nerve (arrow), the gluteus maximus (gm) and potions of the quadratus femoris (q) and obturator extenernus (o) muscle groups. The ischium (I) is labeled. (b) Transverse sonogram obtained in the same patient during a guided peritendinous injection, using a lateral approach. The needle (N) is positioned within the belly of the gluteus maximus above the sciatic nerve (arrow). The nerve appears as a heterogeneous echogenic ellipse overlying the quadratus femoris muscle (q) and closely related to the inferior margin of the hamstring tendon origin (t). The hamstring tendon origin appears largely hypoechoic, likely due to anisotropy. The ischium (I) is labeled. (c) The needle (N) has been advanced to the lateral margin of the hamstring tendon origin above the sciatic nerve (arrow). The tip of the needle (thin arrow) is depicted, as are the ischium (I) and quadrates femoris (q). (d) Microbubbles and fluid (arrows) from the injectate surround the tendon origin and adjacent sciatic nerve during this peritendinous injection. In the author’s experience, the optimal distribution is peritendinous avoiding intratendinous and intramuscular intravasation. Portions of the ischium (I) and tendon are obscured because of artifact produced by the microbubbles
Tendinosis is characterized by loss of the normal compact fibrillar architecture [9, 19]. Tendons may appear enlarged and heterogeneous, containing intrasubstance fissures and areas of cystic degeneration (Figs. 11 and 12) [19]. Areas of intra- and peritendinous neovascularity may be apparent, although reduced Doppler sensitivity may be a limiting factor in assessing vascularity. Punctuate areas of dystrophic calcification may occur, as well as more globular deposits in the form of calcium hydroxyapatite. Enthesopatic ossification is often seen about the tendon origins and insertions and should not be mistaken for calcific tendinosis. Correlation with radiographs may be necessary to distinguish these. Calcific tendinosis can occur about the hip, most frequently affecting the abductor insertions and rectus femoris origin, although these calcific deposits can occur anywhere about the musculoskeletal system (Fig. 13) [9, 20]. Tears appear as discrete hypoechoic defects within the tendon (Fig. 12). Chronic tears may also be attritional with diffuse tendon thinning. Complete tears are associated with retraction of the myotendinous unit often resulting in shadowing at the retracted stump.
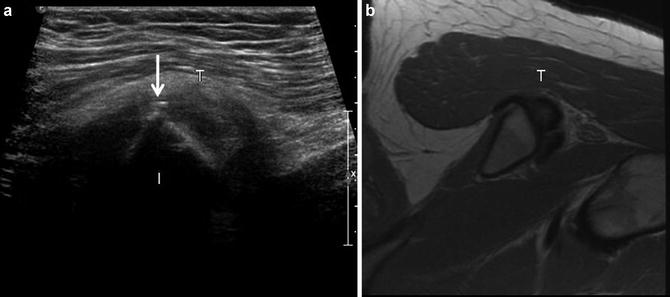
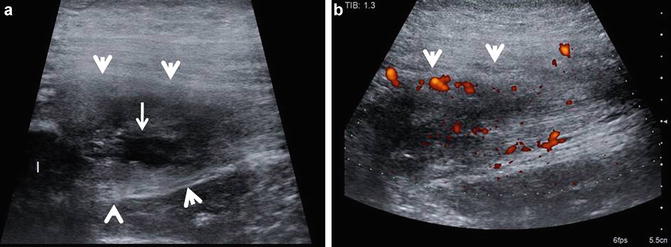
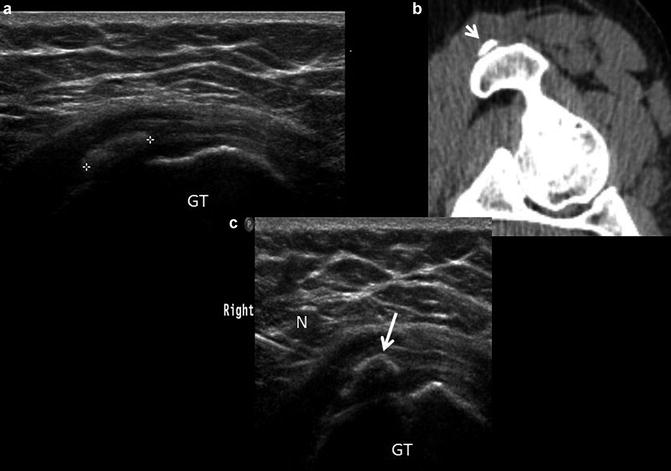

Fig. 11
Hamstring tendinosis. (a) short-axis ultrasound image of the hamstring origin (T) shows an inhomogeneous tendon with a small calcification (arrow) present along the superficial margin of the tendon. The ischium (I) is labeled. (b) Corresponding axial FSE proton density image show heterogeneous hamstring tendon origin (T), compatible with tendinosis. Small dystrophic calcifications are generally not appreciated on MR

Fig. 12
Hamstring tendinosis with tear. (a) Longitudinal ultrasound image of the proximal hamstring tendon (arrow heads) origin shows it to be expanded and heterogeneous with a intrasubtance tear (arrow), appearing as a discretely marginated hypoechoic area within the tendon substance. The ischium (I) is labeled. (b) Longitudinal power Doppler ultrasound image of the proximal hamstring tendon (arrow heads) origin. Increased vascularity (red to orange hues) on power Doppler imaging can be seen due to angiofibroblastic proliferative response

Fig. 13
Calcific tendinosis. (a) Long axis ultrasound image over the greater trochanter (GT) shows a globular echogenic area (+) within the substance of the gluteus medius tendon. The cortical echo below the echogenic focus is lost due to posterior acoustic shadowing, confirming the calcified nature of the echogenic material. (b) Computed tomography of the same hip shows the calcification (arrow) adjacent to the greater trochanter. (c) A 20 gauge spinal needle (N) has been placed into the calcification (arrow) using a short axis approach for purposes of aspiration and therapeutic injection. The greater trochanter (GT) is labeled
In contrast to muscle, the myotendinous junction appears as a compact curvilinear echogenic reflector, which may be central or along the margin of the muscle and can be traced in continuity to their respective tendons. Infiltrative processes, such as edema and hemorrhage, can result in increased muscle size and echogenicity in either a heterogeneous or uniform distribution while maintaining the fascicular architecture of the muscle, such as is seen in a grade 1 muscle strain (Figs. 7 and 14). Thickening of the epimyseal connective tissue and/or hypoechoic fluid/edema tracking along the epimysium may be present. Higher-grade injuries are associated with disruption of muscle fibers resulting in the loss of normal fascicular architecture. Localized heterogeneous or hypoechoic collections may be seen with discrete tears or as heterogeneous masses with peripheral vascularity in the case of an organizing hematoma [21–24]. Ultrasound is a sensitive technique to detect calcification/ossification in the case of developing myositis ossificans, appearing as linear echoic foci often with posterior acoustic shadowing [25].
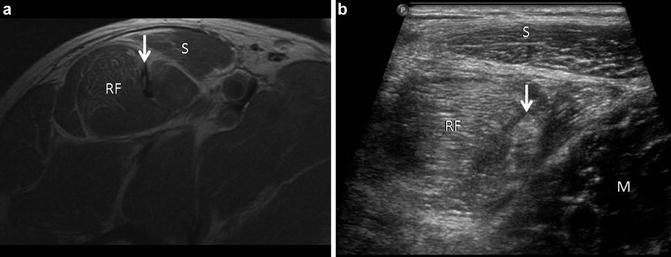

Fig. 14
Muscle edema pattern. (a) Axial FSE proton density image in a professional soccer player who sustained a strain injury to the rectus femoris (RF) and sartorious (S) muscles. Heterogeneous signal intensity is present within the tendon of the indirect head of the rectus femoris (arrow). (b) Corresponding ultrasound image shows both rectus femoris (RF) and sartorius (S) displaying increased echogenicity related to infiltrative edema and hemorrhage. Normal adjacent muscle (M) can be seen in the same image for comparison. The tendon of the indirect head (arrow) is inhomogeneous
Seromas appear as discretely marginated intra- or perimuscular anechoic/hypoechoic collections that may inhibit rehabilitation following a muscle injury (Fig. 15). Ultrasound provides a convenient method to perform percutaneous aspiration of these collections which has been postulated to help facilitate recovery [24]. Muscle atrophy can likewise present as increased muscle echogenicity but with diminished muscle volume. Differentiating atrophy and edema on ultrasound can be challenging in the setting of an acute or chronic injury. Magnetic resonance imaging provides a more sensitive assessment of muscle integrity in this setting. Dynamic assessment following muscle injury using ultrasound can be invaluable in determining the apposition of the torn muscle ends while performing provocative maneuvers [17].


Fig. 15
Muscle tear with aspiration. (a) Professional baseball player with myotendinous junction injury to indirect head of the rectus femoris. Short axis ultrasound image of the rectus femoris displays distortion of muscle morphology with patchy areas of increased echogenicity (muscle edema pattern) and eccentric discretely marginated hypoechoic collection (arrow) corresponding to a muscle tear with seroma formation. A needle (N) has been placed into the collection under ultrasound guidance for purposes of aspiration. (b) Corresponding transverse sonogram following aspiration depicting decompression of the seroma. The patient was able to return to play 24 h following therapeutic aspiration
Similarly, demonstrating muscle hernias through fascial defects may require provocative maneuvers to manifest [26]. Chronic muscle tears sometimes may become more conspicuous following or during injection therapy performed under ultrasound guidance as the injected material can decompress into the tear, taking a path of least resistance (Fig. 16). Areas of focal scarring appear as poorly marginated echogenic areas within the muscle.
