Chapter 7 The electrical skin resistance test
Following Puglisi’s introduction to the issue of electrical skin resistance (ESR) and the instruments needed to measure it in Chapter 6, we need now to examine the diagnostic possibilities offered by the electrical skin resistance test (ESRT).
ADVANTAGES AND LIMITS OF AURICULAR DIAGNOSIS WITH ESRT
The advantage of using an electronic device is essentially to be able to explore the auricle systematically without the collaboration of the patient, needed for example in PPT for identifying those points most tender at pressure. Also, a beginner can easily identify the points, mark them with ink and transcribe their location onto the Sectogram.
There are at least two further time-consuming factors which need to be borne in mind:
REASONS FOR CHOOSING AGISCOP AND ADOPTING A FIXED ESR THRESHOLD IN THE VALIDATION PROCESS
The ancestor of Agiscop was the Punctoscope, developed in the 1960s by Nogier himself on the basis of the pioneering research of Niboyet who dedicated his doctoral thesis in 1963 to the issue of the lower ESR of acupuncture points and meridians.2
To answer these questions it was necessary first to create an instrument which could measure ESR according to the basic principles of electrology aside from its clinical applications. The device developed and its characteristics have been described in Chapter 6.
We compared Agiscop with our device measuring the skin resistance of a number of points under controlled conditions (see the section on Clinical validation in Ch. 6). The results show that Agiscop has the best intra- and inter-reliability performance when the ESR threshold is about 2 MΩ, corresponding to position 3 of the above mentioned knob.
As shown in Chapter 6, the choice of 1 or 2 MΩ does not invalidate the classification of points in two categories, one with high and the other with low ESR values, since the former includes points with ESR 2 ÷ 100 MΩ and the latter includes points with ESR 0÷2 MΩ.
All patients were measured with the − polarity of the knob which corresponds to a difference of ESR due to a lower resistance of the surrounding coaxial electrode with respect to the central electrode (see Fig. A2.1). This modality was chosen because the average number of points identified with the − polarity was 2.3 times greater than the + polarity; indeed this difference allowed a higher diagnostic success of the first modality (see Table 9.3).
One of the reasons for the higher number of points identified with the (−) modality has been explained in Appendix 2 as being due to the possible indentation of the skin under the measuring probe, causing greater contact with the coaxial rather than with the central electrode (Fig. A2.4).
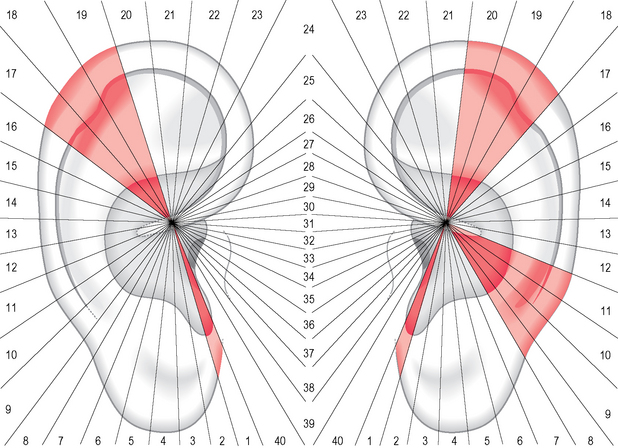
THE GENERAL DISTRIBUTION OF POINTS WITH LOWER ESR ON THE AURICLE
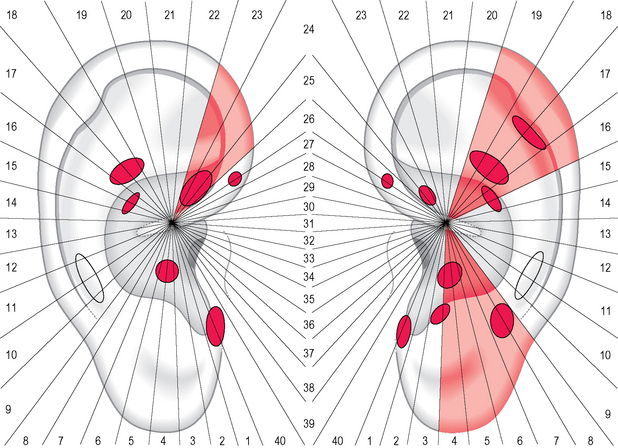
If we examine the general distribution of points with lower ESR (~1 MΩ) on the outer ear in 325 patients with the − modality, we get an average of 5.24 on the right side compared to 5.98 on the left. This non-significant difference of distribution may appear to indicate a homogeneous and symmetrical distribution of points but that is not the case. If we analyze the clusters per sector we may notice that the left ear shows a higher number of sectors of high value compared to the right (Fig. 7.1). This phenomenon, similarly to what happens with PPT (see Fig. 5.5), is not easily explainable: we have to assume that the asymmetry of distribution may be intrinsic to the ear or may be the result of an asymmetrical activation of the auricles which manifests itself physiologically in the majority of patients. Our hypothesis, also expressed in Chapter 9, is that this phenomenon could be related to the asymmetrical lateralization of some functions in our brain such as language, handedness, etc.
DIFFERENCES IN THE DIAGNOSTIC PERFORMANCES OF ESRT AND PPT
Both these methods show a similar performance on the total of symptoms (32.9% for ESRT and 34.6% for PPT) but their combination provides a better outcome (52.3%), which is significantly higher compared to either ESRT or PPT considered on its own (P<0.001). However, if we compare the success rates in the identification of the symptoms of various bodily systems, we may notice that there are some significant differences. For example, PPT shows a better outcome with musculoskeletal, teeth–temporomandibular joint (TMJ) and nervous system disorders, whereas ESRT seems to be more suitable for detecting mental and gastrointestinal problems.
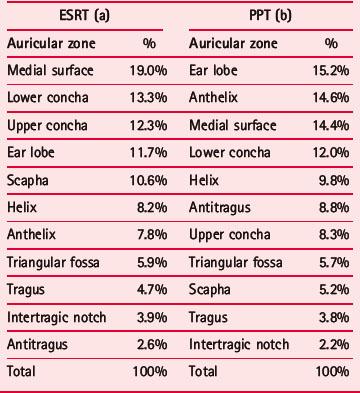
I tried to find an answer to these issues by first comparing the distribution of points identified with ESRT and PPT on the auricle. We can see that ESRT identified points principally on the medial surface, followed by the lower and upper concha, whereas PPT identified a higher percentage of points on the ear lobe followed by the anthelix and the medial surface (Table 7.1). However, in my opinion these slight differences may be related at least partially to the differing anatomical composition of the tissues on which diagnosis is performed. For example, the higher number of points detected by ESRT on the medial surface may depend on the reduced thickness of the skin covering this part of the auricle. For the concha (in total 25.6% to 20.3% of PPT) we may also suppose an anatomical factor represented by the particular density of sebaceous glands in this area. We are however not sure that the ducts of sebaceous glands may favor the electrical shunt as has been supposed for sweat glands; in effect sebum seems not to be an ion conducting material such as sweat.
Table 7.1 Concentration of identified points on the different zones of the ear in 325 patients. (a) % of points with low ESR; (b) % of tender points
As regards PPT and the higher number of tender points on the ear lobe, I have suggested in Chapter 5 that this higher sensitization may result from the lack of cartilaginous support leading the practitioner inadvertently to exert a higher pressure than intended on this zone. The higher number of tender points on the anthelix could nevertheless be associated with the bias, typical in the West, towards starting auricular exploration from this part, representing as it does the spine and other structures of the musculoskeletal system.
LOOKING FOR A SUITABLE METHODOLOGY TO COMPARE THE INTRINSIC DIAGNOSTIC SPECIFICITY OF ESRT AND PPT
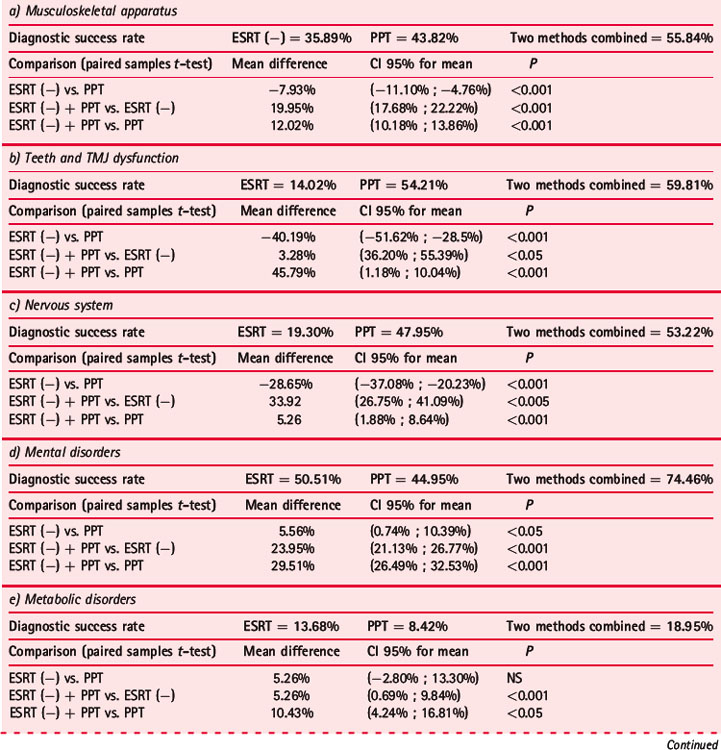
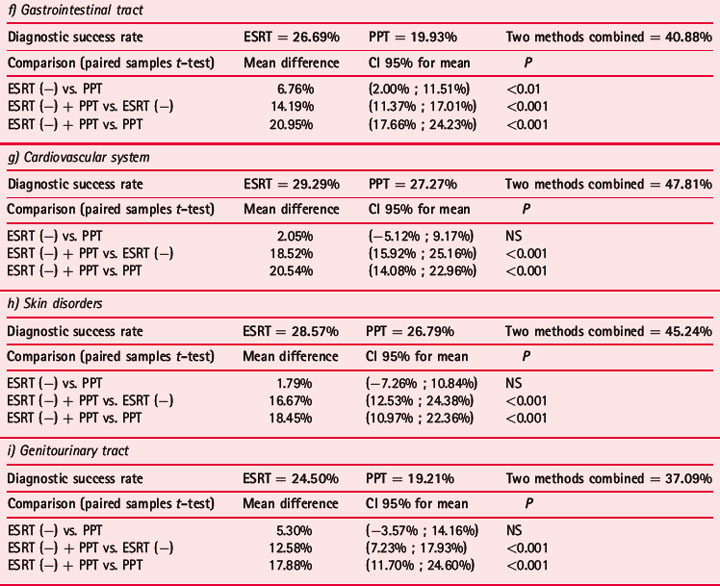
Table 7.2 compares the diagnostic abilities of ESRT and PPT in identifying symptoms of some systems and disorders:
Table 7.2 Diagnostic success rates obtained on various apparatus and disorders in 325 patients with two methods, ERST (−) and PPT, and comparison with paired samples t-test
Practitioners should, however, be aware that the clusters of points they are going to identify with both methods often represent a puzzle which can be solved only through sufficient medical knowledge.
Let us consider, for example, the case of irritable bowel syndrome (IBS).
Two randomly selected groups were chosen for the first analysis: the first was composed of 40 patients with diarrhea- or constipation-predominant discomfort; the second group consisted of 40 subjects without this disorder. Only two sectors (15 and 16, related to liver and pancreas–gallbladder) showed a significantly higher number of points with PPT in the IBS group compared to the control group, whereas for ESRT no differences were found. Much more interesting was the comparison between ESRT and PPT: the first showed a significant concentration of points with lower ESR on the colon area represented in sectors 23–25 (on the left in Fig. 7.2), whereas PPT showed a significantly higher number of tender points on sectors 16–19 and 4–8 (on the right of Fig. 7.2). The interpretation of these areas is not immediate but becomes easier when circumscribing the clusters of points located on these sectors. With regard to the first group of sectors identified with PPT, the significant sensitization comes from the sum of clusters belonging to the liver–pancreas–gallbladder area with the Chinese abdomen area (AH8 fu) and the elbow–wrist area. In trying to solve this puzzle we may be reassured by the fact that the area of the abdomen also has indications, for example, for diarrhea with abdominal distension and pain, which are typical symptoms of IBS. Also the sensitization of the elbow–wrist area, which I consider related to allergy and food intolerance, should not be considered out of place since, for example, a lactose intolerance could mimic the symptoms of IBS.
< div class='tao-gold-member'>

Stay updated, free articles. Join our Telegram channel

Full access? Get Clinical Tree


