mm (maximum 4.7 mm) with 95 % confidence interval of 1.7 mm. They also found that there was no significant difference in each of their analyzed parameters (![$$p > 0.05$$” src=”/wp-content/uploads/2016/09/A331438_1_En_10_Chapter_IEq2.gif”></SPAN>) when the phantom was placed in different orientations in the EOS machine. The reconstruction of 3D bone models allows analysis of subject-specific morphology in a weight-bearing situation for different applications to a level of accuracy which was not previously possible. For example, Lazennec et al. [<CITE><A href=]() 20] used the EOS system to measure pelvis and THA acetabular component orientations in sitting and standing positions. Further applications of EOS system in planning THA include accurate evaluation of femoral offset [21] and rotational alignment [22]. Though accurate, the EOS system at this moment is only available in a few big clinical centers and is not widely available due to the high acquisition and maintenance costs.
20] used the EOS system to measure pelvis and THA acetabular component orientations in sitting and standing positions. Further applications of EOS system in planning THA include accurate evaluation of femoral offset [21] and rotational alignment [22]. Though accurate, the EOS system at this moment is only available in a few big clinical centers and is not widely available due to the high acquisition and maintenance costs.
The situation for the post-operative measurements remains the same. 2D anteroposterior (AP) pelvic radiograph is the standard imaging means for measuring the post-operative cup position. Although it has an inferior accuracy in comparison to 3D techniques based on CT, it is used routinely because of its simplicity, availability, and minimal expense associated with its acquisition. While plain pelvic radiographs are easily obtained, their accurate interpretations are subject to substantial errors if the individual pelvic orientation with respect to the X-ray plate is not taken into consideration.
When a CT study of the patient is available at some point during treatment, CT-based 2D-3D rigid image registration methods [
23–
25] have been developed to measure the post-operative cup orientation with respect to an anatomical reference extracted from the CT images, which is a plane called the Anterior Pelvic Plane (APP) defined by the Anterior Superior Iliac Spines (ASIS) and the pubic tubercles. In such methods, a rigid transformation between the CT data coordinate system and the X-ray image coordinate system is estimated first by performing an intensity-based rigid 2D-3D registration, which then allows for computing the orientation of the acetabular cup with respect to the APP extracted from the CT images. While accurate, the extensive usage of CT-based 2D-3D image registration methods in clinical routine is still limited. This may be explained by their requirement of having a CT study of the patient at some point during treatment, which is usually not available for vast majority of THA procedures performed nowadays.
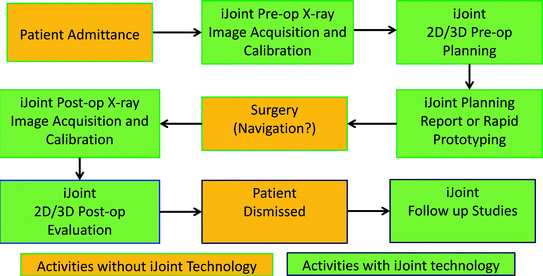
By using X-ray radiographs that will be acquired from a conventional X-ray machine, which is usually available in all types of clinics, we are aiming to provide a personalized X-ray reconstruction-based planning and post-operative treatment evaluation framework called iJoint for advancing modern THA (see Fig.
1 for an overview of how the iJoint framework works). Based on a mobile X-ray image calibration phantom and a unique 2D-3D reconstruction technique, iJoint can generate patient-specific models of hip joint by non-rigidly matching statistical shape models (SSMs) to the X-ray radiographs. Such a reconstruction enables a true 3D planning and treatment evaluation of hip arthroplasty from just 2D X-ray radiographs whose acquisition is part of the standard diagnostic and treatment loop. As part of the system, a 3D model-based planning environment provides surgeons with hip arthroplasty related parameters such as implant type, size, position, offset and leg length equalization. With this newly developed system, we are able to provide true 3D solutions for computer assisted planning of THA using only 2D X-ray radiographs, which is not only innovative but also cost-effective.
The chapter is organized as follows. In Sect.
2, we will present details about the calibration technique, followed by the description of statistical shape model construction in Sect.
3. Section
4 will give details on our hierarchical 2D-3D reconstruction techniques. Its applications for planning THA will be presented in Sect.
5. We will then present experimental design and preliminary results in Sect.
6, followed by discussions and conclusions in Sect.
7.
2 X-ray Image Calibration
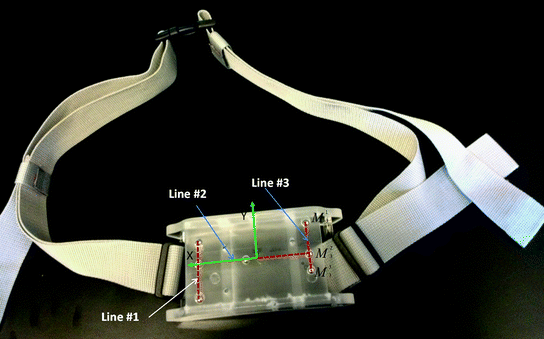
The aim of the X-ray image calibration is to compute both the intrinsic and the extrinsic parameters of an acquired image. This is achieved by developing a mobile phantom as shown in Fig.
2 [
26]. There are totally 16 sphere-shaped fiducials embedded in this phantom: 7 big fiducials with diameter of 8.0 mm and 9 small fiducials with diameter of 5.0 mm. The 16 fiducials are arranged in three different planes: all 7 big fiducials placed in one plane and the rest 9 small fiducials distributed in other two planes. Furthermore, the 7 big fiducials are arranged to form three line patterns as shown in Fig.
2, left. Every line pattern consists of three fiducials

with different ratios

. The exact ratio for each line is used below to identify which line pattern has been successfully detected.
After an X-ray image is acquired, we first extract the sub-region containing the phantom projection. We then apply a sequence of image processing operations to the image. As those fiducials are made from steel, a simple threshold-based method is first used to segment the image. Connected-component labeling is then applied to the binary image to extract a set of separated regions. Morphology analysis is further applied to each label connected-component to extract two types of regions: candidate regions from big fiducial projections and candidate regions from small fiducial projections. The centers of these candidate regions are regarded as projections of the center of a potential fiducial. Due to background clutter, it is feasible that some of the candidate projections are outliers and that we may miss some of the true fiducial projections. Furthermore, to calculate both the intrinsic and the extrinsic parameters, we have to detect the phantom from the image. Here phantom detection means to establish the correspondences between the detected 2D fiducial projection centers and their associated 3D coordinates in the local coordinate system of the phantom. For this purpose, a robust simulation-based method as follows is proposed. The pre-condition to use this method to build the correspondences is that one of the three line patterns has been successfully detected. Due to the fact that these line patterns are defined by big fiducials, chance to missing all three line patterns is rare.
We model the X-ray projection using a pin-hole camera.
where

is the scaling factor,
K is the intrinsic calibration matrix,
R and
T are the extrinsic rotation matrix and translational vector, respectively. Both the intrinsic and the extrinsic projection parameters can be combined into a 3-by-4 projection matrix
P in the local coordinate system established on the mobile phantom.
The idea behind the simulation-based method is to do a pre-calibration to compute both the intrinsic matrix
K as well as the extrinsic parameters
R 0 and
T 0 of the X-ray image acquired in a reference position. Then, assuming that the intrinsic matrix
K is not changed from one image to another (we only use this assumption for building the correspondences), the projection of an X-ray image acquired at any other position with respect to the phantom can be expressed as
where
R x ,
R y ,
R z and
T are the rotation matrices around three axes (assuming the z-axis is in parallel with the view direction of the calibration phantom at the reference position, see the middle column of Fig.
3 for details) and the translation vector from an arbitrary acquisition position to the reference position, respectively, expressed in the local coordinate of the mobile phantom. To detect the phantom projection when an image is acquired in a new position, the simulation-based method consists of two steps.
As soon as the correspondences are established, we can further fine-tune the fiducial projection location by applying a cross-correlation based template matching. After that, the direct linear transformation algorithm [
27] is used to compute the projection matrix
P.
For the 2D-3D reconstruction algorithm that will be described below, we need at least two X-ray images acquired from different orientations with respect to the underlying anatomy. In order to achieve an accurate reconstruction, it is important to maintain a fixed positioning relationship between the calibration phantom and the underlying anatomy. For this, we have developed a belt-based fixation system as shown in Fig.
2 to rigidly fix the calibration phantom to a patient.
3 Construction of Statistical Shape Models
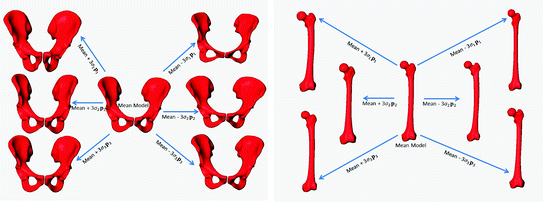
The Point Distribution Model (PDM) [
28] was chosen as the representation of the SSMs of both the pelvis and femur. The pelvic PDM used in this study was constructed from a training database of 114 segmented binary volumes with an equally distributed gender (57 male and 57 female) where the sacrum was removed from each dataset. After one of the binary volumes was chosen as the reference, diffeomorphic Demon’s algorithm [
29] was used to estimate the dense deformation fields between the reference binary volume and the other 113 binary volumes. Each estimated deformation field was then used to displace the positions of the vertices on the reference surface model, which was constructed from the reference binary volume, to the associated target volume, resulting in 114 surface models with established correspondences.
Following the alignment, the pelvic PDM was constructed as follows. Let

be
m members in the aligned training population. Each member is described by a vector
X i containing
N vertices:
20] used the EOS system to measure pelvis and THA acetabular component orientations in sitting and standing positions. Further applications of EOS system in planning THA include accurate evaluation of femoral offset [21] and rotational alignment [22]. Though accurate, the EOS system at this moment is only available in a few big clinical centers and is not widely available due to the high acquisition and maintenance costs.

 with different ratios
  . The exact ratio for each line is used below to identify which line pattern has been successfully detected.
![$$\alpha [I_{x} ,I_{y} ,1]^{T} = {\mathbf{K}}({\mathbf{R}}[x,y,z]^{T} + {\mathbf{T}}) = {\mathbf{P}}[x,y,z,1]^{T}$$](/wp-content/uploads/2016/09/A331438_1_En_10_Chapter_Equ1.gif)
 is the scaling factor, K is the intrinsic calibration matrix, R and T are the extrinsic rotation matrix and translational vector, respectively. Both the intrinsic and the extrinsic projection parameters can be combined into a 3-by-4 projection matrix P in the local coordinate system established on the mobile phantom.
![$$\alpha [I_{x} ,I_{y} ,1]^{T} = {\mathbf{K}}({\mathbf{R}}_{0} ({\mathbf{R}}^{x} {\mathbf{R}}^{y} {\mathbf{R}}^{z} [x,y,z]^{T} + {\mathbf{T}}) + {\mathbf{T}}_{0} )$$](/wp-content/uploads/2016/09/A331438_1_En_10_Chapter_Equ2.gif)

 , and T on the phantom detection by normalizing the image acquired at the new position as follows. Assuming that we know the correspondences of fiducials on one line pattern, which is defined by 3 landmarks M 1, M 2, M 3 with their correspondent projections at IM 1, IM 2, IM 3, we can define a 2D coordinate system based on IM 1, IM 2, IM 3, whose origin O is located at
  and the x-axis is defined along the direction
  . Accordingly a 2D affine transformation T normalize can be computed to transform this line pattern based coordinate system to a standard 2D coordinate system with its origin at (0, 0) and x-axis along direction (1, 0) and at the same time to normalize the length of the vector
  to 1. By applying T normalize to all the fiducial projections, it can be observed that for a pair of fixed R x and R y , we can get the same normalized image no matter how the other parameters R z ,
  , and T are changed because the influence of these parameters is just to translate, rotate, and scale the fiducial projections, which can be compensated by the normalization operation. Therefore, the fiducial projections after the normalization will only depend on the rotational matrices R x and R y .
 ) contains all the normalized fiducial projections with different combination of R x and R y . This is done off-line by simulating the projection operation using Eq. (1) based on the pre-calibrated projection model of the X-ray machine at the reference position. For an image acquired at position other than the reference, we apply the normalization operation as described above to all the detected candidate fiducial projections. The normalized candidate fiducial projections are then compared to those in the look-up table to find the best match. Since the items in the look-up table are generated by a simulation procedure, we know exactly the correspondence between the 2D fiducial projections and their corresponding 3D coordinates. Therefore, we can establish the correspondences between the candidate fiducial projections and the fiducials embedded in the phantom.
 be m members in the aligned training population. Each member is described by a vector X i containing N vertices:


