Fig. 2.1
Setup for isokinetic testing of quadriceps and hamstrings strength
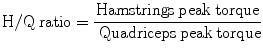
When assessing quadriceps and hamstrings strength in athletes, several outcome measures may be of interest. The most common measure of strength garnered from an isokinetic dynamometer is peak torque, a measure of the peak muscle force exerted during the test. Given the significant correlation between body weight and muscle strength [4–6], peak torque is often normalized to body weight. However, this normalization has been argued to overcorrect the effect of mass [6], and alternative normalization methods have been suggested [7]. Using non-normalized data can result in a high variability when comparing subjects with a wide range of body sizes, but should be appropriate for within-subjects comparisons, for instance to track an individual’s knee strength over time.
In addition to peak torque values, ratios of peak torque are often calculated. These ratios provide important information about the relative strength of different muscle groups, or muscle imbalances, and thereby facilitate comparisons between subjects without the need for normalization. One such measure is the hamstrings-to-quadriceps ratio (H/Q ratio), calculated as the peak torque of the hamstrings divided by the peak torque of the quadriceps within the same limb (Eq. (2.1)):
(2.1)
As stated before, isokinetic peak torque is often assessed using concentric contractions. As hamstrings and quadriceps muscles are antagonists to one another, simultaneous concentric contraction of both these muscles does not occur. Therefore, it may be preferred to examine eccentric hamstrings peak torque with respect to the concentric quadriceps peak torque, when assessing functional strength. This combination of eccentric hamstrings and concentric quadriceps strength is representative for the take-off phase of a jump: the quadriceps muscles contract and the shortening muscle fibers extend the knee, while a simultaneous eccentric (lengthening) contraction of the hamstrings is required to decelerate the explosive knee extension, in order to prevent hyperextension and resulting damage to the knee joint. A reduced H/Q ratio, which may be indicative of “quadriceps dominance,” may put athletes at a higher risk for lower extremity injury [8].
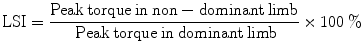
Another ratio is calculated to compare peak torque between limbs and is referred to as the limb symmetry index (LSI). LSI is used to assess peak torque in the non-dominant relative to the dominant limb (Eq. (2.2)):
(2.2)
Greater than 15 % difference between limbs is often considered a substantial asymmetry in healthy athletes and may put them at increased risk of injury [8]. Interestingly, such asymmetries are not uncommon in first-year professional American football players [6]. In injured subjects, LSI of the injured versus the unaffected limb can help to guide rehabilitation programs aimed at restoring symmetry between involved and uninvolved sides. LSIs of an injured population also provides further information when deciding whether athletes are ready to return to sport after recovering from an injury. An LSI of >90 % in injured athletes is typically recommended as a cutoff point when making return to sport decisions [9, 10]. Patients with this level of symmetry after rehabilitation following surgical reconstruction of their anterior cruciate ligament (ACL) demonstrated similar functional performance as healthy control subjects, while larger asymmetries were associated with reduced functional outcomes [11].
In addition to peak torque values and ratios of peak torque between muscle groups and limbs, several other outcome measures can provide further insight into muscle function. Table 2.1 provides an overview of some commonly used variables [12]. Additional electrical stimulation of the muscles or nerves during maximal voluntary contractions can reveal the discrepancy between voluntary and “true” maximal muscle strength.
Outcome measure | Interpretation |
|---|---|
Time to peak torque | Time from the start of a muscular contraction to the moment of peak torque development; indicative of the ability to produce force quickly |
Angle of peak torque | The point in the range of motion where peak torque is produced; typically in the midrange, where the length–tension relationship of the muscle is optimal |
Total work | Muscular force output over the entire test. This may be a better indicator of muscle function, as torque must be maintained over the range of motion |
Work fatigue | Difference between the first 1/3 and the last 1/3 of work in a test bout; indicative of fatigue development throughout the test |
Average power | Total work divided by time; represents how quickly a muscle can generate force |
Coefficient of variance | Reproducibility of the test based on the amount of variation between repetitions. Acceptance levels are typically ≤15 % for larger muscle groups and ≤20 % for smaller muscle groups |
Normative Data
When evaluating strength, normative values provide a range of normal strength values for a population that can be used to compare collected data. Tables 2.2, 2.3, 2.4, and 2.5 provide means and standard deviations of quadriceps and hamstrings strength measures for active individuals with and without ACL injuries, athletes who return to sport following surgical ACL reconstruction, and NCAA Division I football athletes. Reported normative values are peak torque and H/Q ratios at 60°/s and 300°/s.
Table 2.2
Isokinetic quadriceps and hamstrings strength measures at 60°/s for healthy subjects
Healthy active females (n = 8) | Healthy active males (n = 6) | Freshmen varsity football (n = 22) | ||
|---|---|---|---|---|
Age | 18.4 ± 4.6 | 23.7 ± 11.2 | 18.0 ± 0.7 | |
HQ-ratio | Dominant | 0.50 ± 0.05 | 0.55 ± 0.07 | 0.55 ± 0.07 |
Non-dominant | 0.49 ± 0.04 | 0.48 ± 0.08 | 0.52 ± 0.11 | |
Peak torque (Nm) | ||||
Quadriceps | Dominant | 155.1 ± 19.7 | 233.2 ± 54.6 | 280.2 ± 54.8 |
Non-dominant | 153.6 ± 25.8 | 244.6 ± 50.2 | 277.0 ± 45.5 | |
Hamstrings | Dominant | 76.9 ± 8.9 | 127.8 ± 30.0 | 151.5 ± 28.6 |
Non-dominant | 74.7 ± 9.7 | 118.3 ± 38.9 | 142.7 ± 28.8 | |
Peak torque normalized to body mass (Nm/kg) | ||||
Quadriceps | Dominant | 2.38 ± 0.17 | 2.47 ± 0.45 | 2.77 ± 0.46 |
Non-dominant | 2.37 ± 0.43 | 2.61 ± 0.56 | 2.75 ± 0.43 | |
Hamstrings | Dominant | 1.19 ± 0.15 | 1.36 ± 0.31 | 1.49 ± 0.23 |
Non-dominant | 1.15 ± 0.14 | 1.24 ± 0.27 | 1.41 ± 0.26 | |
Table 2.3
Isokinetic quadriceps and hamstrings strength measures at 300°/s for healthy subjects
Healthy active females (n = 8) | Healthy active males (n = 6) | Freshmen varsity football (n = 38) | ||
|---|---|---|---|---|
Age | 18.4 ± 4.6 | 23.7 ± 11.2 | 18.0 ± 0.6 | |
HQ-ratio | Dominant | 0.67 ± 0.05 | 0.63 ± 0.07 | 0.67 ± 0.10 |
Non-dominant | 0.65 ± 0.08 | 0.68 ± 0.08 | 0.67 ± 0.11 | |
Peak torque (Nm) | ||||
Quadriceps | Dominant | 81.6 ± 8.2 | 146.7 ± 27.8 | 178.9 ± 30.9 |
Non-dominant | 83.6 ± 7.5 | 137.9 ± 34.3 | 178.7 ± 37.7 | |
Hamstrings | Dominant | 54.0 ± 3.2 | 92.2 ± 20.2 | 118.0 ± 22.1 |
Non-dominant | 54.3 ± 7.9 | 92.9 ± 20.2 | 117.6 ± 21.6 | |
Peak torque normalized to body mass (Nm/kg) | ||||
Quadriceps | Dominant | 1.25 ± 0.09 | 1.57 ± 0.34 | 1.76 ± 0.34 |
Non-dominant | 1.29 ± 0.18 | 1.49 ± 0.49 | 1.75 ± 0.37 | |
Hamstrings | Dominant | 0.83 ± 0.08 | 0.98 ± 0.22 | 1.17 ± 0.30 |
Non-dominant | 0.83 ± 0.09 | 1.00 ± 0.25 | 1.16 ± 0.28 | |
Table 2.4
Isokinetic quadriceps and hamstrings strength measures at 60°/s for subjects who suffered an ACL injury
Before surgical reconstruction | Cleared to return to sport after surgical reconstruction | ||||
|---|---|---|---|---|---|
Females (n = 10) | Males (n = 20) | Females (n = 13) | Males (n = 22) | ||
Age | 21.6 ± 10.0 | 22.7 ± 8.9 | 17.7 ± 5.5 | 21.8 ± 7.4 | |
HQ-ratio | Uninvolved | 0.55 ± 0.12 | 0.49 ± 0.07 | 0.48 ± 0.07 | 0.51 ± 0.07 |
Involved | 0.56 ± 0.10 | 0.49 ± 0.13 | 0.50 ± 0.08 | 0.48 ± 0.10 | |
Peak torque (Nm) | |||||
Quadriceps | Uninvolved | 140.8 ± 42.5 | 214.0 ± 31.8 | 153.5 ± 27.1 | 233.7 ± 50.1 |
Involved | 94.1 ± 43.0 | 159.0 ± 39.8 | 127.8 ± 18.9 | 213.7 ± 48.6 | |
Hamstrings | Uninvolved | 76.0 ± 24.8 | 105.3 ± 20.7 | 73.9 ± 13.7 | 117.6 ± 26.1 |
Involved | 51.0 ± 21.0 | 75.9 ± 23.0 | 63.3 ± 14.1 | 100.0 ± 22.8 | |
Peak torque normalized to body mass (Nm/kg) | |||||
Quadriceps | Uninvolved | 2.13 ± 0.68 | 2.63 ± 0.57 | 2.40 ± 0.41 | 2.77 ± 0.47 |
Involved | 1.49 ± 0.83 | 1.95 ± 0.57 | 2.02 ± 0.38 | 2.53 ± 0.50 | |
Hamstrings | Uninvolved | 1.16 ± 0.45 | 1.30 ± 0.32 | 1.15 ± 0.16 | 1.40 ± 0.30 |
Involved | 0.80 ± 0.41 | 0.92 ± 0.29 | 1.00 ± 0.24 | 1.19 ± 0.24 | |
Table 2.5
Isokinetic quadriceps and hamstrings strength measures at 300°/s for subjects who suffered an ACL injury
Before surgical reconstruction | Cleared to return to sport after surgical reconstruction | ||||
|---|---|---|---|---|---|
Females (n = 10) | Males (n = 20) | Females (n = 13) | Males (n = 22) | ||
Age | 21.6 ± 10.0 | 22.7 ± 8.9 | 17.7 ± 5.5 | 21.8 ± 7.4 | |
HQ-ratio | Uninvolved | 0.70 ± 0.12 | 0.67 ± 0.10 | 0.65 ± 0.08 | 0.65 ± 0.10 |
Involved | 0.76 ± 0.06 | 0.69 ± 0.13 | 0.67 ± 0.09 | 0.68 ± 0.17 | |
Peak torque (Nm) | |||||
Quadriceps | Uninvolved | 81.6 ± 21.3 | 122.2 ± 20.9 | 84.5 ± 13.4 | 139.6 ± 24.2 |
Involved | 62.6 ± 24.9 | 100.6 ± 21.1 | 77.7 ± 9.3 | 131.3 ± 25.8 | |
Hamstrings | Uninvolved | 56.4 ± 17.0 | 80.7 ± 13.5 | 56.4 ± 7.9 | 90.3 ± 19.4 |
Involved | 48.2 ± 18.6 | 68.1 ± 12.9 | 53.7 ± 8.0 | 87.5 ± 21.7 | |
Peak torque normalized to body mass (Nm/kg) | |||||
Quadriceps | Uninvolved | 1.24 ± 0.39 | 1.50 ± 0.33 | 1.32 ± 0.15 | 1.66 ± 0.27 |
Involved | 0.97 ± 0.47 | 1.23 ± 0.31 | 1.22 ± 0.18 | 1.57 ± 0.34 | |
Hamstrings | Uninvolved | 0.87 ± 0.34 | 0.99 ± 0.23 | 0.87 ± 0.07 | 1.07 ± 0.17 |
Involved | 0.73 ± 0.36 | 0.84 ± 0.18 | 0.83 ± 0.09 | 1.05 ± 0.29 | |
As can be appreciated in these tables, peak torque for both quadriceps and hamstrings was lower when tested at a higher speed, while H/Q ratios tended to be higher when tested at a higher speed. This supports previous findings in an extensive review [13], and may be explained by the increased forward momentum of the tibia at higher angular velocities, which requires increased co-activation of the hamstrings muscles to prevent anterior translation of the tibia and hyperextension of the knee joint [14]. While some subjects showed substantial side-to-side asymmetries, the LSI is small when averaged over a group of healthy athletes. As LSIs higher or lower than 100 % are both commonly observed, a group average tends to mask the range of individual asymmetries.
Related posts:

Stay updated, free articles. Join our Telegram channel

Full access? Get Clinical Tree


