Fig. 1
3D volume-rendered reformation of the dome and proximal femur with rotation axis in the coronal plane obtained from the VIBE sequence
Table 1
Hip MRI sequences and parameters
Sequence | FOV | Matrix | ST/G | TR | TE | NEX | BW | TF |
|---|---|---|---|---|---|---|---|---|
COR T1 | 18 × 18 | 320 × 224 | 3.5/0 | 600 | 10 | 2 | 200 | 3 |
OBL AX FS PD | 18 × 18 | 512 × 384 | 3.5/0 | 3,600 | 32 | 2 | 200 | 8–10 |
COR FS PD | 18 × 18 | 512 × 358 | 3.5/0 | 3,600 | 32 | 2 | 200 | 8–10 |
SAG FS PD | 18 × 18 | 512 × 384 | 3.5/0 | 3,600 | 32 | 2 | 200 | 8–10 |
SAG VIBE | 18 × 18 | 256 × 256 | 0.7/0 | 12.3 | 4.92 | 1 | 150 | – |
AX HASTE | 38 × 38 | 320 × 240 | 5/1 | 800 | 85 | 1 | 601 | – |
While high-resolution imaging is certainly preferred in the evaluation of the central compartment, patients may be imaged in a more limited fashion. Thus, scattered throughout the chapter, images will detail how pathology can be detected without the use of high-resolution imaging. Additionally, central compartment pathology will be shown with and without the use of intra-articular gadolinium.
When referencing the signal characteristics of structures, they will be in reference to normal muscle signal, whether there is fat suppression or not. Thus, something referred to as low signal means that it is lower in signal than normal muscle. Something referred to as intermediate signal has the same signal as muscle. And something that is high in signal is higher in signal than normal muscle.
Locations around joint will be referenced to the clockface, whether the right or left hip: 3 o’clock is directly anterior; 12 o’clock is superior; 9 o’clock is posterior; 6 o’clock is directly caudal/distal.
While not a part of the hip, the end of the chapter will discuss imaging of hamstring tendon pathology, athletic pubalgia, and ischiofemoral impingement given the propensity of these conditions to mimic and/or coexist with hip pathology.
FAI Hip Pathomorphology
Cam femoral acetabular impingement (FAI) morphology is visualized well with MRI. The presence of a cystic or multicystic intraosseous ganglion, or focal fibrocystic change, is frequently seen on MRI at the site of head-neck asphericity. Oblique axial images, obtained parallel to the long axis of the femoral neck, have traditionally been obtained to evaluate proximal femur pathomorphology. The asphericity of the head-neck junction in cam FAI is quantified with the alpha angle, as can be done with radiographs or computed tomography (CT). A best-fit circle is obtained of the femoral head, and a line bisecting the neck is extended to the center of the circle; the angle formed between this line and the point where the aspherical head-neck junction departs from the circle is the alpha angle [5]. An abnormal alpha angle, signifying pathomorphology, is defined by various authors as greater than 42–60°, although angles greater than 65–74° were found in patients with anterior impingement in two case–control studies [6–10]. Of note, the oblique axial images may be obtained incorrectly due to failure by the MRI technologist to obtain them parallel to the femoral neck (Fig. 2).
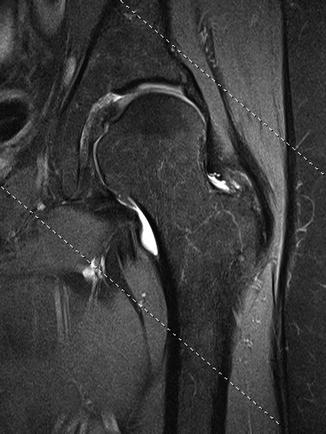
Fig. 2
Fat-suppressed coronal proton density-weighted image shows dashed lines, reflecting orientation of the oblique axial images, not paralleling the long axis of the neck
The intraobserver agreement of the alpha angle on MRI has been questioned [11]. Additionally, as the asphericity is typically anterosuperior in location, the angle obtained with the use of oblique axial images has been questioned as these images best quantify the asphericity at the direct anterior location (i.e., 3 o’clock). The use of radial imaging has been found to be more accurate in the assessment of the asphericity [12]. The use of both oblique axial and radial images may be moot if 3D reformats with volume rendering are performed for presurgical planning.
Pincer FAI morphology is usually better evaluated with radiographs than MRI. The lateral center-edge angle and Tönnis index are accurately evaluated with MRI; the anterior center-edge angle, however, is not [13]. The assessment of acetabular retroversion can be made with true axial images; the anterior wall will project lateral to the posterior wall on these images. Far cranial retroversion requires evaluating the last image or two on which the central compartment is visualized.
The Central Compartment
The Labrum
Before beginning discussion of the labrum, although widely known, it should be emphasized that labral pathology has a high prevalence in the asymptomatic population and is frequently seen on imaging done for reasons other than hip pain. For example, in an MRI study of 45 patients without hip pain, Register and colleagues found that 69 % of hips had labral tears [2].
Many studies have been performed evaluating the accuracy of detecting labral tears using MRI with and without contrast (gadolinium). The majority of studies have been performed with the use of joint distention with arthrography. One study examined the detection of tears with the use of intravenous gadolinium [14]. The sensitivities and specificities in tear detection with MR arthrography (MRA) range from 69–100 % and 0–100 %, respectively [15]. The sensitivities and specificities in tear detection with conventional MRI range from 0–97 % to 33–100 %, respectively [15]. The wide range of the sensitivity and specificity for both reflect a great heterogeneity of the studies, particularly the fewer conventional MRI studies. It is difficult to draw a definite conclusion as to whether MR arthrography (MRA) or conventional MRI in the evaluation of labral tears.
On MRI, the normal labrum is homogeneously low in signal. With aging, intrasubstance degeneration is common, manifested as intermediate to even high signal contained within the labrum. A triangular shape in all quadrants is far and away the most common shape. It occasionally thin and elongated and not infrequently somewhat rounded in shape with aging. Intralabral ossification is frequently seen, often reflecting pincer FAI (Fig. 3).
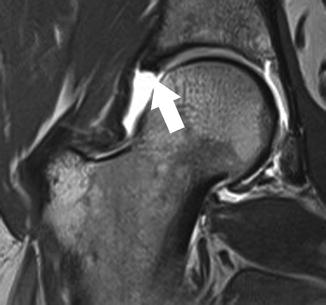
Fig. 3
Coronal T1-weighted post-arthrogram image shows subtotal ossification of the posterosuperior labrum with only a tiny residual degenerated fibrocartilaginous remnant (arrow)
There has been one grading scheme proposed using MRI and one using arthroscopy [16, 17]. A study directly comparing the schema found no significant correlation between the two [18]. Different descriptive terms have been and are currently used to describe tears. It is most important for the radiologist and referring surgeon to use the same terminology.
On MRI, labral tears may be intermediate in signal. More often, tears are high in signal, similar to joint fluid (on both conventional MRI and MR arthrography (MRA)). Peripheral detachments (i.e., peripheral longitudinal tears) are seen when linear fluid or contrast insinuates between the labrum and rim at the chondrolabral junction (Fig. 4). Radial (or flap) tears are present when fluid or contrast extends into the substance of the joint side of the labrum, entering discretely away from the chondrolabral junction (Fig. 5). Sometimes multiple small radial tears are present, also called a radial fibrillated tear (Fig. 6). A complex tear is the preferred term when signal is branching and extending in multiple directions or multiple tear types coexist (Fig. 7). Occasionally, bucket-handle tears can be seen with frank displacement of a portion of the labrum (Fig. 8). Abnormal shape, particularly blunting, of the labrum is often a clue to a displaced flap. While the assessment of tear stability is very difficult on MRI without frank labral displacement, instability can be suggested if the labrum is thickened and distorted [18].
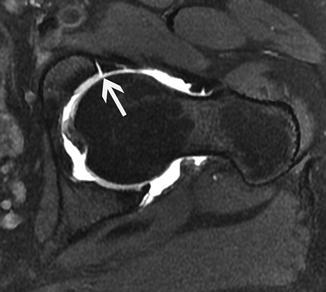
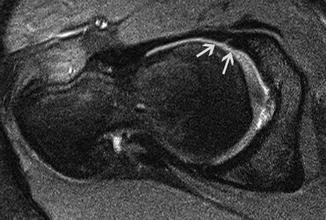
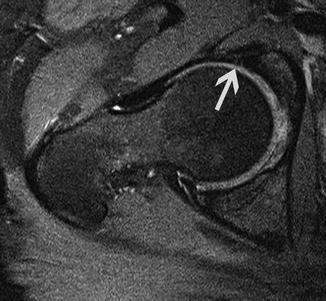
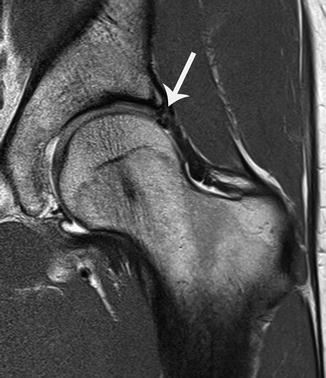
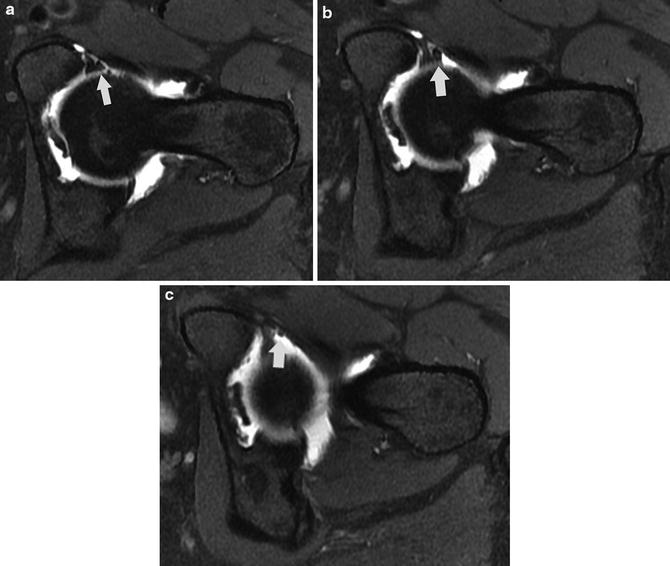
Fig. 4
Fat-suppressed oblique axial T1-weighted post-arthrogram image shows full-thickness linear fluid extension at the anterior chondrolabral junction (arrow)
Fig. 5
Fat-suppressed oblique axial proton density-weighted image shows linear high signal separating the anterior labrum roughly in halves (arrows), a radial tear
Fig. 6
Fat-suppressed oblique axial proton density-weighted image shows two small linear foci of slightly high signal entering the anterior labrum from the joint side (arrow), a radial fibrillated tear
Fig. 7
Coronal T1-weighted post-arthrogram image shows multiple tear configurations (arrow), reflecting a complex tear
Fig. 8
(a–c) Sequential post-arthrogram fat-suppressed oblique axial T1-weighted images show a flap (arrows) emanating from the torn anteroinferior labrum
Normal labral sulci, simulating peripheral detachments, are potential pitfalls on MRI. Sulci are normal variant clefts at the chondrolabral junction. They can be located at one position on the clockface (e.g., 8 o’clock) or extend over several positions (e.g., 8–9 o’clock). On MRI, they are well-defined linear areas of high signal located at the chondrolabral junction (Figs. 9 and 10). Importantly, they are partial-thickness clefts, distinguishing them from full-thickness peripheral detachments. There is no extension of the signal into the adjacent substance of the labrum. The adjacent labrum is usually normal in signal.
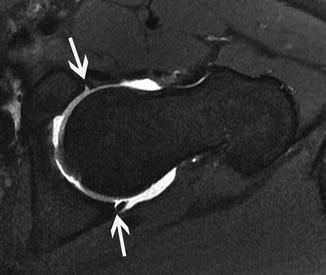
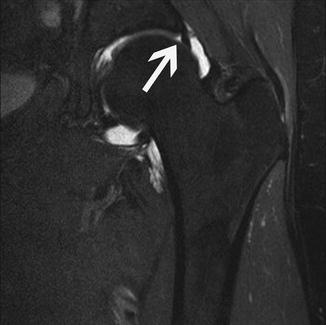
Fig. 9
Fat-saturated oblique axial T1-weighted post-arthrogram image shows partial-thickness linear high signal at the anteroinferior and posteroinferior chondrolabral junctions (arrows), representing normal sulci
Fig. 10
Fat-saturated coronal T1-weighted image shows a fluid-filled cleft at the posterosuperior chondrolabral junction (arrow), representing a sulcus
Several studies have found very conflicting results as to the frequency of sulci at all different locations [19–22]. In the author’s experience, sulci are frequent in all quadrants (particularly around 8 o’clock and 11 o’clock) except for anterosuperiorly. Given the majority of these studies have found normal sulci in the anterosuperior quadrant, it would be impossible to distinguish a focal partial-thickness peripheral detachment from a sulcus in this location. Fortunately, for MRI diagnosis, tears most often extend over multiple hours on the clockface in this quadrant (Fig. 11). Additionally, isolated tears in quadrants other than the anterosuperior quadrant are infrequent.
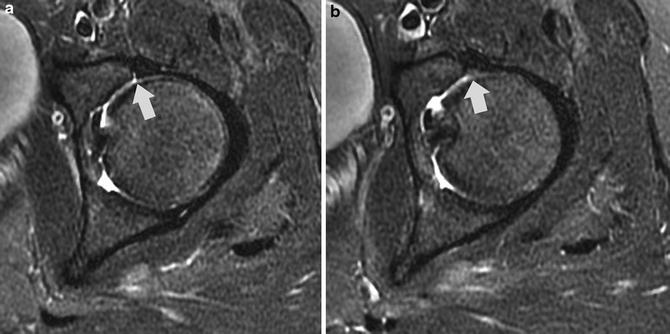
Fig. 11
Adjacent fat-suppressed axial T2-weighted images show linear partial-thickness fluid at the chondrolabral junction at 3 o’clock (arrow in a). If the adjacent labrum was normal, this could be a partial-thickness peripheral detachment or a normal sulcus. However, on the next most superior image at 2 o’clock, there are abnormal signal and shape of the labrum (arrow in b). Thus, the findings are consistent with tear
The suitability for tear repair or even refixation can be assessed by noting the underlying quality of the labrum. As mentioned previously, the normal labrum is homogeneously low in signal. A degenerated labrum is usually diffusely intermediate to slightly high in signal. Occasionally, a frank round fluid signal focus can be seen in the labral substance, consistent with focal mucoid/myxoid degeneration.
A paralabral cyst is pathognomonic for a labral tear, often seen in the setting of underlying extensive labral degeneration (Fig. 12). The vast majority of the cysts have the same signal intensity as the joint fluid. On occasion, they may have different signal than joint fluid, likely due to mucinous or proteinaceous contents. They are well circumscribed and may be multilobulated or multiseptated. While usually small, they may be large and elongated. Even rarer, large paralabral cysts have the potential to impinge on adjacent neurovascular structures. A connection/communication of these cysts with the labrum should be seen on MRI; the communication may be very small and only definitively visualized on one image of the entire exam. Nonvisualization of a discrete communication should raise the possibility of a cystic mass.
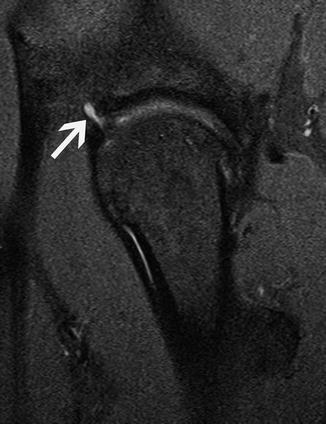
Fig. 12
Fat-suppressed sagittal proton density-weighted image shows a small well-circumscribed, homogeneous fluid collection, a paralabral cyst (arrow), communicating with an anterosuperior labral tear
In using MRI for labral tear detection, it is useful to recognize the strengths and limitations for the standard imaging planes used in the evaluation. Coronal images are best to evaluate the superior labrum. Oblique axial images are best to evaluate the anterior and posterior labrum. Sagittal images are best to evaluate the anterior labrum around the 3 o’clock position. However, not infrequently anterior tears can be seen, occasionally to better advantage, on the coronal images (Fig. 13). Additionally, superior tears can be seen on the oblique axial images. Due to the obliquity of the dome, the labrum is more difficult to evaluate accurately anterosuperiorly (particularly around 1 o’clock) and posterosuperiorly (particularly around 11 o’clock) in all standard imaging planes; the labrum is not crisply visualized due to the curvature and volume averaging in these locations. Given this relative limitation, as the vast majority of tears are located in the anterosuperior quadrant, particular scrutiny of all imaging planes should be made of this quadrant. Labral tears, including those in the anterosuperior quadrant, can be seen on low-resolution and/or large field of imaging studies (Figs. 14, 15, and 16).
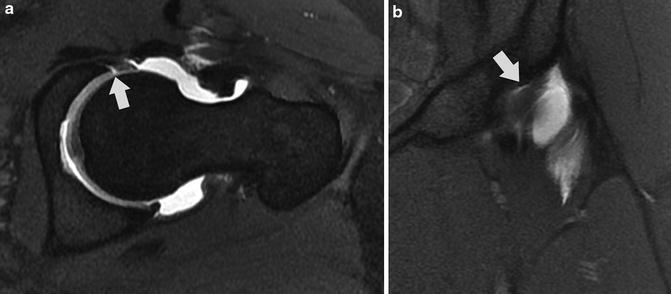
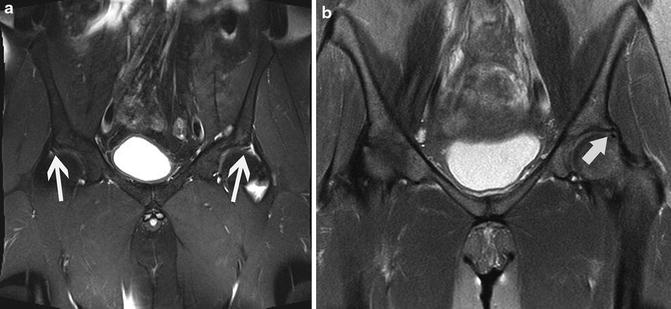
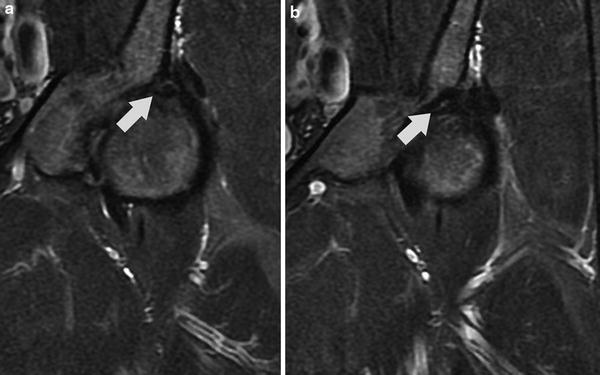
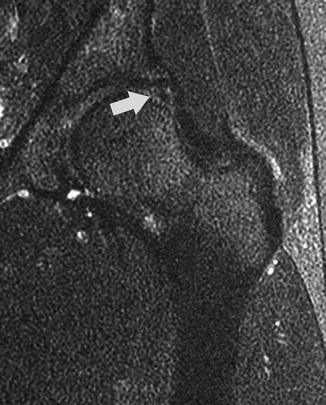
Fig. 13
Fat-suppressed oblique axial (a) and coronal (b) T1-weighted images in a patient after prior femoroplasty show a peripheral detachment centered around 3 o’clock. Note how the extent of the detachment is nicely displayed in (b). Also, note the diffuse intermediate signal and slightly irregular contour of the anterior labrum in (a), reflecting diffuse degeneration; this is in contrast to the normal low-signal posterior labrum
Fig. 14
(a, b) Fat-suppressed coronal T2-weighted images (different patients) on pelvis MRI show linear signal in the anterosuperior labrum or at the anterosuperior chondrolabral junction (arrows), representing tears
Fig. 15
(a, b) Successive fat-suppressed coronal T2-weighted images show very thin, linear, slightly high signal at the anterosuperior chondrolabral junction (arrows), a peripheral detachment
Fig. 16
Fat-suppressed coronal T2-weighted image, markedly “grainy” due to low signal-to-noise ratio, shows vague heterogeneous high signal at the chondrolabral junction at 1 o’clock (arrow), reflecting tear
Radial MR imaging has thus been utilized to evaluate the labrum. Radial imaging is performed by using a plane perpendicular to the acetabular rim, obtained from the oblique axial and coronal sequences. Slices in this plane are then obtained at a constant interval (usually 15° intervals) over 360°. This technique lessens the problem of volume averaging in standard imaging planes as the labrum can be imaged in a more direct, perpendicular fashion at all clockface locations. Somewhat surprisingly, however, the use of the sequence has been shown in one study to not improve the accuracy of labral tear detection [23].
Certain labral tear sites are associated more frequently with certain conditions. For example, given the otherwise relative rarity, the presence of a posterior labral tear suggests prior posterior subluxation or dislocation. An isolated tear at or close to 3 o’clock may reflect iliopsoas impingement, particularly in the absence of FAI pathomorphology or its sequelae (Fig. 17) [24–26]. However, the labrum may appear entirely normal at MRI in iliopsoas impingement; no findings suggestive of the focal injection and inflammation seen at arthroscopy are detected with MRI. No specific findings related to the iliopsoas tendon have been found in the impingement patients [24, 25].
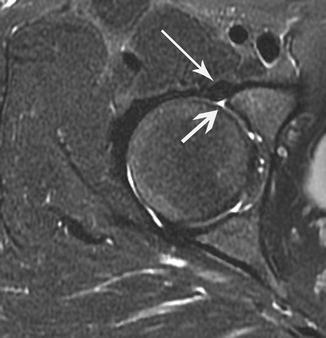
Fig. 17
Fat-suppressed oblique axial T2-weighted image shows a peripheral labral detachment at 3 o’clock (shorter, thicker arrow) with adjacent iliopsoas tendon (longer, thinner arrow) in a patient with iliopsoas impingement. Note that in many of patients with iliopsoas impingement, the tendon is not directly adjacent to the tear
Cartilage
Morphologic Imaging
As the extent of chondral loss is a primary determinant of hip preservation surgery outcomes, accurate detection is paramount [27–30]. The accuracy in detection of cartilage defects has varied widely as has interobserver agreement [31–34]. More specifically pertaining to delamination, the sensitivity of its detection is poor to moderate at best [31, 32, 34]. Detection of chondral defects is particularly difficult on MRI due to the curved, closely opposed surfaces of the dome and head. Magnifying the difficulty is the relatively thin cartilage over both surfaces. Moreover, the majority of pathology is located anterosuperiorly, a site of prominent volume averaging on MRI.
Fluid-sensitive sequences are utilized for cartilage evaluation. Likewise, post-arthrogram T1-weighted sequences, typically with fat suppression, are often utilized. The oblique axial and coronal planes are complementary in evaluating the cartilage in the anterosuperior quadrant. The sagittal images may also be complementary, usually for evaluating the cartilage over the dome as volume averaging greatly impedes evaluation of the relatively thinner cartilage over the subjacent head. Given the unavoidable volume averaging that occurs at 1–2 o’clock (or in any location other than around 3, 12, and 6 o’clock), there should be particularly close scrutiny for subtle findings at these locations in all planes (Fig. 18). If chondral pathology is seen on coronal images at 12 o’clock, far and away more common over the dome, this should heighten the scrutiny of the 1–2 o’clock positions to detect extension.
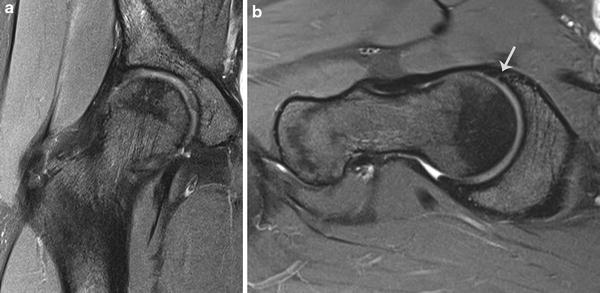
Fig. 18
Fat-suppressed coronal proton density-weighted images show loss of definition of the cartilage over the head and dome at 1 o’clock (a) and 2 o’clock (b). Note the anterior labral tear in (b) (arrow)
The oblique axial sequence is best in evaluating the cartilage over the anterior dome and head as well as the anterior and posterior parafoveal region. The coronal sequence is best in evaluating the cartilage over the medial dome and head. The sagittal sequence is complementary to the oblique axial sequence in evaluating the cartilage over the posterior dome and head; it is also complementary to the coronal sequence in the evaluation of the cartilage over the superior dome and head.
There are many grading systems for chondral loss with fairly extensive variations between multiple schema [35]. On MRI, defects can be classified as superficial, partial-thickness, or full-thickness/exposed subchondral bone. While it would be ideal to distinguish low-grade partial-thickness defects (less than 50 % thickness) from high-grade defects, in practicality this is often very difficult, particularly using studies with suboptimal resolution and at sites of volume averaging (e.g., 1 o’clock). For these same reasons, distinguishing between deep partial-thickness and full-thickness defects, as well as the extent of chondral loss, can be extremely difficult (Fig. 19). A clue to look closer for overlying chondral loss is a subchondral marrow edema pattern, sometimes relatively small, focal, and relatively innocuous in appearance (Fig. 20) [36].
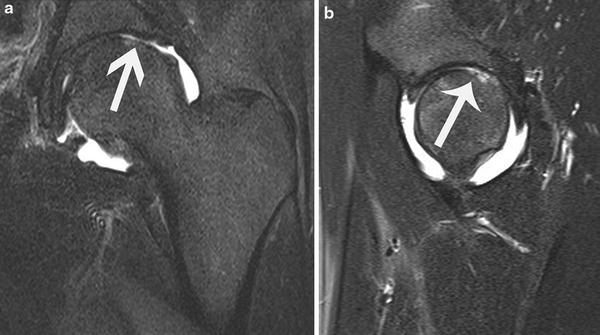
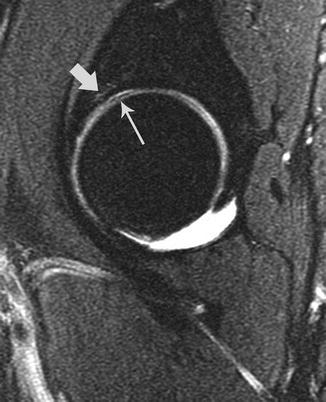
Fig. 19
(a, b) Post-arthrogram fat-suppressed coronal and sagittal T2-weighted images show extensive chondral loss over the posterosuperior head (arrows). While exposed subchondral bone is clearly seen, there are adjacent areas in which deep partial-thickness chondral loss appears to be present (particularly lateral to the exposed bone in (a). There was a 30 × 8 mm area of exposed bone over the head at arthroscopy; even in retrospect, the greatest extent of exposed bone that could be visualized on MRI was 20 mm
Fig. 20
Fat-suppressed sagittal T2-weighted sequence shows a very mild, irregularly shaped marrow edema pattern in the dome (short, large arrow) adjacent to elongated high signal at the adjacent tidemark (long, thin arrow), reflecting chondral delamination
Chondral delamination (i.e., frank debonding from the subchondral plate) can clearly be seen at times on MRI when thin, elongated high signal on fluid-sensitive sequences, usually the same signal as joint fluid, is interposed between the subchondral plate and the overlying cartilage (Figs. 21 and 22). Delamination can also be detected when high chondral signal is present with overlying thin low signal; this has been described as the inverted “Oreo” cookie sign given the low signal is “sandwiched” between the deep high signal and the superficial joint fluid (Fig. 23) [37]. Although unclear as to the etiology of the superficial low signal, it could potentially reflect proteoglycan depletion or fibrous metaplasia [37].
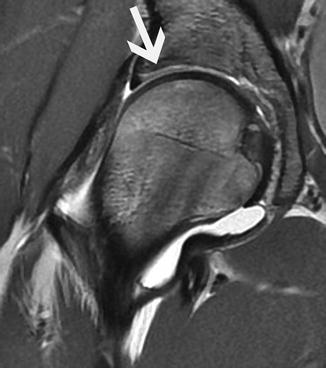
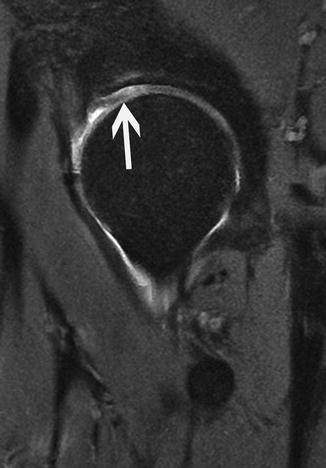
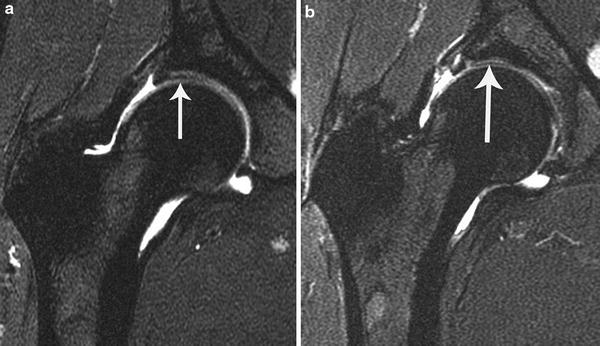
Fig. 21
Post-arthrogram coronal proton density-weighted image shows extensive linear, elongated fluid extending from the chondrolabral junction over the far anterosuperior dome (arrow) adjacent to the tidemark (represented by adjacent deep low-signal line), representing chondral delamination
Fig. 22
Fat-suppressed post-arthrogram sagittal T2-weighted image shows linear fluid signal extending from the chondrolabral junction over the anterosuperior dome adjacent to the tidemark (arrow), consistent with chondral delamination. Note the adjacent subchondral high signal in the dome, representing an associated marrow edema pattern
Fig. 23
Successive post-arthrogram fat-suppressed coronal T2-weighted images show surgically documented chondral delamination over the lateral dome, manifested as minimally high signal in the cartilage with adjacent superficial linear low signal (arrow in a) and high signal “sandwiched” between two linear areas of linear low signal (arrow in b). Also note the adjacent labral tear in (b)
Intrasubstance chondral delamination (carpet lesion) can also be seen but is often difficult to discern from frank basal delamination. This can be seen when there is elongated, linear high signal in the cartilage but with clearly identifiable cartilage located deep to the signal. Often the high signal extends peripherally to the chondrolabral junction and/or communicates with a fissure. Cartilage that is clearly heterogeneous, containing areas of slightly high signal without a frank fissure or superficial defect, likely reflects extracellular matrix depletion/degeneration. This may manifest at arthroscopy as chondral “softening” and the wave sign, consistent with chondral extracellular matrix disorganization/degeneration (Fig. 24). Importantly, it is often very difficult to discern whether elongated, linear high chondral signal represents delamination, whether frank debonding from the tidemark or within the substance of the cartilage, from chondral softening, particularly on low-resolution exams (Fig. 25).
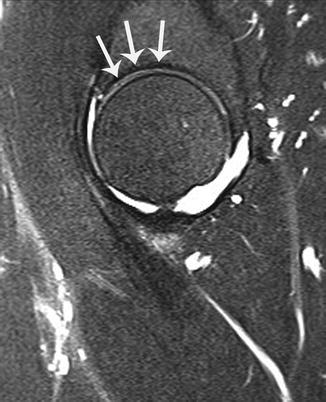
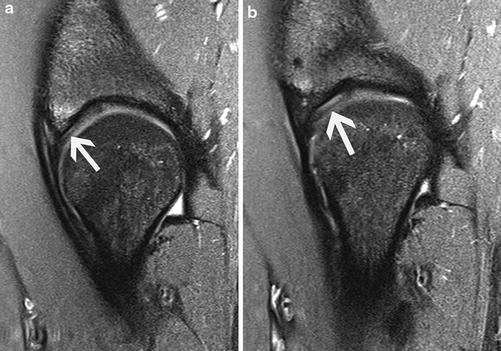
Fig. 24
Post-arthrogram fat-suppressed sagittal T2-weighted image shows extensive thin linear signal in the cartilage over the dome (arrows); a wave sign was noted at arthroscopy. As in this case, it is often difficult to differentiate between chondral delamination and “softening” on MRI
Fig. 25
(a, b) Successive fat-suppressed sagittal proton density-weighted images show linear high signal deep within the cartilage over the dome, adjacent to the tidemark (arrows). While this appears to be chondral delamination, only softening was found at arthroscopy
Although less frequent, chondral defects can be seen on MRI over the head, particularly in the parafoveal region (Figs. 26, 27, and 28). Due to volume averaging, detecting and quantifying the depth and extent of loss of the thinner cartilage over the periphery of the head is frequently very difficult. Likewise, due to the relative decreased thickness over the central dome, defects in this location are usually more difficult to visualize. Posteroinferior chondral loss may be detected, usually indicating the effects of contrecoup impaction in pincer FAI (Fig. 29).
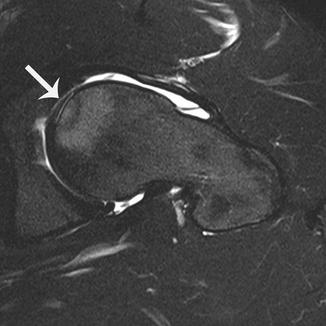
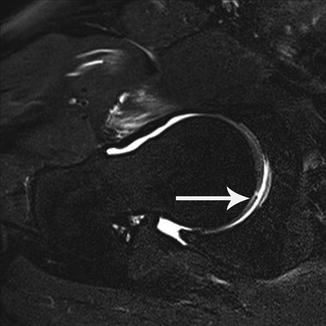
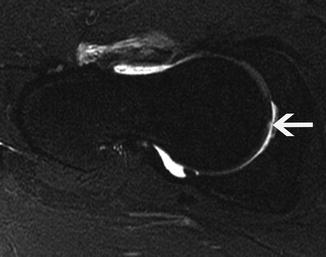
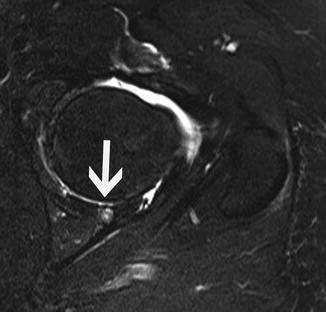
Fig. 26
Post-arthrogram fat-suppressed oblique axial T2-weighted image shows linear fluid signal adjacent to the tidemark over the anterior suprafoveal head (arrow), reflecting chondral delamination. Note the adjacent extensive subchondral high signal (i.e., marrow edema pattern). Note the large cam lesion
Fig. 27
Post-arthrogram fat-suppressed oblique axial T2-weighted image shows a chondral flap over the posterior suprafoveal head (arrow)
Fig. 28
Post-arthrogram fat-suppressed oblique axial T2-weighted image shows a tiny, focal partial-thickness chondral defect, less than 50 % in thickness, over the suprafoveal head (arrow)
Fig. 29
Post-arthrogram fat-suppressed oblique axial T2-weighted image shows exposed bone over the posteroinferior dome (arrow) with associated subchondral cyst
For reasons stated previously, high-resolution MR imaging is paramount for accurate detection of chondral pathology. While less specific due to the low resolution obtained with larger fields of imaging, chondral defects can be visualized, particularly higher-grade defects. In some cases, delamination can be suspected (Fig. 30).
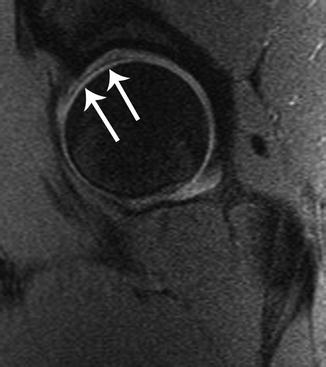
Fig. 30
Post-arthrogram fat-suppressed sagittal proton density-weighted image shows vague slightly high signal deep in the cartilage over the dome, marginated by superficial linear low signal (arrows). This was delaminated cartilage at arthroscopy
One potential pitfall in cartilage evaluation is the supra-acetabular fossa (Fig. 31). This is a small, well-defined concavity of the subchondral plate of the dome, located at 12 o’clock. There is varying overlying chondral thickness, including absence of the overlying cartilage. In a study of 1,002 patients with MRA, it was present in 10.5 % of cases [38].
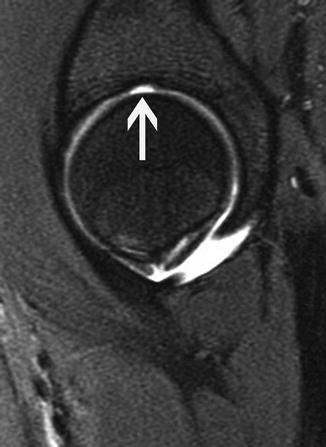
Fig. 31
Post-arthrogram fat-suppressed sagittal T2-weighted image shows a focal well-defined concavity of the subchondral plate with thin overlying cartilage at 12 o’clock (arrow), representing a normal supra-acetabular fossa
On a different note, it is important to note when ordering an MRI if metallic fixation hardware is present. While the hardware should be recognized by the radiologist protocoling the MRI, this presupposes that radiographs are viewed at the time of protocol determination which is not always the case. MRI technologists most often perform the exam as protocoled. Thus, images will be obtained with marked magnetic susceptibility artifact if the usual spectral fat-suppressed sequences are performed (Fig. 32). This artifact may greatly obscure the adjacent cartilage and labrum, particularly if situated close to the central compartment. In these cases, it is recommended that nonfat-suppressed sequences be performed for more accurate assessment of the cartilage and labrum.
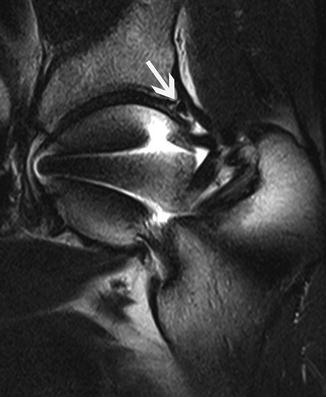
Fig. 32
Post-arthrogram fat-suppressed sagittal T2-weighted image shows marked magnetic susceptibility artifact associated with SCFE fixation screw. Arrow points to incompletely visualized anterior labrum, obscured by the artifact
Quantitative Imaging
Techniques have been used in MRI to more quantitatively assess the status of the cartilage extracellular matrix. They afford detection of early derangement of the matrix contents, a marker of early degeneration. These techniques include delayed gadolinium-enhanced MRI of cartilage (dGEMRIC), T2 mapping, and T1-rho imaging.
dGEMRIC imaging is performed with intravenous, or less frequently, intra-articular gadolinium. After administering gadolinium, the patient exercises for usually a 10- to 15-min period, and imaging is performed at 45–90 after the contrast is given. Given the negative charge of gadolinium, it accumulates within the cartilage in proportion to the degree of loss of negatively charged glycosaminoglycans (proteoglycan side chains), measured by the dGEMRIC index. T2 mapping assesses the degree of loss of collagen fiber orientation and subsequent increased mobility of water in the matrix; T2 values increase proportional to the degree of collagen disorganization. T1-rho imaging assesses the interactions between hydrogen and the macromolecules in water, correlating with proteoglycan content; T1-rho values increase as the proteoglycan content decreases [39].
dGEMRIC has been studied most frequently in the hip. In a study of patients with hip dysplasia, Kim et al. found the dGEMRIC index to correlate with pain and the severity of dysplasia [40]. In a study of 47 patients undergoing a Bernese periacetabular osteotomy for dysplasia by the same group, among radiographic evidence of osteoarthritis, subluxation, and the dGEMRIC index, the index was found to be the most important predictor of failure [41].
Ligamentum Teres
The contribution of ligamentum teres tears to pain is difficult to accurately pinpoint as most patients have other coexistent pain-generating pathology (e.g., labral tears, chondral lesions) [42–44]. Pain due to isolated tears without other intra-articular pathology can, however, occur [45]. Its contribution to hip stability is controversial [46]. If the ligament has a significant contribution to stability, it would be expected and make sense that patients having previously undergone surgical hip dislocation with usual sacrifice of the ligament would have subsequent instability; however, to the author’s knowledge, no such literature of instability following surgical dislocation exists.
The ligament is usually composed of two bands, although it has been found to instead be composed of three bands [47]. Congenital absence of the ligament has been described [48]. The normal ligamentum teres is homogeneously low in signal on all sequences, extending from the fovea/bare area distally to insert on the transverse acetabular ligament and adjacent pubis and ischium. It is more ovoid in shape proximally at the fovea; its midportions and distal portions are flatter and somewhat pyramidal in shape.
Like all ligaments, intrasubstance degeneration is common with aging, most frequently observed proximally, manifested as intermediate and high signal within its substance on fluid-sensitive sequences. Given the mucoid/myxoid and fatty degeneration, intrasubstance intermediate to high signal may be seen within the ligament on T1-weighted sequences. Additionally, occasionally osseous metaplasia can be seen in the ligament.
Partial tears of the ligament are fairly common (up to 46 %) and ruptures less so (4–15 %) [42, 45, 49, 50]. Partial tears are often difficult to differentiate from degenerative change of the ligament on MRI. The sensitivity and specificity in partial tear detection are subpar [51].
As most partial tears occur proximally at or near the fovea, this location should be most highly scrutinized. The ligament has normal striations of high to slightly high signal on fluid-sensitive sequences, reflecting interstitial fluid between its layers of collagen, throughout its course that usually become more conspicuous with aging; this signal is also located between its discrete bands. Both the intact degenerated ligament and partially torn ligament can have frayed margins and be attenuated or thickened on MRI (Fig. 33). Partial tears may be small, very thin, and focal. For definitive diagnosis of a partial tear, fluid signal should be seen extending to at least one margin of the ligament (Fig. 34).
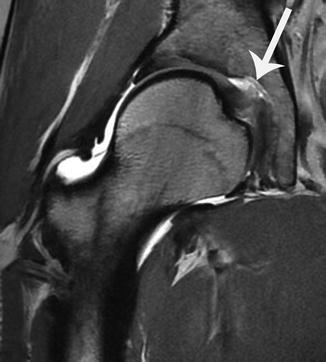
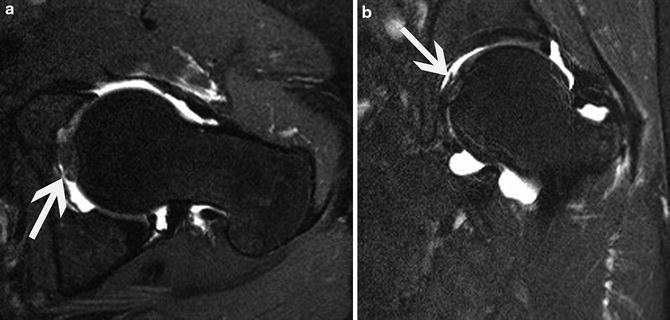
Fig. 33
Post-arthrogram coronal proton density-weighted image shows marked fraying and heterogeneous, slightly high signal in the proximal ligamentum teres (arrow). This appearance can be seen in both the partially torn and degenerated, intact ligament
Fig. 34
Post-arthrogram fat-suppressed oblique axial (a) and coronal (b) T2-weighted images show focal, thin high signal in a portion of the proximal ligamentum teres, extending to its surface (arrows), consistent with partial tear as was found at surgery
However, partial tears can simply manifest with intrasubstance signal. In an MR arthrographic study, 10 (out of 12) known partial tears only had linear intrasubstance fluid signal, with or without irregular contour of the adjacent periphery of the ligament; intact ligaments also had similar findings [51]. Hence, both false-positive and false-negative diagnoses on MRI are not unexpected. Further complicating matters of diagnosis, as Botser et al. state in their series delineating partial tears into less than or more than 50 % in thickness, “low-grade partial-thickness tears … may have been disregarded in previous literature” [42].
The oblique axial (or straight axial) plane is usually the best plane to detect partial tears as the ligament is seen in cross section. The coronal plane may also be useful, although the normal striations within and thin separation between the bundles can simulate tears. The sagittal plane is frequently unhelpful given relatively poor visualization of the ligament and volume averaging as this is the plane that the majority of the ligament traverses. In addition, the so-called ligamental plica can often be seen just medial to the ligament, particularly after arthrography and in the setting of a joint effusion; although rarely confusing due to its clear separation from the ligament and its elongated course, it should not be mistaken for a partial tear (Fig. 35) [52].
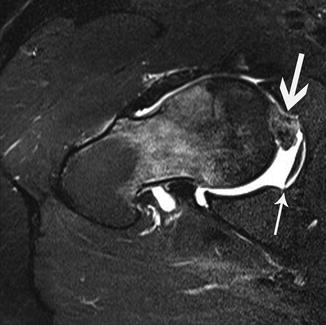
Fig. 35
Post-arthrogram fat-suppressed oblique axial T2-weighted image shows hypertrophy and heterogeneous signal in the proximal ligamentum teres with linear partial tear (thicker arrow). Also note the thin, elongated low-signal band-like structure deeper in the cotyloid fossa (thinner arrow), a ligamental plica. Note the prominent marrow edema pattern in the neck and distal head related to subchondral fracture associated with head avascular necrosis (not shown). There is also a large cam lesion
Rupture of the ligamentum teres is most often due to prior hip dislocation or in the setting of advanced degeneration [53]. Ruptures can occasionally be due to a twisting injury [45]. Rupture detection is straightforward. Frank discontinuity is present, usually at the fovea or in its midportion (Fig. 36). The ligament distal to the site is frequently attenuated and wavy. While occasionally reactive marrow edema, or a frank intraosseous ganglion, is present at its foveal insertion, almost always in the setting of ligament degeneration, parafoveal marrow edema can signify the presence of an acute rupture/avulsion in the setting of recent trauma.
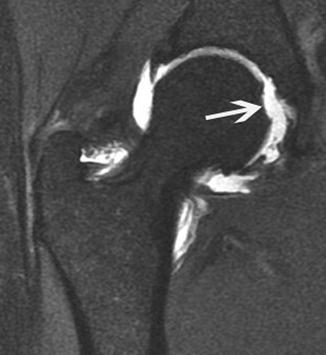
Fig. 36
Post-arthrogram fat-suppressed coronal T1-weighted image shows absence of the ligamentum teres at the fovea (arrow), representing ligament rupture
No description of the MRI appearance of ligamentum teres reconstruction or tears of reconstructions in the literature is known to the author. Likely, similar to the appearance of the reconstructed or augmented labrum, heterogeneous signal is to be expected within the reconstructed ligament on MRI. Tears of the reconstructed ligament most likely will be those of any ligament, namely, fluid signal extending into the ligament with or without an irregular contour or frank displacement or absence of a portion of the ligament.
The Peripheral Compartment
The Capsule
The capsule of the hip includes four distinct thickenings: the iliofemoral, ischiofemoral, and pubofemoral ligaments and the zona orbicularis. The iliofemoral ligament is a stout thickening of the anterior and anterolateral capsule; it is readily visualized on all three usual planes of imaging on MRI. The ischiofemoral ligament is a posteroinferior thickening of the capsule; it is also visualized well on all three standard planes of imaging. The pubofemoral ligament, located caudally, is the most difficult of the capsular ligaments to image fully, best noted on the sagittal and axial sequences. The zona orbicularis, present as a circular sling-like structure about the femoral neck, can be seen in all three planes; it is better visualized in certain locations in different planes (e.g., due to volume averaging, the anterior and posterior portions of the ligament are better seen on the oblique axial sequence than on the coronal sequence).
In an MR arthrogram study of 30 patients, equally divided between men and women, men had a significantly thicker capsule only anteriorly [54]. However, a defined normal thickness of the capsular ligaments is not known. It is also not known what, if any, change in thickness of the ligaments occurs with capsular distention (e.g., after arthrography). However, although nonspecific, as in the glenohumeral joint, subjective capsular laxity suggests capsular instability; this subjective assessment most likely is more accurate in the eyes of an experienced radiologist who has seen many hip joints imaged and has a rough baseline as to the typical appearance of the capsule. In the author’s experience, the native capsule in patients with capsular laxity/insufficiency has more prominent outward curvature, particularly evident near the insertions (Figs. 37 and 38). In the author’s experience, unless a process is present predisposing the patient to capsular laxity (e.g., Ehlers-Danlos, Marfan, Down syndrome), the insufficient capsule usually subjectively appears normal in thickness.
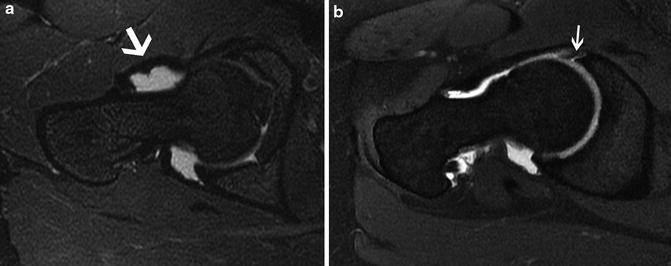
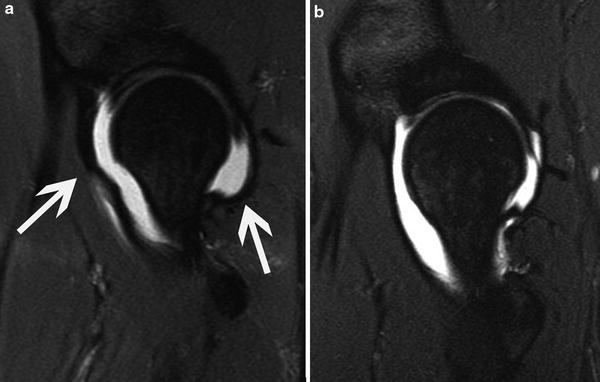
Fig. 37
Post-arthrogram fat-suppressed oblique axial T2-weighted images of two different patients. The patient in (a) had instability under anesthesia; note the prominent outpouching of the distal iliofemoral ligament (arrow). Compare this to the capsule of the normal patient without instability in (b). Incidentally, note the anterior labral tear in (b) (arrow)
Fig. 38
Post-arthrogram fat-suppressed sagittal T2-weighted images of two different patients. Note the prominent diffuse irregular outpouching of the iliofemoral ligament (anterior arrow) and ischiofemoral ligament (posterior arrow) in (a); this patient had gross instability. Compare to the normal capsule appearance in the patient without instability (b)
The iliofemoral and/or ischiofemoral ligament can be disrupted during hip dislocation, as can, occasionally an avulsion fracture at the ligament’s insertion. On MRI, the findings are not subtle and usually manifest as a large gap in the injured ligament, often with joint fluid extravasating into the adjacent soft tissues (Fig. 39).
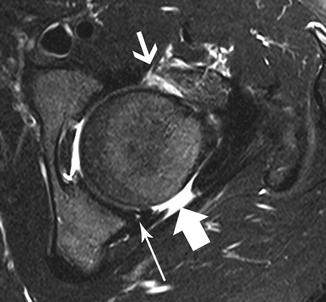
Fig. 39
Post-arthrogram fat-suppressed oblique axial T2-weighted image in a patient with multiple prior dislocations shows wide dehiscence of the ischiofemoral ligament (thick arrow), a tear of the iliofemoral ligament (thinner arrow) with diffuse heterogeneous thickening of the ligament distally, and small focus of fluid signal in the posteroinferior labrum (long, thin arrow), reflecting tear (present on other images)
Of note, the iliofemoral ligament can appear markedly irregular and usually abnormally thickened due to iatrogenic contrast injection during arthrography (Fig. 40). While usually in its midportion, the abnormal appearance can be relatively diffuse. This spurious finding on MRI can usually be detected as the gadolinium-containing mixture is high in signal on the fat-suppressed T1-weighted sequences (unlike normal synovial fluid); the high signal on these sequences will be seen in the ligament at the site of abnormality, often extending into the adjacent soft tissues along the injection track.
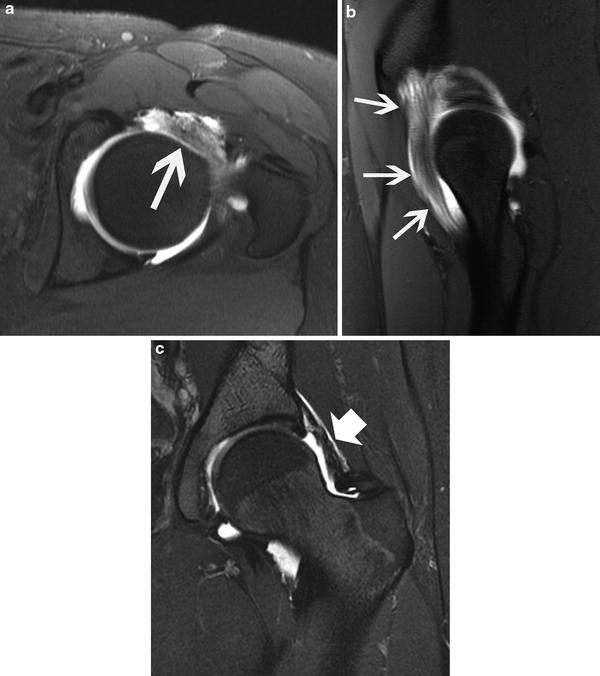
Fig. 40
 Neuromuscular Hip Disorders: Focus on Cerebral Palsy
 Femoral Deformities: Varus, Valgus, Retroversion, and Anteversion
 Surgical Technique: Arthroscopic Labral Management
 Surgical Technique: Endoscopic Gluteus Medius Repair
 Introduction to Static and Dynamic Overload of Hip Pathology
 Physical Examination of the Hip and Pelvis


Post-arthrogram fat-suppressed oblique axial (a) and sagittal (b) T1-weighted images as well as fat-suppressed coronal (c) T2-weighted image of the same exam show extensive, diffuse enlargement and high signal within the iliofemoral ligament (a and b). Note in (a) the proximal ligament appears to be discontinuous. Also, note the irregular, predominantly linear foci of high signal in the overlying superficial soft tissues in (a), representing the track of the needle (and contrast) during the arthrogram. T2-weighted images can help to clarify whether the abnormal signal and shape of the ligament are spurious as it will usually be heterogeneously lower in signal than the joint fluid, as in (c). Note that no capsular defect was present at surgery
Related posts:
Neuromuscular Hip Disorders: Focus on Cerebral Palsy
Femoral Deformities: Varus, Valgus, Retroversion, and Anteversion
Surgical Technique: Arthroscopic Labral Management
Surgical Technique: Endoscopic Gluteus Medius Repair
Introduction to Static and Dynamic Overload of Hip Pathology
Physical Examination of the Hip and Pelvis
Stay updated, free articles. Join our Telegram channel
Full access? Get Clinical Tree
