Fig. 12.1
Representative proton T2 MRI (grayscale) and corresponding T1ρ maps (in color overlaid on grayscale T1ρ-weighted image) of the lumbar discs from a 52-year-old female (a) and a 35-year-old male (b) patients diagnosed with low back pain and from an asymptomatic 38-year-old male (c). Average T1ρ (in ms) was measured in the disc nucleus and is displayed below each disc, followed by the opening pressure (in psi) and whether discs were painful (P) or non-painful (N), both determined by discography are indicated in the lower back pain patients (Borthakur et al. 2011). This data demonstrates the potential for noninvasive T1ρ measurements as a surrogate measure of disc pressure in the clinics
Since annular fissures can be innervated, degeneration of the annulus fibrosus may be the source of back pain in patients with degenerative disc disease (Peng et al. 2006). Unfortunately, due to the non-averaged dipolar interaction of water bound to highly oriented collagen fibers, which shorten T2, the annulus appears dark in conventional MRI. The effect of spin-locking on the laminar appearance of cartilage in MRI, using orientation-dependent studies, indicated that when the normal to the surface of cartilage was parallel to B0, a typical laminar appearance was present in T2-weighted images but was absent in T1ρ-weighted images of the same specimen (Akella et al. 2004). At the “magic angle” orientation (when the surface normal was 54.7° with respect to B0), neither T2 nor T1ρ images demonstrated laminae. However, T1ρ values were greater than T2 at both orientations throughout the cartilage layers.
In experiments on a bovine disc specimen (Fig. 12.2), we noted that the annulus signal could be enhanced by simply increasing the spin-lock frequency of the T1ρ MRI pulse sequence compared to T2 MRI (image in the top left). The qualitative difference between T2 and T1ρ images, especially in the annulus fibrosus, at the standard operating frequency of 500 Hz for clinical T1ρ MRI protocol is obvious. T1ρ MRI provides 2-fold higher signal in the nucleus and 4-fold higher in the annulus compared to T2 MRI. This approach serves as a method to overcome MRI signal loss mechanisms. The measurement of T1ρ as a function of the B1 amplitude is known as “T1ρ-dispersion” and contrast is governed by the spectral density components of the sample that are in the neighborhood of γB1. While the literature on the contributors to T1ρ dispersion in cartilage is sparse, the data in Fig. 12.2 clearly supports the notion that the non-averaged dipolar interaction between water protons associated with collagen is the predominant contributor.
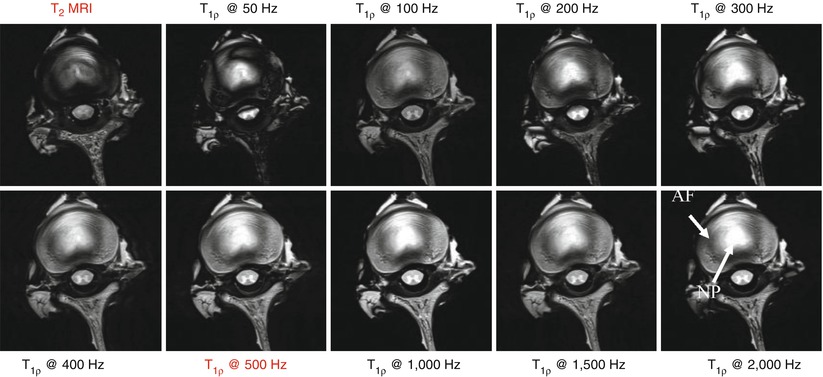

Fig. 12.2
Increased MRI signal was observed in the annulus fibrosus region in bovine disc specimens compared to T2 MRI (image in the top left) by increasing the spin-lock frequency of the T1ρ MRI pulse sequence. The qualitative difference between T2 and T1ρ images, especially in the annulus fibrosus, at the standard operating frequency of 500 Hz for clinical T1ρ MRI protocol is clearly visible. T1ρ MRI provides a twofold higher signal in the nucleus pulposus and fourfold higher in the annulus fibrosus compared to T2 MRI
12.6.2 Magnetization Transfer (MT) MRI
The MT pulse sequence employs a pulse to selectively saturate magnetization, and hence the MRI signal, from water bound to macromolecules such as collagen (Wolff et al. 1991). MT ratio (MTR) maps can be generated from two images that are collected, with MT preparation (Ms) and without (M0). These maps are generated by setting the off-resonance saturation pulse at 6.4 kHz down field of the free water proton resonance frequency (Fig. 12.3). Differences in lumbar discs can be seen in the proton-density MRI of a 30-year-old healthy individual and a 69-year-old asymptomatic subject who exhibits decreased disc height, loss of nucleus pulposus hydration, as well as herniation in the lower lumbar discs. The corresponding MTR maps (in color) showed increased values in the nucleus pulposus of the 69-year-old subject, while there is a clear delineation of the annulus fibrosus-nucleus pulposus boundary in the 30-year-old subject. High MTR values (in white) indicate intact collagen in the annulus fibrosus of the younger individual. A closer look at the MTR maps of the L3/L2 disc, for example, demonstrates a distinct boundary between MTR values within the nucleus pulposus and annulus fibrosus of the 30-year-old subject, while it is diffuse in the 69-year-old subject, indicating a loss of collagen architecture in the annulus and deposition of collagen into the nucleus (Wang et al. 2010c).
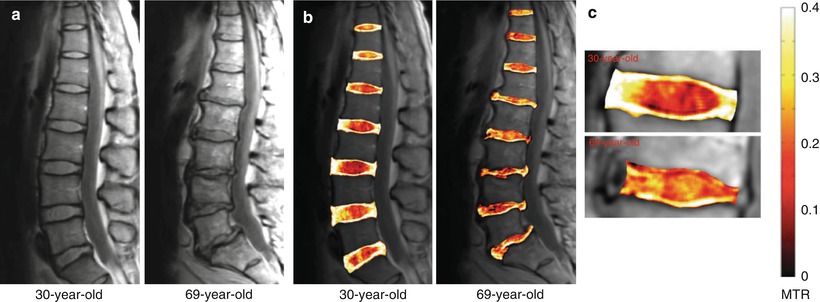

Fig. 12.3
(a) Proton-density MRI of a 30-year-old healthy and a 69-year-old asymptomatic subject. (b) MTR map (in color), (c) MTR maps of the L3/L2 disc (Wang et al. 2010c)
12.6.3 Chemical Exchange Saturation Transfer (CEST) MRI
Chemical exchange saturation transfer (CEST) is a method to directly detect exchangeable solute protons in tissues by constant irradiation and saturation of their chemically shifted magnetization (Ward et al. 2000; Ward and Balaban 2000). The CEST signal is detected as a reduction in the water signal after the saturated spins undergo chemical exchange with water (Forsen and Hoffman 1963), provided that the exchange is more rapid than the T1 of either site. The asymmetric distribution of labile protons around the central water peak in cartilage is readily detected in the difference image obtained after saturating symmetrically on either side of the water. A very homogeneous B0 is necessary for a robust estimation of the difference signal. Furthermore, care must also be taken to avoid the direct saturation of the water peak due to the close resonances of labile species of interest.
In spite of these stringent requirements, solutes in the nanomolar to millimolar range have been reliably detected using this approach in vitro (Aime et al. 1988; Zhang et al. 2001; Goffeney et al. 2001; Gilad et al. 2007) and in vivo (Zhou et al. 2003; van Zijl et al. 2007). The feasibility of CEST MRI to reliably detect glycosaminoglycan (GAG) in vivo was recently demonstrated in the cartilage of the knee joint (Schmitt et al. 2011) by comparing it with sodium MRI of the same joint and in the disc by Kim et al. (Fig. 12.4) utilizing a new water frequency mapping approach called “water saturation shift referencing” (WASSR), which provides a more accurate quantification of CEST effects (Kim et al. 2011). However, the “gagCEST” approach (Ling et al. 2008) should be limited to high-field scanners such as 7T since –OH protons in cartilage are only 1 ppm downfield from the water resonance and exchange at a rate of ∼1,000 s−1 (Schiller et al. 2001). Hence, the –OH chemical shift is only 129 Hz at 3FT and CEST MRI would introduce a substantial direct water saturation. Further, the slow to intermediate exchange limit (i.e., chemical shift between exchanging site and water, Δω > exchange rate, k), required for optimal CEST effect, is not fulfilled in the case of –OH protons at 3T. However, at 7T and higher fields, the larger frequency separation of –OH resonance from water fulfills both the (Δω > k) condition and also reduces the direct water saturation effect enabling a more reliable quantification of GAG at 7T using the gagCEST approach (Schmitt et al. 2011).
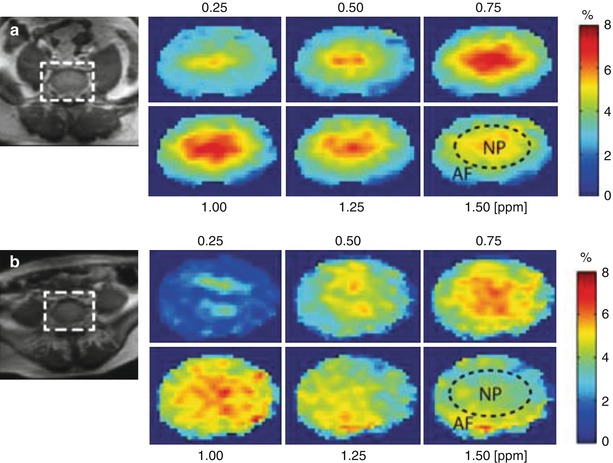

Fig. 12.4
Representative water saturation shift referencing (WASSR)-corrected glycosaminoglycan chemical exchange saturation transfer (gagCEST) maps of intervertebral disc (IVD) (zoomed) in two subjects: (a) 25-year-old woman at L5/S1 and (b) 54-year-old man at L5/S1. The gagCEST maps are shown at 0.25, 0.5, 0.75, 1, 1.25, and 1.5 ppm. The broken circle inside the map at 1.5 ppm shows an approximation of the nucleus pulposus (NP) and annulus fibrosus (AF) regions. In both subjects, the gagCEST effect is highest in the 0.75–1 ppm frequency range (Kim et al. 2011)
12.6.4 Ultrashort Echo Time (UTE) MRI
The vertebral endplate is composed of an inner bony and outer cartilaginous endplates. This endplate is the route for nutrient and metabolite supply to the avascular disc and is involved in metabolism, exchange of waste products, and biomechanics of the disc (Urban and Winlove 2007). It has previously been hypothesized that changes in disc mechanics may be initiated by damage to the endplate (Adams and Roughley 2006). Hence, visualizing morphological defects in the endplate could facilitate diagnosis of the cause of disc degeneration.
However, it appears dark on T2, endplate integrity is not discernable by conventional T2 MRI. This is due to a strong dipolar interaction experienced by protons in water bound to collagen resulting in short T2s (∼1–10 ms). The UTE MRI pulse sequence overcomes this impediment by one of the two methods, selecting the short T2 components with RF pulses or combining images acquired at different echo times effectively producing a MRI of only the short T2 species (Robson et al. 2003). There are several methods to perform UTE MRI on clinical scanners. Some employ a narrow bandwidth excitation RF pulse to selectively nutate long T2 components into the transverse plane, where they are nominally de-phased by gradients, leaving the short T2 components largely unaffected (Sussman et al. 1998; Larson et al. 2006). Other methods combine pairs of images such as those obtained by a half RF excitation, with and without gradient reversal, followed by radial imaging (Gatehouse and Bydder 2003). The later method has been employed to visualize the collagen-rich annulus fibrosus in human discs (Hall-Craggs et al. 2004) in which patients with the most severe degeneration show irregular signal from the endplates compared to normal; however, the reason for this observation is not clear (Fig. 12.5).
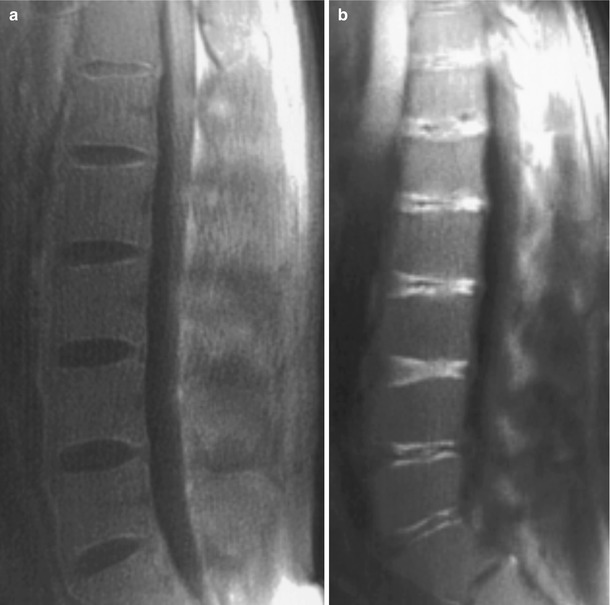

Fig. 12.5
(a) Normal spine in a 33-year-old volunteer. Sagittal fat and long T2-suppressed ultrashort echo time MRI of the lumbar and lower thoracic discs display a faint high signal in the region of the annulus fibrosus and endplates and low signal in the nucleus pulposus. (b) Male aged 29 years with β-thalassemia major-induced degenerative disc disease. High-signal bands are observed parallel to the endplates at all levels as well as more centrally in the discs in some levels (Hall-Craggs et al. 2004)
12.6.5 Sodium MRI
Based on the fact that Donnan equilibrium holds for cartilage equilibrated in very dilute solutions, Maroudas et al. have shown that the fixed charge density of cartilage is correlated with the proteoglycan content of the extracellular matrix of cartilage (Maroudas et al. 1969). In addition, Gu et al. reported that there was a reduction in the streaming potential (a measurement directly related to the fixed charge density) with intervertebral disc degeneration in tissue specimens (Gu et al. 1999a, b). As the charge density is counterbalanced by Na+ activity, the loss of the negatively charged PG due to degeneration lowers the fixed charge density in the tissue. Hence, there is a reduction in the concentration of positively charged sodium ions and a lowering tissue osmotic pressure.
Sodium (23Na) is one of the most “NMR-visible” nuclei in living systems. As a spin-3/2 nucleus with a nonzero quadrupolar moment, 23Na exhibits bi-exponential relaxation in tissues, i.e., fast and slow components of T2 and T2*. While nonquantitative sodium MRI of the spine has been performed (Insko et al. 2002), Wang et al. (2010a) recently imaged sodium in the bovine intervertebral disc and noted a significant correlation with proteoglycans measured by DMMB assay (Fig. 12.6). Subsequent imaging of the human disc in vivo revealed differences in the sodium MRI between an asymptomatic subject and a subject with lower back pain (Fig. 12.7). The lower sodium concentration in both L3–L4 and L4–L5 discs in the patient with back pain indicated a loss of proteoglycan, perhaps an early sign of disc disease.

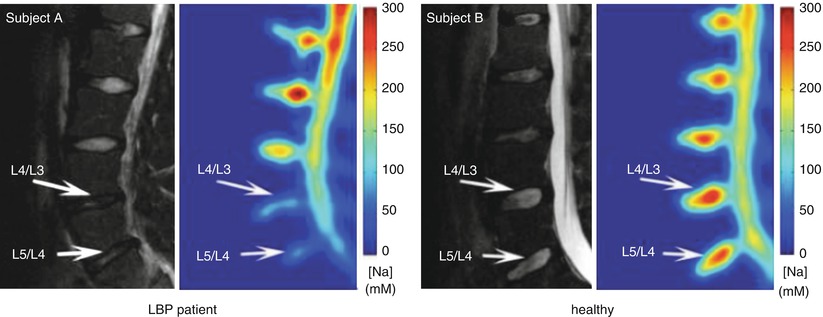

Fig. 12.6
Nine consecutive axial slices of a bovine disc specimen with [Na] ranging from 150 to 300 mM as calculated from sodium MRI (a). A plot of [Na] from the nucleus pulposus (NP) correlated well (r = 0.7) with PG measured by DMMB blue assay (b) (Wang et al. 2010a)

Fig. 12.7
Representative proton T2 MRI (grayscale) and corresponding [Na] maps (color) obtained in vivo on a 22-year-old male with lower lumbar trauma that resulted in chronic lower back pain and a 26-year-old healthy male (Wang et al. 2010a)
Due to its low gyromagnetic ratio (γ) and concentrations in tissues, sodium MRI requires field strengths ≥3T to obtain quality images to enable accurate quantification of fixed charge density and proteoglycan. The short T2 of 23Na (∼few ms) indicates that sodium MRI has to be performed with MRI pulse sequences with ultrashort echo times. Since 23Na γ is 1/4 of that of proton, sodium MRI requires 4 times stronger gradients to obtain images with identical resolution to that of proton MRI. Consequently, sodium MRI pulse sequences are forced to image at a long echo time (TE) of ≥2 ms, but again because of the short T2, substantial MRI signal is lost before acquisition. Recent advances in the development of high-field 7-tesla MRI scanners and gradient technology (with a gradient strength of >4 G/cm) should allow an ultrashort TE (<200 μs) that can significantly improve resolution and signal and provide hope for clinical sodium MRI. Radiofrequency coil technology (multiple channel capability) and parallel imaging approaches such as SENSE (Pruessmann et al. 1999) and SMASH (Sodickson and Manning 1997) and tuned preamplifiers could further contribute to make clinical sodium MRI feasible.
12.7 Path to Clinical Utility
The biochemical-based MRI biomarker technologies discussed here detect subtle molecular events that occur with disc degeneration, and therefore, they are of considerable clinical value. However, there remain some conflicts concerning their use (Lurie et al. 2000), while the natural history of the subtle findings revealed by the new technologies needs careful consideration and study (Deyo 2010). Further, image biomarkers are considerably more complex than biochemical biomarkers, and even if a composite biomarker can be delineated in the future, it is not clear how this would impact disease diagnosis. One potential answer is to utilize statistical and machine-learning algorithms to combine biomarkers to build a classifier suitable for diagnosis (Breiman 1996; Guyon et al. 2002) to answer the question: which approach gives the most timely, reliable, and accurate measurement of the pathological changes due to degenerative disc disease?
The experimental MRI CEST, MT, and T1ρ pulse sequences represent small modification to routine clinical imaging sequences and carry a potential risk of local tissue heating from the RF pulses. A previously validated method has been used to determine that the heat generated both theoretically and experimentally (Borthakur et al. 2003) by these pulse sequences is not in violation of FDA guidelines (Borthakur et al. 2004). Additional safeguards are also built into the scanner software, such that during MRI, the scanner continuously monitors the RF power automatically stopping the scan when FDA-allowed limits are exceeded. This safeguard eliminates the risk associated with any inadvertent errors during the scan. In addition, MRI near metallic implants remains a challenge because of severe image artifacts mainly stemming from large metal-induced field inhomogeneities causing local gradient-induced eddy currents (Guermazi et al. 2003). This is an impediment to routine MRI in back pain patients who have implants, such as pedicle screws, from prior surgery. To meet this challenge, new methods of MRI artifact reduction (Glover 1999; Lu et al. 2009) may need to be incorporated into existing protocols in order to advance these MRI-based biomarker technologies into routine clinical use.
12.8 Summary of Critical Concepts Discussed in the Chapter
Noninvasive imaging methods have the potential to increase diagnostic certainty and to provide information about disease activity that can be used to measure treatment efficacy in clinical trials.
Current imaging methods (X-ray, computed tomography, and MRI) can detect morphological changes in the disc, but they lack sensitivity at the early stages of disc degeneration.
Novel MRI techniques such as T1ρ, magnetization transfer (MT), chemical exchange saturation transfer (CEST), ultrashort echo time (UTE) MRI, and sodium MRI are sensitive to matrix macromolecules such as proteoglycan and collagen to varying degrees.
These MRI-based biomarkers of IVD degeneration should be incorporated into existing research imaging protocols in order to advance these technologies into routine clinical use.
Acknowledgements
This work was performed at an NCRR-supported Biomedical Technology Research Center (NIH RR02305) with additional funding from an AOSpine research grant (AOSBRC-07-05).
References
Adams MA, Roughley PJ (2006) What is intervertebral disc degeneration, and what causes it? Spine 31:2151–2161PubMed
Aime S, Nano R, Grandi M (1988) A new class of contrast agents for magnetic resonance imaging based on selective reduction of water-T2 by chemical exchange. Invest Radiol 23(Suppl 1):S267–S270PubMed
Akella SV, Regatte RR, Wheaton AJ, Borthakur A, Reddy R (2004) Reduction of residual dipolar interaction in cartilage by spin-lock technique. Magn Reson Med 52(5):1103–1109PubMed
Stay updated, free articles. Join our Telegram channel

Full access? Get Clinical Tree


