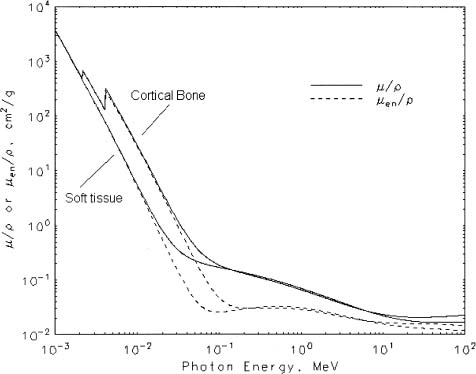
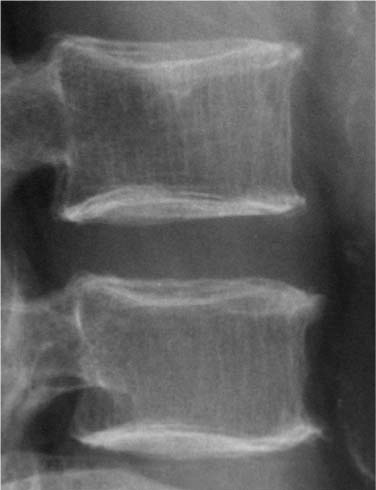
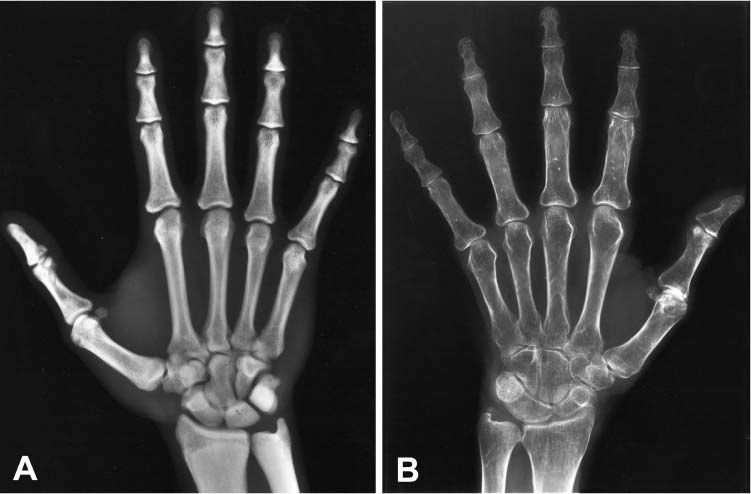
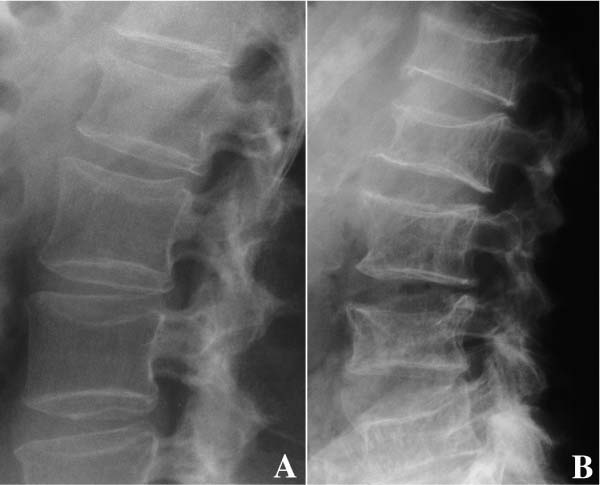
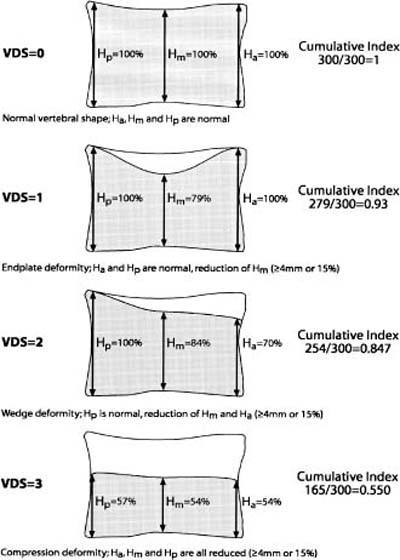
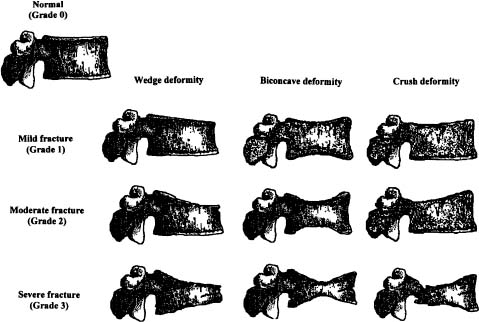
Chapter 5 The diagnosis of osteoporosis has always been a challenge to radiologists, clinicians, and other specialists alike, despite the wide range of instruments at hand today to aid decision making. The advent of devices that allow quantitative assessment of bone mineral density (the major determinant of bone strength and future fracture risk) has altered the field in clinical practice as well as research. Nevertheless, imaging of this disease with traditional radiological equipment has maintained its importance in the diagnosis of the manifestations of osteoporosis such as fracture and cortical thinning. In vivo radiography and densitometry are complemented by refined laboratory techniques including histomorphometry on histologic sections, computed microtomography, micro-magnetic resonance (MR) imaging, backscattered electron microscopy, and other techniques for detailed in vitro investigations. The purpose of this chapter is to provide perspectives on the available in vivo techniques, how they can be characterized, and their most important contributions to the field. According to its title, we have divided it into two subsections: radiographic techniques, as the more visual component of the radiologist’s armory, and densitometry, where results are presented not so much as images but as numbers characterizing the amount of bone or serving as numerical descriptors of its quality. In this section, we give an overview of techniques based on plain-film radiography that are used in the evaluation of osteoporosis. Their significance has been altered by the advent of quantitative densitometric methods for the diagnosis of osteoporosis as it is currently defined by the World Health Organization (WHO), which is mainly based on bone mineral density.1 Thus, radiological techniques cannot be used for the diagnosis of osteoporosis without densitometry, but they remain useful and important for the detection of complications of osteopenia, a term that has been coined as a generic designation for radiographic signs of reduced bone density. Predominant features that are sought for on the radiograph in clinical practice are fractures or deformities of the spine. To obtain a radiological image, photons produced at a pointlike X-ray or other photon source must penetrate the object of interest and register on a detecting plane, which can be a conventional X-ray film, an imaging plate, or some sort of electronic X-ray-sensitive digital detector. A meaningful image is obtained when different tissues exhibit adequate contrast. Contrast, in turn, is the result of differences in X-ray attenuation characteristics between these tissues. How does tissue attenuate X-ray photons? A certain percentage of the incident photon flux is lost to interactions with the object by one of three processes: absorption by photoelectric effect, scattering (coherent or Raleigh scatter and incoherent or Compton scatter), and electron pair formation (only at photon energies above 1.022 MeV, thus not relevant for diagnostic imaging). These effects can be comprehensively described by the total attenuation coefficient μ, which is proportional to the incident flux I and the thickness of the object dx: μ is dependent on the object and on the location of the interaction, because the composition of the object varies. Further, it is a function of the photon energy E because the constituent effects of μ are dependent on E. By integration with respect to I and x we can calculate the flux of exiting photons: FIGURE 5–1 Mass attenuation coefficients for cortical bone and soft tissue. μ/ρ is the total attenuation and μen/ρ is for attenuation by tissue energy absorption only. with object thickness d and incident flux I0. Since the energy dependence of μ is different for different materials, there is an X-ray energy that allows optimal contrast between bone and soft tissue. Attenuation of different tissues can be better compared in terms of mass attenuation μ/ρ, which is independent of tissue density ρ. Figure 5–1 shows that the difference between the mass attenuation coefficients for cortical bone and soft tissue is highest for lower energies, suggesting that radiographs be taken at very low energies to maximize contrast. On the other hand, the softer the radiation, the higher the relative contribution of photon absorption to the total attenuation. Since absorption has the same effect on contrast as scatter, but increases radiation dose substantially, photon energies need to be optimized to allow good contrast at a reasonable dose. For a lateral spine radiograph, tube energies at or around 90 kVp are typically chosen, yielding effective photon energies of about 70 keV. Quantitative analysis of osteopenia (i.e., densitometry) based on planar X-rays without protocol modification is difficult. Numerous technical factors need to be controlled, including exposure time, film-focus distance, anode characteristics, voltage, beam filtration, film/screen properties, and film-processing parameters. The object itself contributes significantly to this uncertainty because the bone thickness, the soft tissue composition, and the scattering characteristics of both tissues are usually unknown.2 Consequently, the sensitivity of this technique to changes in bone density is low. It has been estimated that as much as 20 to 40% of bone mass must be lost before a decrease in bone density can be seen in lateral radiographs of the thoracic and lumbar spine.3 Unless an automated quantitative approach is used, the diagnosis of osteopenia from a radiograph is also dependent on the experience of the reader and her/his subjective interpretation. Therefore, main radiographic findings of osteopenia focus on qualitative features such as changes in trabecular structure, cortical thinning, and assessment of vertebral fractures and deformities. These are discussed in the following sections. Radiographic absorptiometry, a densitometric technique that is based on radiography but employs the imaging of a reference standard such as an aluminum wedge, will be presented in the “Densitometry” section. Over the past decade, osteoporotic changes of trabecular structure have become an important focus in bone research as evidence mounted that bone density alone would not sufficiently explain the biomechanics of bone, and ultimately, the risk of fracture. Changes in the appearance of trabecular bone with the progression of osteoporosis had been documented radiographically much earlier (for instance by Singh in the proximal femur4). Because trabecular bone has a much higher surface-to-volume ratio than cortical bone, it is eight times more metabolically active than cortical bone and thus much more susceptible to osteoporotic changes.5 Changes are most prominent in the axial skeleton and in the ends of the long and tubular bones of the appendicular skeleton such as the proximal femur and the distal radius, ulna, and tibia. The patterns of these changes are predictable. In the beginning, non-weight-bearing trabeculae are thinned, then completely removed.6 This process can be offset by thickening of the remaining weight-bearing struts before these are affected as well.7 Figure 5–2 shows an osteoporotic spine demonstrating these features. FIGURE 5–2 Radiograph of osteoporotic lumbar vertebral body. Notice the vertical striation of the spongiosa, stemming from predominant loss of horizontal trabeculae and thickening of remaining vertical trabeculae. Although cortical bone is metabolically less active than trabecular bone, osteoporotic changes have wide ramifications because 80% of the skeleton consists of cortical bone. All parts of the cortex can be affected by osteoporosis, depending on the metabolic stimuli. At the endosteal surface, resorption leads to cortical thinning. If this process affects the surface inhomogeneously, the result is “trabecularization” of the cortex. At the late stage of osteoporosis, the cortex appears very thin but typically smooth. Intracortical resorption, acting on Haversian and Volkmann channels, can be seen on X-rays as a longitudinal striation or tunneling. These striations are a typical sign of aggressive high-turnover osteoporosis, as for instance caused by oophorectomy, hyperparathyroidism, osteomalacia, renal osteodystrophy, or postmenopausal osteoporosis. Finally, subperiosteal resorption leads to an ill-defined outer bone surface, a finding that is pronounced in high-turnover osteoporosis. On the other hand, periosteal bone apposition is often seen in aging subjects in the long peripheral bones, for instance the femur.8 The subsequent increase in bone diameter partially offsets the loss of mechanical stability caused by cortical thinning (Figs. 5–3A,B). Intuitively it is clear that the integrity of the trabecular structure is vital to the biomechanical competence of bone.9 Assessing it quantitatively with a projectional technique such as radiography is challenging because of overlay effects, although spatial resolution would be sufficient. Nevertheless, attempts to analyze it have been recorded early.10,11 Radiographic techniques have been used exhaustively in vitro to assess trabecular texture12–15 and fractal dimension.16,17 The tenor of these studies is that structural parameters correlate significantly with bone mineral density, but tend to contribute independently, however weakly, when applied toward fracture discrimination.18 Recently, Majumdar et al19 confirmed these trends in an in vivo study. We have described radiographic assessment of trabecular structure only. There are a number of other techniques that are used in this field, and a thorough review would certainly require a separate chapter. FIGURE 5–3 (A,B) Marked cortical thinning of all tubular bones. Radiogrammetry signifies measurement of bone dimensions on radiographs. First descriptions of this technique date back to Barnett and Nordin,20 who introduced spine, femur, and hand scores, reflecting midvertebral and anterior height at the spine and cortical thickness at the femoral shaft and metacarpal. Today’s major radiogrammetry applications include measurement of cortical thickness of phalangeal and metacarpal indices and measurement of hip axis length.21,22 Cortical thickness directly relates to osteopenia as the cortex becomes thinner with endosteal absorption. The small tubular metacarpal bones lend themselves well to this measurement because of ease of access and their high ratio of cortical bone. Besides cortical thickness, which is measured as the difference (douter—dinner) of the outside diameter (douter) and the inside diameter (dinner) of the bone, the cortical index (douter—dinner)/douter is often used. It was shown that cortical thickness correlates fairly well with total body bone mineral density23 and has very high short-term precision.24 A commercial radiogrammetry system that assesses cortical thickness of the metacarpals has recently gained clearance for clinical use in the United States (Pronosco X-Posure, Nov. 2000, Pronosco, Vedbaek, Denmark). In contrast to these cortical measurements, hip axis length does not relate directly to osteopenia, but it is intuitive from a biomechanical point of view that increased hip axis length (i.e., increasing the length of the lever through which forces from the pelvis are transmitted onto the femur) leads to reduced mechanical resilience. A significant association of hip axis length with hip fracture has been shown in the large study of osteoporotic fractures.22 Hip axis length can be acquired from standard hip radiographs and from dual X-ray absorptiometry (DXA) images or computed tomography (CT) scout views. Vertebral fractures are the hallmarks of osteoporosis, and even though one may argue that osteopenia per se may not be diagnosed reliably from spinal radiographs, spinal radiography continues to be a substantial aid in diagnosing and following vertebral fractures (Figs. 5–4A,B).25 Changes in the gross morphology of the vertebral body have a wide range from increased concavity of the end plates to complete destruction of the vertebral anatomy in vertebral crush fractures. In clinical practice conventional radiographs of the thoracolumbar region in lateral projection are analyzed qualitatively by radiologists or experienced clinicians to identify vertebral deformities or fractures. For an experienced radiologist, this assessment generally is uncomplicated, and it can be aided by additional radiographic projections such as anteroposterior and oblique views, or by complementary examinations such as bone scintigraphy, CT, and even MR imaging.26–28 FIGURE 5–4 (A) Increased biconcavity of the vertebral end plates; (B) multiple vertebral crush fractures. Vertebral fractures—the most frequent fractures in early postmenopausal women—have become the most important endpoints in epidemiological studies and clinical drug trials. In these settings conventional radiography is usually the only method used to assess vertebral fractures, and requirements and expectations differ considerably from the clinical setting.29 Examinations are frequently performed without specific clinical indications and without specific therapeutic ramifications. Evaluations for fractures are generally limited to lateral conventional thoracolumbar radiographs; the numbers of subjects are often quite large, requiring high efficiency; and the assessment may be performed by a variety of observers with different levels of experience. The detection of vertebral fractures may strongly depend on the experience of the reader. Experience with qualitative readings has shown considerable variability in fracture identification when radiologists or clinicians interpret radiographs without specific training, standardization, reference to an atlas, or prior consensus readings.30,31 Several approaches to standardizing visual qualitative readings have been proposed and applied in clinical studies. An early approach for a standardized description of vertebral fractures was made by Smith et al,32 who assigned one of three grades (normal, indeterminate, or osteoporotic) to a patient depending on the most severe deformity. The spinal radiographs were evaluated on a per patient and not on a per vertebra basis, a serious limitation for the follow-up of vertebral fractures and for the assessment of the severity of osteoporosis. Other standardized visual approaches allow for an assessment of vertebral deformities on a per vertebra rather than on a per patient basis, providing more accurate assessment of the fracture status of an individual and making follow-up of individual fractures possible. Meunier and coworkers33,34 proposed an approach in which each vertebra is graded depending on its shape or deformity. Grade 1 is assigned to a normal vertebra without deformity, grade 2 to a biconcave vertebra, and grade 4 to an end plate fracture or a wedged or crushed vertebra. The sum of all grades of the vertebrae T7 to L4 is the radiological vertebral index (RVI). This approach is limited since it considers only the type of the vertebral deformity (i.e., biconcavity versus fracture), without assessing fracture severity. For prevalent fractures, each fracture, whether it is diminutive or severe, would have the same weight in the RVI, and in follow-up examinations refractures of previous fractures may not be detected at all. With the distinction between biconcavity and fracture in this approach, the concept of “vertebral deformity” versus vertebral fracture was introduced. However, it did not expressly attempt to distinguish nonfracture deformities such as degenerative remodeling from actual fracture appearances. Kleerekoper and colleagues35 and Nielsen and colleagues36 modified Meunier’s radiological vertebral index and introduced the “vertebra deformity score” (VDS), by which each vertebra from T4 to L5 is assigned an individual score from 0 to 3 depending on the type of vertebral deformity. This grading scheme is based on the reduction of the anterior, middle, and posterior vertebral heights, Ha, Hm, and Hp, respectively (Fig. 5–5). A vertebral deformity (to be graded 1 to 3) is present when any vertebral height, Ha, Hm, or Hp, is reduced by at least 4 mm or 15%. A vertebral deformity score of 0 is assigned to a normal vertebra with no reduction in vertebral height. A VDS 1 deformity corresponds to a vertebral end plate deformity with the heights Ha and Hp being normal. A wedge deformity with a reduction of Ha and, to a lesser extent Hm, is assigned a VDS of 2. A compression deformity, which is assigned a VDS of 3, is characterized by a reduction of all vertebral heights, Ha, Hm, and Hp. Grading all vertebrae T4 to L5 using this score, the minimum VDS for the whole spine would be zero when all the vertebrae are intact and the maximum score would be 42 when all the vertebrae are fractured. The vertebral deformity score still relies on the type of deformity (i.e., the vertebral shape), and changes in the vertebral shape would be required to account for incident vertebral fractures on follow-up radiographs. A quantitative extension of the VDS with measurements of the vertebral heights has been proposed by Kleerekoper et al35 to account for the continuous character of vertebral fractures. This radiologist’s perspective on vertebral fracture diagnosis (i.e., considering the differential diagnosis as well as the severity of a fracture) is probably best reflected in the semiquantitative fracture assessment used by several investigators.25,37–39 The severity of a fracture is assessed solely by visual determination of the extent of the reduction in vertebral height and morphological change, and vertebral fractures are differentiated from nonfracture deformities. With this approach the type of deformity (wedge, biconcavity, or compression) is no longer linked to the grading of a fracture as with the other standardized visual approaches. Thoracic and lumbar vertebrae from T4 to L4 are graded (Fig. 5–6) on visual inspection and without direct vertebral measurement as normal (grade 0); mildly deformed (grade 1, approximately 20 to 25% reduction in anterior, middle, and/or posterior height and a reduction of 10 to 20% of the projected vertebral area); moderately deformed (grade 2, approximately 25 to 40% reduction in anterior, middle, and/or posterior height and a reduction of 20 to 40% of the projected vertebral area); and severely deformed (grade 3, approximately 40% or greater reduction in anterior, middle, and/or posterior height and in the projected vertebral area). FIGURE 5–5 Vertebral deformity scoring by measuring anterior, central, and posterior height reduction. From this semiquantitative assessment a spinal fracture index (SFI) can be calculated as the sum of all grades assigned to the vertebrae divided by the number of the evaluated vertebrae. In addition to height reductions, careful attention is given to alterations in the shape and configuration of the vertebrae relative to adjacent vertebrae and the expected normal appearance. These features add a strong qualitative aspect to the interpretation and also render this method less readily definable. Several studies, however, have demonstrated that semiquantitative interpretation, after careful training and standardization, can produce results with excellent intra- and interobserver reproducibility within the same school of training.40,41 In a further effort to provide definable, reproducible, and objective methods to detect vertebral fractures and to accommodate the assessment of large numbers of radiographs by technicians (in the absence of radiologists or experienced clinicians), various quantitative morphometric approaches have been explored and employed. Early studies using direct measurements of vertebral dimensions on lateral radiographs were described by Fletcher42 in 1947, Barnett and Nordin43 in 1960, Hurxthal44 in 1968, Jensen and Tougaard45 in 1981, and Kleerekoper and coworkers35 in 1984, with the rationale being a reduction in the subjectivity considered intrinsic to the qualitative assessment of spinal radiographs. FIGURE 5–6 Genant’s grading scheme for a semiquantitative evaluation of vertebral fractures. The drawings illustrate normal to mild to severe fractures (top to bottom). The size of the reduction in the anterior, middle, or posterior height is reflected in a corresponding fracture grade from 1 (mild) to 3 (severe). (Drawing courtesy of Dr. C.Y. Wu.) Increasingly sophisticated morphometric approaches have been derived for the definition of vertebral dimensions. Most make 4 to 10 points on a vertebral body to define vertebral heights.46 Typically, Ha, Hm, and Hp are measured (Fig. 5–5), as is the projected vertebral area. Newer techniques are based on digitally captured conventional radiographs to assess the vertebral dimensions.47 They rely on either marking points manually to define vertebral heights or finding those points and measuring in an automated or semiautomated fashion. Hedlund and Gallagher48 used criteria such as percentage reduction of vertebral height, wedge angles, and areas in various combinations. Davies and coworkers49 employed two distinct morphometric cutoff thresholds for the detection of either vertebral compression or wedge fractures using vertebral height ratios that were defined by a radiologist’s assessment of vertebral deformities. Smith-Bindman and coworkers50 initially reported the use of vertebral level-specific reductions in anterior, middle, or posterior height ratios expressed as a percentage relative to normal data. Melton et al51 used this level-specific approach, and Eastell et al52 subsequently modified it by applying height ratio reductions in terms of standard deviations rather than percentages. With this approach, each vertebral level has its own specific mean and standard deviation. Minne and colleagues53 developed a method by which vertebral height measures are adjusted according to the height of T4 as a means of standardization, and the resulting values are compared to a normal population. Black et al54 derived a statistical method for establishing normative data from morphometric measures of vertebral heights based upon deletion of the tails of the Gaussian distribution of an unselected population. McCloskey and coworkers55 used vertebral height ratios and introduced an additional parameter, defined as a predicted posterior height, in addition to the measured posterior height. Ross and colleagues56 further refined morphometric criteria for fracture by utilizing height reductions in standard deviations based on the overall patient-specific vertebral dimensions combined with population based level-specific vertebral dimensions. Several comprehensive studies have compared the various methods or cutoff criteria in the same populations to examine the impact of methodology on estimates of vertebral fracture prevalence and on identification of individual patients or individual vertebrae with fractures. Studies by various groups found the expected trade-offs between sensitivity and specificity.50,57–59 Two- to fourfold differences in estimates of fracture prevalence and generally poor or modest kappa scores between the different algorithms for defining fractures were reported. Despite these sophisticated, describable, and objective methods, the application and interpretation of the results are complicated by the large differences observed from one technique to the next. Unfortunately, there is no gold standard for defining fractures by which the methods or their variable cutoff criteria could be judged. As a first approximation, there is some rationale for comparing visual assessment and morphometric data on a per vertebra basis to develop a consensus interpretation based on the expertise of experienced radiologists and highly trained research assistants.60 This may help to explain the concordant and discordant results and how best to utilize the strengths of the respective methods. When relying solely on quantitative morphometry one has to consider that no real distinction between osteoporotic fractures and other nonfracture deformities can be made. Besides the uncertainties introduced by vertebral projection, the specific technique being used, and intra- and interobserver precision of quantitative morphometry, this lack of distinction between fracture and nonfracture deformities may have a substantial impact on attempts to determine the prevalence, and to a lesser extent, the incidence of vertebral fractures in a population.
IMAGING AND BONE
DENSITOMETRY OF OSTEOPOROSIS
RADIOGRAPHIC TECHNIQUES
PHYSICAL AND TECHNICAL CONSIDERATIONS


GENERAL RADIOGRAPHIC FINDINGS
Changes in Trabecular Structure
Cortical Thinning
RADIOGRAPHIC ASSESSMENT OF TRABECULAR STRUCTURE
RADIOGRAMMETRY
RADIOGRAPHIC ASSESSMENT OF VERTEBRAL FRACTURE AND DEFORMITIES
Stay updated, free articles. Join our Telegram channel

Full access? Get Clinical Tree


