Growth can be thought of in terms of a journey, the curve in Figure 2.1 describes the distance traveled from birth to 18 years of age; from the figure you can see that a child’s height at any particular age is a reflection of how far that child has progressed towards the mature adult state. With data collected approximately every 6 months this clearly illustrates that growth is not a linear process. That is to say we do not gain the same amount of height during each calendar year. Figure 2.1 also illustrates the fact that between birth and 18 years of age the distance curve is made up of a number of different shaped curves with different slopes. Relatively rapid growth is observed in infancy, which gradually declines by 5 years of age, that is, the slope of the line decreases. This is followed by steady growth in childhood (between 5 and 10 years of age) and then rapid growth during adolescence (between 10 and 16 years of age). Finally, very slow growth is observed as the individual approaches an asymptote at 19 years of age. Although this distance curve shows the continuous rate of magnitude of change with age, in terms of our journey it only tells us where we are at any particular point in time. No information is provided as to how we reached this point; thus the distance point is largely dependent on how much the child has grown in all proceeding years.
What is more useful is a measure of growth that describes the speed of our journey at any one point in time. To get an idea of speed, the data has to be expressed in terms of a rate of growth (centimeter per year) (Figure 2.2). Velocity of growth is a better reflection of the child’s state at any particular time than the distance achieved.
Figure 2.2 The growth in height of de Montbeillard’s son (1759–1777): velocity curve (Redrawn from data of Scammon (1927).)
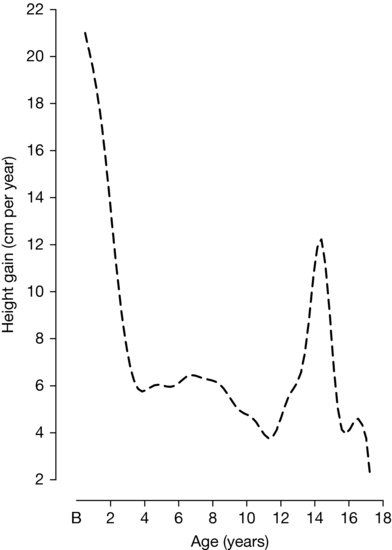
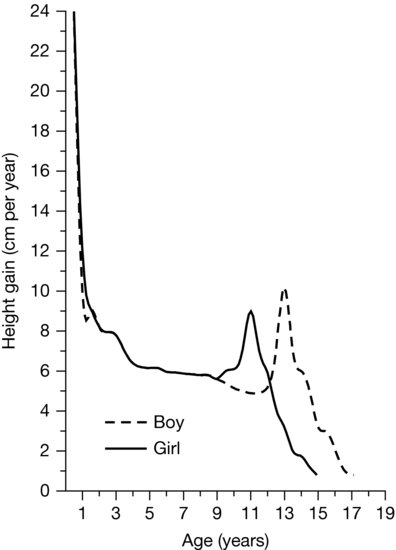
From the curve you can see that following birth two distinct increases in growth rates occur. The first of these is the juvenile or mid-growth spurt occurring between 6 and 8 years of age. The second, more dramatic, increase occurs between 11 and 18 years and is called the adolescent growth spurt. Whilst the juvenile growth spurt varies in magnitude between individuals, it occurs at roughly the same age both within and between sexes. The adolescent growth spurt, however, varies in both magnitude and timing within and between the sexes. Males enter their adolescent growth spurt, on average, almost 2 years later than females and have a slightly greater magnitude of height gain (Figure 2.3). This extra 2 years of growth prior to adolescence, in combination with a greater magnitude of growth during adolescence explains in part the increased final adult height and relatively longer legs observed in males. At the same time, other skeletal changes occur that result in gender difference in adulthood, such as wider shoulders in males and wider hips in females. Males also demonstrate rapid increases in muscle mass whilst females accumulate greater amounts of fat, thus as a result of natural biological development by the end of adolescence males are stronger.
Figure 2.3 Typical-individual height–velocity curves for boys and girls, representing the velocity of the typical boy and girls at any given instance. (Redrawn from data of Malina et al. (2004).)
Growth in stature
Stature is made up of sitting height (distance from the sitting surface to the top of the head) and leg length, or subischial length (distance between the hip joint to the floor). The exact landmark of the hip joint is sometimes hard to locate so leg length is most often calculated by subtracting sitting height from standing height. Stature varies during the course of the day, with greater readings in the morning that decrease throughout the day. Shrinkage during the day occurs because the intervertebral discs become compressed as a result of weight bearing, thus the diurnal variation may be as much as 1 cm or more.
During the first year of life, infants grow at a fast rate, approximately 25 cm per year, in fact during the first 6 months of life the velocity may be even faster, around 30 cm per year (Figure 2.3). During the second year of life there is growth of another 12–13 cm in stature. This accelerated growth means that by 2 years of age boys have attained approximately 50% of their adult stature. Girls are always closer to their mature status, even at birth, than boys and reach 50% of their final adult stature by 18 months of age. From then on there is a steady deceleration in growth, dropping to a rate of about 5–6 cm per year before the initiation of the adolescent growth spurt. Between 6.5 and 8.5 years, there is a small but distinct increase in growth rate, known as the juvenile or mid-growth spurt. During adolescence the maximum velocity of growth is known as peak height velocity (PHV). Girls, on average, attain PHV approximately 2 years earlier than boys with their onset of PHV occurring between 8.2 and 10.3 years (Figure 2.4). On average PHV is reached between 11.3 and 12.2 years. Corresponding ages for boys are 10.0–12.1 years and 13.3–14.4 years. By PHV individuals have attained 92% of their adult height.
Figure 2.4 Typical-individual distance curves for boys and girls (Redrawn from data of Malina et al. (2004).)
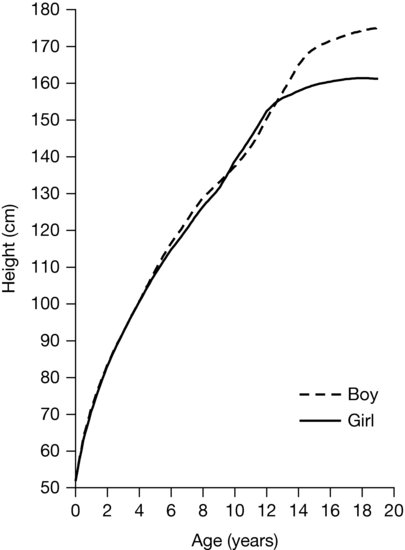
Upon reaching final adult height males are on average 13 cm taller than females, however up until the initiation of PHV the sex differences in height are small (Figure 2.4). Therefore, boys achieve their height advantage during the adolescent period. Specifically, boys on average experience about 2 years more preadolescent growth, approximately 5 cm per year, than girls. This is roughly 10 cm of growth that girls do not experience. Boys also achieve a slightly greater (on average 2 cm) magnitude of height at PHV. Both of these growth differences cause males, on average, to have a greater adult stature. Girls stop growing in stature by about 16 years of age and boys by about 18 or 19 years of age. However, these ages may be spuriously young as many growth studies stop measuring youth at 17 or 18 years of age, and it is known that many youth, especially males, continue to grow into their early to mid 20s.
These curves of growth in height reflect the growth patterns found in all healthy children who live in a normal environment. As mentioned, individuals will differ in absolute height of growth velocity (i.e., adult heights) and in the timing of the adolescent growth spurt; however, to reach their destined final height each individual will go through a similar pattern of human growth.
Patterns of growth
Statural growth, as demonstrated in Figure 2.4, shows only one of several patterns of growth found within the human body. Different parts of the body grow at different rates and different times. It has been proposed that all tissues and systems follow four patterns of growth: (i) neurological (e.g., brain and head), (ii) reproductive (e.g., reproductive organs), (iii) lymphoid (e.g., lymph glands, tonsils, and appendix) and (iv) general (e.g., stature and heart size). Brain and head growth (neural tissue) exhibits the most rapid early growth. At birth a child’s head is roughly half its adult size. From birth there is steady growth up until 7 years of age; by 8 years of age neural tissue growth is almost complete. In contrast, reproductive tissue does not really start to increase in size until 12 to 14 years of age. The reproductive curve includes primary sex characteristics (e.g., uterus, vagina and fallopian tubes in females; prostate and seminal vesicles in males) and secondary sex characteristics (e.g., breasts in females, facial hair in males, and axillary and pubic hair in both sexes). The reproductive curve shows some growth during infancy followed by reduced growth during childhood; by 10 to 12 years of age reproductive organs are only 10% of their adult size. During adolescence (puberty) there is a rapid growth in genital tissues. The general curve of growth includes many tissues and systems in the body, such as skeletal tissue, the respiratory system, and the digestive system. As illustrated by the shape of stature shown in Figure 2.4, the general curve follows a sigmoid curve of growth and reflects a rapid growth during infancy and early childhood, steady growth during mid-childhood, and rapid growth during early adolescence.
Development of shape
In contrast to changes in size, which just show a child’s progression in terms of a percentage of adult status, the concept of change in shape reflects the changes in proportionality of body segments from infancy to adulthood. As already indicated, there is a twofold increase in head size from birth to maturity; however, other segments show different patterns. The trunk increases threefold, the arms fourfold and the legs at maturity are five times their length at birth. These changes illustrate that there is a head–trunk–legs gradient. In early fetal growth the head is fastest growing, in infancy trunk growth accelerates, and in childhood leg growth accelerates. Other gradients of growth are also observed; within the limbs, during childhood and adolescence, growth occurs distal to proximal. For example, the hand and feet experience accelerated growth first, followed by the calf and the forearm, the hips and the chest, and lastly the shoulders. Thus, during childhood there may be a period where children appear to have large hands and feet in relation to the rest of their body. However, once the adolescent growth spurt has ended, hands and feet are a little smaller in proportion to arms, legs, and stature. Most body dimensions, with the exception of subcutaneous adipose tissue and the dimensions of the head and face, follow a growth pattern similar to that of stature; however, there are wide variations in the timing of growth spurts. From childhood to adolescence, the lower extremities (legs) grow faster than the upper body (trunk). This results in sitting height contributing less to stature as age progresses. During the adolescent growth spurt the legs experience a growth spurt earlier than the trunk. Thus, for a period during early adolescence a youth will have relatively long legs, but the appearance of long-leggedness disappears with the later increase in trunk length. Sex differences in leg length and sitting height are small during childhood. For a short time during the early part of adolescence, girls, on average, have a slightly longer leg length than boys, due to girls experiencing adolescence on average 2 years earlier. By about 12 years of age boys’ leg length exceeds girls, but boys do not catch up in sitting height until about 14 years of age. The longer period of preadolescent growth in boys is largely responsible for the fact that men’s legs are longer than women’s in relation to trunk length.
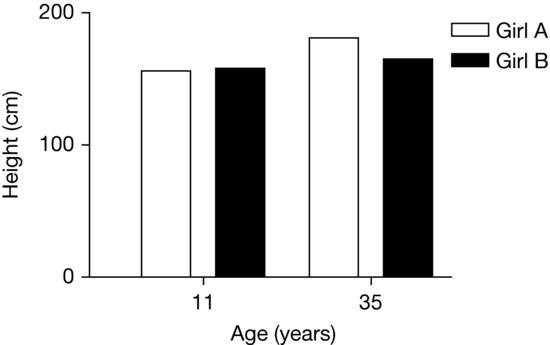
Biological maturity
As indicated previously, there is wide variation amongst children both within and between genders as to the exact timing and tempo of maturation. Therefore, to adequately distinguish the effects of physical activity or exercise on a group of children, biological maturity needs to be controlled. When considering how to assess biological maturation it is first important to understand that 1 year of chronological time does not equal 1 year of maturational time. Whilst every individual passes through the same stages of maturity they do so at differing rates, resulting in children of the same chronological age differing in their degree of maturity; this is reflected in Figure 2.5. The graphs illustrate the growth of two girls (A and B), both 11 years of age; however, what is not apparent is the fact that they differ considerably in their degree of maturity. At 11 years of age they are similar in height (girl A is 156 cm; girl B 158 cm); however, the second bars reflect the same individuals at 35 years of age and indicate that adult heights are significantly different (girl A is 181 cm; girl B is 165 cm). It is therefore apparent that at 11 years of age girl B is very close to her final adult height, 7 cm of growth remaining, and thus close to full maturity. In contrast, at 11 years of age girl A still had 25 cm of growth to go and thus was less mature at 11 years of age. This illustrates the point that the size of an individual is not an accurate indicator of maturity. Certainly, in very general terms, size is associated with maturity, in that a bigger individual is likely to be chronologically older and thus be more mature than a smaller individual. However, it is well recognized that size does not play a part in the assessment of maturity.
Figure 2.5 Two girls measured at the same chronological ages (11 and 35 years). At 11 years of age, girl A has 25.2 cm of growth in stature remaining and girl B 6.5 cm of statural growth remaining. (Data taken from two individuals who participated in the Saskatchewan Growth and Development Study (1964–1998).)