Femoral Dysplasia
Simon D. Steppacher
Helen Anwander
Joseph M. Schwab
Klaus A. Siebenrock
Moritz Tannast
Introduction
Unlike acetabular dysplasia, femoral dysplasia does not describe a well-defined entity of the hip. Rather, it comprises various pathomorphologic features of the proximal femur, which can occur as isolated deformities at any anatomical level or as part of other diseases or syndromes of the hip. In this chapter, we describe the normal anatomy of the proximal femur and relevant radiographic parameters (Fig. 36.1 and Table 36.1), known isolated deformities of different anatomic regions of the proximal femur, as well as deformities occurring as part of syndromes or specific pediatric hip diseases. Specifically, this chapter comprises novel information that is relevant both in the field of joint preserving hip surgery and total hip arthroplasty (THA).
Normal Anatomy of the Hip
Fovea Capitis Femoris
The fovea capitis femoris represents the insertion of the round ligament onto the femoral head. It is typically located
slightly inferior and posterior to the femoral neck axis (15) (Fig. 36.2). The location of the fovea can be considered as the counterpart to the inclined and anteverted acetabular fossa. This anatomical configuration allows motion of the femur with the round ligament staying more or less centered in the acetabular fossa (Fig. 36.2). Typically in a normal hip, the femoral neck axis in the axial plane projects into the fovea capitis femoris (Fig. 36.2). In a normal hip in neutral orientation, the fovea capitis femoris is not directly in contact with the weight-bearing area. The fovea angle delta is defined as the angle between the cranial extension of the fovea capitis femoris and the medial portion of the sclerotic zone (acetabular sourcil). In a normal population this angle is 26 ± 10 degrees (2) (Figs. 36.1 and 36.3).
slightly inferior and posterior to the femoral neck axis (15) (Fig. 36.2). The location of the fovea can be considered as the counterpart to the inclined and anteverted acetabular fossa. This anatomical configuration allows motion of the femur with the round ligament staying more or less centered in the acetabular fossa (Fig. 36.2). Typically in a normal hip, the femoral neck axis in the axial plane projects into the fovea capitis femoris (Fig. 36.2). In a normal hip in neutral orientation, the fovea capitis femoris is not directly in contact with the weight-bearing area. The fovea angle delta is defined as the angle between the cranial extension of the fovea capitis femoris and the medial portion of the sclerotic zone (acetabular sourcil). In a normal population this angle is 26 ± 10 degrees (2) (Figs. 36.1 and 36.3).
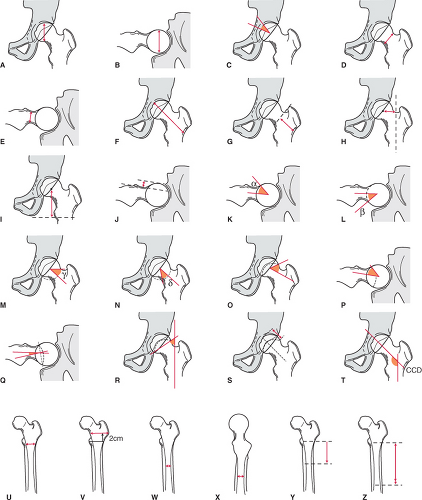 Figure 36.1. Schematic illustration of radiographic parameters of the proximal femur. See Table 36.1 for explanations. A, vertical diameter of the head; B, horizontal diameter of the head; C, fovea angle delta; D, vertical diameter of the neck; E, transverse diameter of the neck; F, neck axis length; G, greater trochanter–intertrochanteric line; H, femoral head–shaft offset; I, femoral head position; J, anterior femoral head–neck offset; K, alpha angle; L, beta angle; M, gamma angle; N, delta angle; O, anteroposterior (AP) physeal angle; P, axial physeal angle; Q, epiphyseal tilt angle; R, physeal–shaft angle; S, physeal extension; T, centrum-collum diaphyseal (CCD) angle; U, canal width (height of lesser trochanter); V, canal width (2 cm proximal of lesser trochanter); W, isthmus width (mediolateral); X, isthmus with (anteroposterior); Y, proximal border of isthmus; Z, distal border of isthmus. |
Femoral Head
The femoral head is not perfectly spherical as is often proposed. More precisely, it can be described as “conchoid” (2) or “ellipsoid” (1,16). The sphericity is influenced by gender and ethnicity (1). The mean diameter of the femoral head is larger in men (1). Asians typically present with a more spherical configuration of the femoral head in contrast to Caucasians (16). Geometrically, three different radiuses can be defined: the meridian radius, rM, the vertical radius, rV, and the horizontal radius, rH (Fig. 36.4). The meridian radius of the femoral head rM is increased compared to the equatorial radius by an average of 1.7 mm (16,17). Based on an anatomical study involving more than 200 specimens, the vertical radius rV of the femoral head was proven to be typically increased compared to the horizontal radius rH (Fig. 36.4).
This effect is more pronounced in men where the mean difference of the two radius is approximately 0.45 mm (1). The femoral head is not perfectly centered relative to the femoral neck axis. Its true position is slightly anterior and inferior to the neck axis (Fig. 36.4) (6).
This effect is more pronounced in men where the mean difference of the two radius is approximately 0.45 mm (1). The femoral head is not perfectly centered relative to the femoral neck axis. Its true position is slightly anterior and inferior to the neck axis (Fig. 36.4) (6).
 Figure 36.2. Location of the fovea capitis femoris. The projection of the femoral neck axis (dashed line) typically intersects with the fovea capitis femoris. A, B: As a counterpart of the inclined and anteverted acetabular fossa, the fovea is located somewhat inferior and posterior to the femoral neck axis. C, D: The normal anatomic morphology allows the round ligament to stay centered in the acetabular fossa even in motion, for example, in adduction or external rotation. Adapted from Kapandji IA. Funtionelle Anatomie der Gelenke. Schematisierte und kommentierte Zeichnungen zur menschlichen Biomechanik. Stuttgart: Georg Thieme Verlag; 2006. |
Table 36.1 Normal Radiographic Parameters of the Proximal Femur Summarized from the Most Recent Literature (see Figure 36.1 for Illustration) | ||||||||||||||||||||||||||||||||||||||||||||||||||||||||||||||||||||||||||||||||||||||||||||||||||||||||||||||||
|---|---|---|---|---|---|---|---|---|---|---|---|---|---|---|---|---|---|---|---|---|---|---|---|---|---|---|---|---|---|---|---|---|---|---|---|---|---|---|---|---|---|---|---|---|---|---|---|---|---|---|---|---|---|---|---|---|---|---|---|---|---|---|---|---|---|---|---|---|---|---|---|---|---|---|---|---|---|---|---|---|---|---|---|---|---|---|---|---|---|---|---|---|---|---|---|---|---|---|---|---|---|---|---|---|---|---|---|---|---|---|---|---|
|
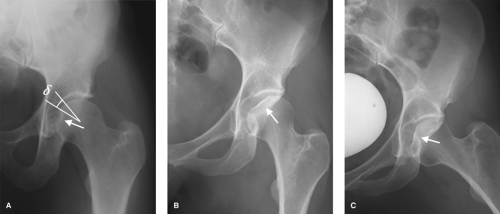 Figure 36.3. A: In a normal hip, the fovea capitis femoris (arrow) typically is outside the weight-bearing area. The fovea angle delta between the cranial extension of the fovea capitis femoris and the beginning of the sclerotic zone in a normal population is 26 ± 10 degrees (2). B: The fovea capitis femoris in a dysplastic hip with high neck valgus often reaches into the lunate surface thereby further decreasing the already diminished contact area between the dysplastic acetabulum and the femur. This “fovea alta” is characterized by a decreased angle delta of -11 ± 10 degrees (2). C: The fovea capitis femoris can be rotated out of the weight-bearing zone by abduction. |
 Figure 36.4. The femoral head is not a perfect sphere. Three diameters can be defined: the meridian rM, vertical rV, and horizontal diameter rH. The typical relationship among these diameters is rM > rV > rH. |
Femoral Epiphysis
The morphology of the proximal femoral epiphysis has gained more attention in the past decade since epiphyseal growth disturbances are responsible for deformities of the femoral head–neck junction. In a normal adult femur, the epiphysis should not cross the spherical contour of the femoral head (Fig. 36.5). The vertical orientation of the epiphysis
relative to the femur shaft is approximately 50 to 63 degrees (10,11). The orientation of the epiphysis can be quantified by the physeal angle (Fig. 36.1) (6). This angle is defined by the femoral neck axis, its intersection point with the epiphyseal scar, and the peripheral extension point of the epiphysis (6). The superior and the lateral physeal angle typically are less than 90 degrees indicating that the epiphysis is substantially anteverted and abducted (Fig. 36.5) (6). The physeal extension is defined as the relative extension of the epiphysis to the diameter of the femoral head (Fig. 36.1) (12).
relative to the femur shaft is approximately 50 to 63 degrees (10,11). The orientation of the epiphysis can be quantified by the physeal angle (Fig. 36.1) (6). This angle is defined by the femoral neck axis, its intersection point with the epiphyseal scar, and the peripheral extension point of the epiphysis (6). The superior and the lateral physeal angle typically are less than 90 degrees indicating that the epiphysis is substantially anteverted and abducted (Fig. 36.5) (6). The physeal extension is defined as the relative extension of the epiphysis to the diameter of the femoral head (Fig. 36.1) (12).
 Figure 36.5. The femoral head is not perfectly centered on the femoral axis. A, B: The center of the head (C) is slightly inferior and anterior to the neck axis. The epiphysis is slightly abducted and anteverted. Reprinted from Toogood PA, Skalak A, Cooperman DR. Proximal femoral anatomy in the normal human population. Clin Orthop Relat Res. 2009;(467):876–885. |
Femoral Neck
The femoral neck typically has an elliptic cross section (Fig. 36.6). The vertical diameter is approximately 30% larger in comparison to the anteroposterior (AP) diameter (Fig. 36.1) (1). The angle between the largest diameter of the femoral neck relative to sagittal plane of the femur is approximately 21 ± 9 degrees (Fig. 36.6) (18).
The relationship between the femoral neck and the femoral shaft can be quantified by the neck shaft angle in the frontal plane and the femoral neck torsion in the axial plane. The neck shaft angle (also known as centrum collum diaphyseal [CCD] angle) is normally 129 to 135 degrees (Fig. 36.1) (6,17). Femoral neck antetorsion can be defined on three axial cutting planes at the level of the following anatomical landmarks: the femoral head center, the base of the femoral neck, and the posterior femoral condyles (Fig. 36.7) (13). The femoral neck is usually 15 to 20 degrees anteverted in relation to the posterior femoral condyles which depends on ethnicity and gender (13). Chinese have 7 degrees more antetorsion than Caucasians (17). Women have approximately 2 to 3 degrees more antetorsion (17).
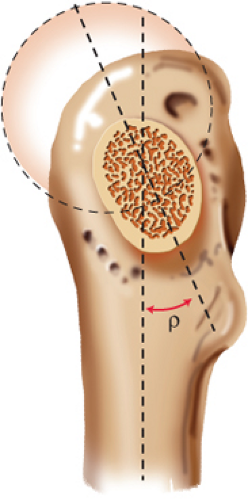 Figure 36.6. The femoral neck has an elliptical cross section. The angle rho between the largest diameter of the femoral neck relative to sagittal plane of the femur is approximately 21 ± 9 degrees. Reprinted from Meyer DC, Beck M, Ellis T, et al. Comparison of six radiographic projections to assess femoral head/neck asphericity. Clin Orthop Relat Res. 2006;(445):181–185. |
 Figure 36.7. Calculation of femoral antetorsion using a CT scan according to Murphy et al. (13). A: Three planes are used for calculation: one through the center of the head (H), one through the base of the femoral neck just cranial of the lesser trochanter (centroid C), and one through the distal femur at the height of the femoral condyles (condylar axis of the knee; K). B: By superimposing these three planes the femoral antetorsion is measured as the angle between a line connecting the center of the femoral head (H) and the centroid (C) and the condylar axis of the knee (K). |
The mean length of the femoral neck axis from the outer rim of the greater trochanter to the medial margin of the femoral head is usually approximately 93 mm (3) (Fig. 36.1), from the conjunction with the shaft axis to the femoral head center 49 mm (3) (Fig. 36.1). The femoral neck length increases with age by an average of 1% every 10 years (19). Male gender, increasing CCD angle, and femoral head diameter coincide with an increasing femoral head diameter–neck length ratio (19).
The mean horizontal distance (a measure for the lateral offset of the femur) between the center of the head and the shaft axis is around 43 mm (Fig. 36.1), and the mean vertical distance is 52 mm (Fig. 36.1) (4).
The femoral head–neck junction can be characterized by its sphericity and waist. Sphericity is best assessed with the angle between the femoral neck axis and a line connecting the center of the femoral head with the point where asphericity begins (6,7). The alpha (beta) angle describes the anterior (posterior) sphericity as seen in a lateral view of the proximal femur (Fig. 36.1) (6,7,8). The gamma (delta) angle describes the cranial (caudal) sphericity angle in the frontal plane (Fig. 36.1 and Table 36.1). Similarly to the four sphericity angles, the waist of the femoral head–neck junction is characterized by the femoral offset. Unlike the lateral femoral offset used for quantification of lateralization of the femur in THA (20), the femoral offset is described as the perpendicular distance between two parallel lines to the femoral neck: one tangential to the convexity of the femoral head and one to the concavity of the femoral neck (6) (Fig. 36.1).
Cartilage
On a nonarthritic femur, the cartilage thickness ranges from 0.80 mm to 2.83 mm (Fig. 36.8). The cartilage is thickest in the area just above the fovea (2.83 mm) and medial of the femoral head (2.28 mm). The thinnest cartilage is found anterior (0.95 mm), posterior (0.87 mm), and lateral (0.8 mm) (21).
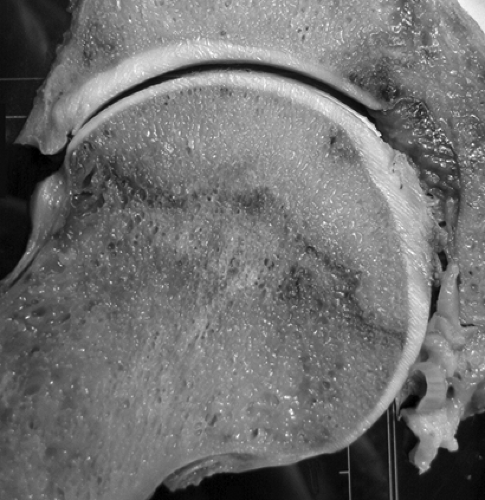 Figure 36.8. Cartilage thickness increases from the periphery to the center of the femoral head. Reprinted from Wyler A, Bousson V, Bergot C, et al. Hyaline cartilage thickness in radiographically normal cadaveric hips: Comparison of spiral CT arthrographic and macroscopic measurements. Radiology. 2007;242:441–449. |
Canal
The proximal femoral shaft canal has an elliptic cross section. The AP diameter of the canal is typically larger than the mediolateral diameter (4) (Fig. 36.1). The isthmus is defined as the narrowest part of the osseous canal and begins usually approximately 8.6 cm distal of the lesser trochanter and has a mean length of 5.9 cm (Fig. 36.1) (4). The ratio of the canal diameter 2 cm above the lesser trochanter to the diameter in the isthmus is known as the canal flare index (CFI). It classifies the canal as normal (ratio 3 to 4.7), stovepipe (ratio under 3), or champagne-flute (ratio over 4.7)-shaped (22,23) (Figs. 36.9 and 36.10). The CFI differs among ethnicities. Asians have, on average, a more champagne-flute morphology (33%) and the mean CFI is 4.5, significantly higher than in Caucasians (mean CFI 3.6) (24). The shape of the proximal femoral canal has implications for the choice of an appropriate femoral stem in THA and influences the pattern of cortical hypertrophy after THA. Cortical hypertrophy is more often seen in “champagne-flute” femora, whereas endosteal spot welding, rather than cortical hypertrophy, occurs in “stovepipe” femora (25).
Imaging of Femur
The imaging of the dysplastic femur is fairly straightforward, and includes conventional radiographs with functional views, computed tomography (CT), and/or magnetic resonance imaging.
Conventional Radiography
Conventional radiographs provide a fast and inexpensive overview to detect the major deformities of the proximal femur. The basic radiographic examinations are an AP pelvic radiograph along with one lateral projection of the proximal femur. An AP radiograph of the hip alone often is not sufficient. Imaging of the contralateral hip is important for comparison and can offer important features when making a diagnosis and formulating a treatment plan. Functional radiographs might be helpful to judge joint congruence to
plan a corrective osteotomy of the proximal femur and/or the acetabulum.
plan a corrective osteotomy of the proximal femur and/or the acetabulum.
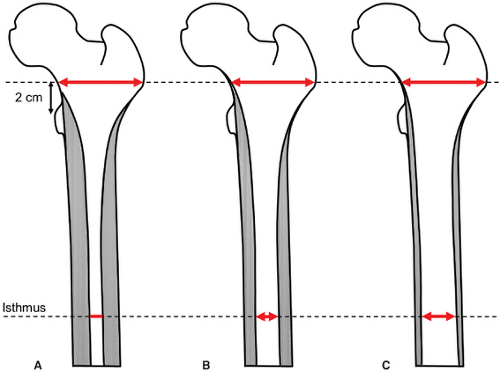 Figure 36.9. The ratio of the diameter of the intramedullary femoral canal 2 cm above the lesser trochanter to the diameter of the isthmus is known as the canal flare index (CFI). Depending on the CFI, the femoral canal is classified as (A) champagne-flute (CFI > 4.7), (B) normal (CFI 3 to 4.7), (C) or stovepipe (CFI < 3)-shaped (See also Fig. 36.10) (22,23). |
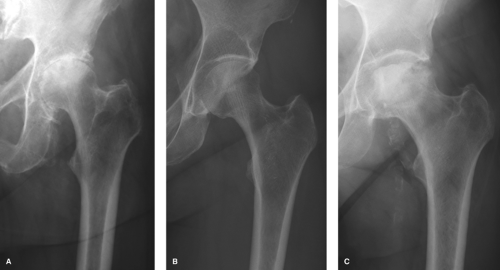 Figure 36.10. Depending on the canal flare index (CFI) the intramedullary femoral canal is classified as (A) champagne-flute, (B) normal, and (C) stovepipe (see also Fig. 36.9). |
Computed Tomography
CT is not necessary in all cases with proximal femoral deformities. Rather, it can be used as an adjunct for better three-dimensional characterization of the pathomorphology. CT imaging is most useful in the detection and quantification of torsional abnormalities of the femur. Three-dimensional models can be used for virtual animation of the hip joint to assess the range of motion more accurately with detection of intra- and extra-articular impingement zones (26).
Magnetic Resonance Imaging
Magnetic resonance imaging offers valuable information on any degeneration of the joint, the anatomy of the head–neck junction, and additional periarticular soft-tissue alterations. MRI with intra-articular gadolinium contrast agent is useful to detect labral tears and associated cartilage degeneration. Novel biochemical MRI techniques focus on more accurate quantification of the cartilage damage before classic signs of osteoarthritis are present on conventional radiographs.
Pathomorphologies of the Proximal Femur According to the Anatomical Location
Proximal femoral deformities can be classified by the anatomical location and subclassified by geometry and etiology (27) (Table 36.2).
Deformities of the Femoral Head and the Head–Neck Junction
Deformities of the femoral head and head–neck junction typically comprise deviations from normal sphericity. Asphericity of the femoral head–neck junction can lead to cam-type femoroacetabular impingement and early osteoarthritis (28,29,30). Depending on the location of the asphericity,
the alpha, beta, gamma, or delta angle can be increased (Table 36.1). The waist of the femoral head–neck junction is flattened, which decreases the head–neck offset. Various etiologies can lead to asphericity of the femoral head. The most commonly found problem is an activity-induced extension of the femoral epiphysis (12) (Fig. 36.11), followed by (subclinical) slipped capital femoral epiphysis (SCFE) (Fig. 36.11), Legg–Calvé–Perthes diseases (LCPD), posttraumatic deformities, or femoral retrotorsion (30).
the alpha, beta, gamma, or delta angle can be increased (Table 36.1). The waist of the femoral head–neck junction is flattened, which decreases the head–neck offset. Various etiologies can lead to asphericity of the femoral head. The most commonly found problem is an activity-induced extension of the femoral epiphysis (12) (Fig. 36.11), followed by (subclinical) slipped capital femoral epiphysis (SCFE) (Fig. 36.11), Legg–Calvé–Perthes diseases (LCPD), posttraumatic deformities, or femoral retrotorsion (30).
Table 36.2 Classification of Proximal Femoral Deformities According to Berry (27) | ||||||||||||||||||||||||||||
|---|---|---|---|---|---|---|---|---|---|---|---|---|---|---|---|---|---|---|---|---|---|---|---|---|---|---|---|---|
| ||||||||||||||||||||||||||||
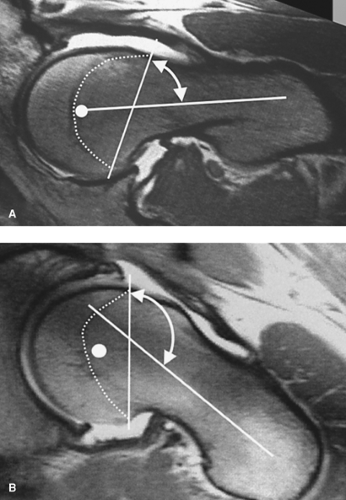 Figure 36.11. Representative radial cuts of a hip magnetic resonance arthrography of the two most commonly seen cam-type deformities are shown. Both present with an asphericity in the anterosuperior femoral head–neck junction and a lack of head–neck offset. However, the underlying pathomechanism is different. A: Activity-induced epiphyseal extension in the anterosuperior portion of the femoral head–neck junction. The physeal tilt angle is low. B: Unrecognized slipped capital femoral epiphysis (SCFE) with a high physeal tilt angle. |
Deformities of the Greater Trochanter
Two clinically relevant deformities of the greater trochanter are known: the overhanging greater trochanter and the high-riding greater trochanter.
The overhanging greater trochanter can obscure the correct entry point for antegrade intramedullary femoral nails that need to be inserted at the piriformis fossa (31) (Fig. 36.12). When performing THA, it can make the access to the femoral canal difficult, which increases the risk for intraoperative trochanteric fractures and varus malposition of the femoral component (27).
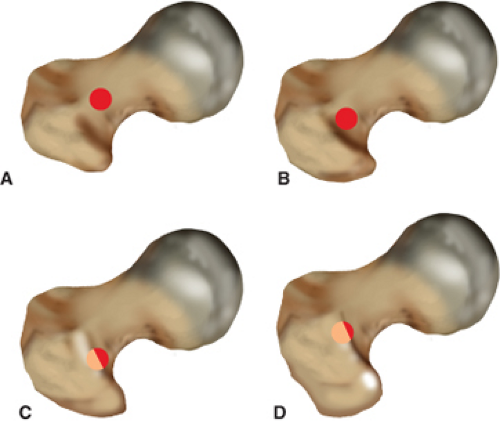 Figure 36.12. Morphologic variations of the greater trochanter and its implications for antegrade femoral nailing are shown according to Grechenig et al. (31). A: Group 1, the most common shape, free entry point (45% of cases). B: Group 2, the outline of the spine is projected laterally to the entry point (18% of cases). C: Group 3, the entry point is partially covered (12% of cases). D: Group 4, the entry point is completely covered (25% of cases). Reprinted from Grechenig W, Pichler W, Clement H, et al. Anatomy of the greater trochanter: clinical importance for intramedullary femoral nailing. Anatomic study of 100 cadaver specimens. Acta Orthop. 2006;77:899–901. |
The high-riding greater trochanter is often seen in hips with LCPD (Fig. 36.13) or with severe acetabular protrusio (Fig. 36.14). Radiographically, the tip of the greater trochanter is cranial to the center of the femoral head. Patients typically present with abductor weakness and/or potential extra-articular impingement between the greater trochanter and the ilium (32). Whenever joint preserving surgery is considered, the treatment consists of a trochanteric advancement and relative lengthening of the femoral neck (Fig. 36.13). If joint replacement is necessary, trochanteric osteotomy is helpful to guarantee unimpeded access to the femoral canal and/or correction of the trochanteric position (27).
Deformities of the Lesser Trochanter
Morphologic variations of the lesser trochanter itself are unknown and relevant clinical problems are rarely reported in literature. Functional problems occur when the lateral offset of the proximal femur is decreased, for example, in hips with LCPD (32,33) or in hips with excessive valgus and femoral antetorsion (34). This results in a narrow ischiofemoral distance, which predisposes the hip to ischiofemoral extra-articular impingement in extension and external rotation (35). Depending on the underlying pathology, treatment consists of an osteotomy with advancement of the lesser trochanter (Fig. 36.14) or a varus derotation osteotomy (Fig. 36.15).
 Figure 36.13. A, B: The radiographs of a 42-year-old patient with sequelae of Legg–Calvé–Perthes (LCPD) disease are shown. Typical morphology is shown with a mushroom-shaped femoral head and short neck resulting in intra-articular femoroacetabular impingement (FAI). The high-riding greater trochanter and the lesser trochanter are causes of extra-articular FAI. C, D: A surgical hip dislocation with trimming of the anterior head–neck area, advancement of the greater trochanter, and distalization of the greater and lesser trochanter was performed. E, F: Two-year follow-up after hardware removal. |
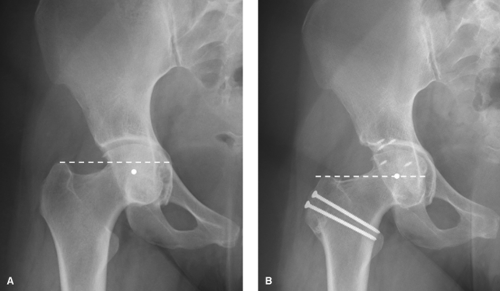 Figure 36.14. High riding trochanter in association with severe acetabular protrusion. A: The tip of the greater trochanter in this 34-year-old patient is cranial to the center of the femoral head. B: The patient underwent surgical hip dislocation with advancement of the greater trochanter, relative femoral neck lengthening, and circumferential acetabular rim trimming. Postoperatively, the tip of the greater trochanter is leveled with the femoral head center. |
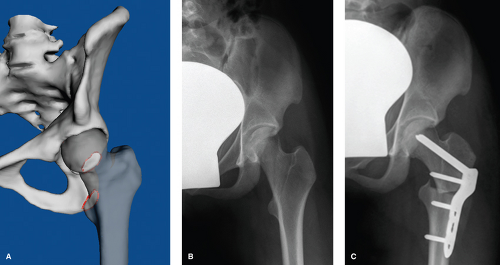 Figure 36.15. Extra-articular ischiofemoral impingement of the lesser trochanter is shown in a patient with an excessive valgus hip and high femoral antetorsion. A: Three-dimensional simulation of the impingement zones. B: Preoperative anteroposterior radiograph demonstrating the decreased ischiofemoral distance. C: Correction of the deformity with an intertrochanteric varus and derotation osteotomy. |
Torsional Deformities of the Proximal Femur
Torsional deformities of the femur refer to variations of femoral antetorsion. Both excessive antetorsion and retrotorsion of the femur can be a cause of hip pain (36). Functional problems with femoral maltorsion can be amplified by variations of the CCD angle. A high femoral antetorsion can lead to posterior extra-articular femoroacetabular impingement between the proximal femur and the ischium, particularly if combined with a valgus configuration of the femoral neck (CCD angle > 135 degrees) (34). Anterior instability of the hip might be present in the case of an additional excessive acetabular anteversion (36). The probability of anterior instability is high if the sum of the femoral and acetabular anteversion exceeds 60 degrees (the so-called McKibben Index) (37). Tönnis and Heinecke (36) defined a grading system wherein type 1 defines a normal femoral antetorsion (14 to 21 degrees). Excessive antetorsion was classified as type +2 (21 to 25 degrees), or type +3 (more than 25 degrees) (36). Increased femoral antetorsion typically leads to increased internal rotation and decreased external rotation of the hip (Fig. 36.16).
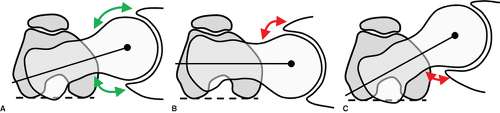 Figure 36.16. A: The normal morphology of the proximal femur (antetorsion of 15 to 20 degrees) combined with an anteverted acetabulum allows a physiologic range of motion (green arrows). B: A decreased femoral antetorsion or even retrotorsion leads to a decreased internal rotation (red arrows) with an anterior femoroacetabular impingement (FAI). This conflict can be amplified by an additional retroversion of the acetabulum. C: An increased femoral antetorsion leads to a decreased external rotation and a posterior FAI. This conflict can be aggravated by an excessive acetabular anteversion. |
Decreased femoral antetorsion or even retrotorsion typically can lead to anterior femoroacetabular impingement. This conflict can be amplified by an additional retroversion of the acetabulum. Decreased femoral antetorsion is classified as type -2 (10 to 14 degrees) or type -3 (<10 degrees). Decreased femoral antetorsion typically limits internal rotation of the hip (Fig. 36.16).
Angular Deformities of the Proximal Femur
Angular deformities of the proximal femur refer to deviations from a normal CCD angle (defined as 125 to 135 degrees) (14). Any combination of angular and torsional deformity can occur in concordance (36). A varus morphology is defined by a CCD angle of less than 125 degrees (36), a valgus morphology by a CCD angle of more than 135 degrees (37).
Diseases/Syndromes Associated with Femoral Dysplasia
Developmental Hip Dysplasia
Related posts:

Stay updated, free articles. Join our Telegram channel

Full access? Get Clinical Tree


