Cartilage Imaging
David Stelzeneder
Young-Jo Kim
Normal Cartilage Structure and Composition
MRI allows direct visualization of the soft tissue structures in the body. Furthermore, with the use of specific pulse sequences and contrast agents, it is possible to probe the ultrastructure of the tissues as well. It is akin to histology of the soft tissues using electromagnetic energy. Therefore, to understand MRI of cartilage it is helpful to understand basic cartilage histology. The spin relaxation during MRI is highly dependent on the histologic and biochemical structure of the tissue, and one should be aware that small changes in cartilage biochemistry can have effects on MR images.
Collagen, Proteoglycan Hydrogel
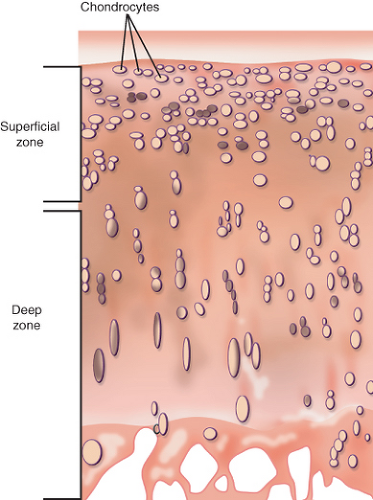
Articular cartilage is a highly organized tissue that is composed mainly of chondrocytes, collagen, proteoglycans, and water. Although chondrocytes maintain articular cartilage structure, their volume is comparably small in comparison to that of the surrounding extracellular matrix (ECM). They make up only 1% to 2% of cartilage tissue volume (1) (Fig. 13.1).
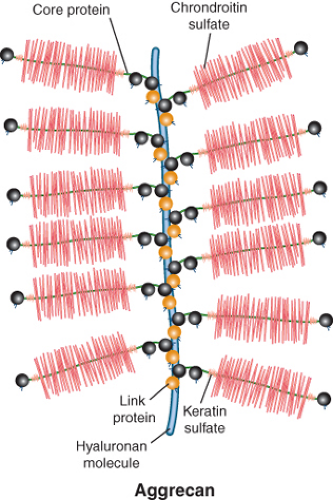
The main constituents of the ECM are the hydrated proteoglycan gel resisting compression and the collagen network providing tensile strength (2). Proteoglycans are made up of a core protein that is linked to numerous glycosaminoglycans (GAGs) such as chondroitin sulfate or keratan sulfate. The constructs of core proteins and GAGs are called aggrecans, which are interconnected via large hyaluronan polymers (itself also a carbohydrate structure) (Fig. 13.2). The negatively charged carboxyl and sulfate groups of GAGs create a strong fixed charge density (FCD). This negative FCD attracts positive mobile ions (mainly sodium, Na+) and as a consequence water because of the increased osmotic force. The high degree of hydration, as well as the electrostatic repulsion of the GAGs, results in a strong resistance to compressive loading and a good capability of shock absorbance (3,4). In damaged cartilage, proteoglycan loss is associated with tissue softening and decreased resistance to loading (5).
Several types of collagen are present in articular cartilage. The major collagen network is formed by collagen type II fibrils (6), but also collagen types III, VI, IX, X, XI, XII, and XIV are part of the ECM network (7). It is mainly collagen II which provides the tensile resistance of articular cartilage. It not only prevents major deformation of tissue during loading but also prevents volume expansion because of the swelling pressure generated by proteoglycans (8).
Laminar Structure of Collagen
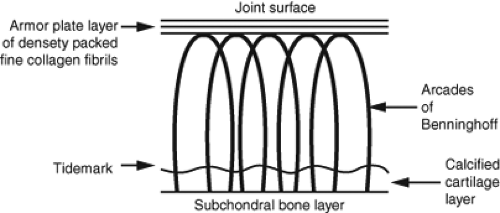
Articular cartilage has a distinct polarity with differences in tissue composition and organization from the deep zone to the superficial zone. The arcade model of collagen structure
was developed by Benninghoff in 1925 and is still valid to a high degree today. The basic observation of this model is the distinct orientation of collagen fibrils in different layers of cartilage. Whereas the collagen orientation is perpendicular to the subchondral bone in the deep zone, it is parallel to the cartilage surface in the superficial zone (9) (Fig. 13.3). Although the basic pattern of collagen orientation is similar in all joints, regional differences have been described for the knee (10). The horizontal alignment of fibrils in the superficial zone in combination with the lubricin layer is believed to be crucial for the low-friction gliding capability and resistance to shear stress of articular cartilage (11,12,13). In cases where the superficial layer of cartilage is damaged, deeper zones get exposed and friction increases. The focal disruption of the collagen network and subsequent abnormal biomechanical stress distribution can lead to extension of pre-existing cartilage lesions (11).
was developed by Benninghoff in 1925 and is still valid to a high degree today. The basic observation of this model is the distinct orientation of collagen fibrils in different layers of cartilage. Whereas the collagen orientation is perpendicular to the subchondral bone in the deep zone, it is parallel to the cartilage surface in the superficial zone (9) (Fig. 13.3). Although the basic pattern of collagen orientation is similar in all joints, regional differences have been described for the knee (10). The horizontal alignment of fibrils in the superficial zone in combination with the lubricin layer is believed to be crucial for the low-friction gliding capability and resistance to shear stress of articular cartilage (11,12,13). In cases where the superficial layer of cartilage is damaged, deeper zones get exposed and friction increases. The focal disruption of the collagen network and subsequent abnormal biomechanical stress distribution can lead to extension of pre-existing cartilage lesions (11).
Collagen fibril orientation is not only crucial for joint biomechanics but also relevant for cartilage imaging. The zonal organization of collagen in healthy and diseased cartilage is of particular importance for T2 sensitive MR imaging techniques.
Normal Distribution of Charge Density in Cartilage
Not only the collagen matrix, but also the proteoglycans are organized in a depth-dependent manner (11). A gradient of proteoglycan content and subsequently FCD exists, with high GAG concentration in the deep and intermediate layer and lower GAG concentration in the superficial cartilage layer (14).
Similar to collagen, the proteoglycan distribution pattern is dependent on the anatomic location within the joint. Areas of increased loading appear to have higher GAG concentration, than areas with little mechanical loading (14). This variation of GAG content with the depth from surface and the location within the joint, affects MRI techniques that are sensitive for ionic compounds within cartilage, that is, delayed gadolinium-enhanced MRI of cartilage (dGEMRIC), sodium imaging, and to some degree T1rho.
Early Cartilage Changes in Osteoarthritis
Characteristic changes in cartilage occur in early osteoarthritis. Cartilage is a living tissue, hence, there is normal turnover of its ECM components. In early disease, there is a biologic response by the tissue to heal itself; however, after some threshold the anabolic response fails and the tissue degrades. With standard radiographic assessment, we are often seeing the joint at the end stage of the disease process. However with MR imaging techniques, especially the biochemical imaging techniques, we are able to image the tissue prior to irreversible damage.
Cartilage metabolism in healthy tissue is characterized by an equilibrium of catabolism and anabolism of its components. Although collagen turnover is low in healthy cartilage, the turnover rate of proteoglycans is higher (15,16). The half-life of rabbit cartilage GAGs for example, has been described to be only 8 days (17). Cartilage damage happens when the metabolic equilibrium gets out of balance, and more degradation than formation of matrix components occurs.
More than half a century ago authors noted that the proteoglycan content decreases with progression of osteoarthritis (18,19,20). Whereas collagen content (but not structure) appears to be stable until a certain degree of cartilage damage, GAG loss occurs at the earliest stage of disease (8,21). This is indicated by an increased ratio of collagen/GAG with
degeneration. The loss of proteoglycans and subsequent reduction in swelling pressure is associated with reduced tissue stiffness. This loss in stiffness can make cartilage vulnerable for further damage during weight bearing. However, at this stage full recovery of tissue integrity is possible (22,23).
degeneration. The loss of proteoglycans and subsequent reduction in swelling pressure is associated with reduced tissue stiffness. This loss in stiffness can make cartilage vulnerable for further damage during weight bearing. However, at this stage full recovery of tissue integrity is possible (22,23).
Many injury studies have been performed on animal models like dogs or rabbits. However, the results are believed to be similar to human cartilage. Mankin delivered a comprehensive description of cartilage response to injury in 1974 (15,24). In contrast to other tissues there is no strong inflammatory response after cartilage injury. However, several types of reactions attempting to repair the tissue occur. Immediately after injury chondrocyte proliferation increases the number of cells along the borders of the defect. Within 1 to 2 days matrix synthesis reaches a maximum, but declines to normal levels after 1 week (15,25). The midterm fate of cartilage lesions depends on the size of the lesions. Smaller lesions seem to remain stable over time, with neither healing nor progression over the time period of 1 year (15,26). If lesions are too big or subject to constant stress a further deterioration of tissue damage can be the result.
In addition to proteoglycan loss, at some point there is an increase in water content and swelling of the articular cartilage. As Maroudas noted, this paradox is likely a result of disruption in the collagen network that allows unrestricted imbibition of water into cartilage tissue (8). At this point, it is unclear if the cartilage damage is reversible or not. Morphologic MRI scans looking at cartilage thickness and volume may suggest an intact tissue. However, biochemical imaging techniques should show a disruption of the collagen network and alteration in GAG concentration.
It is believed that the disruption of the collagen network by mechanical and enzymatic factors represents the point of no return for articular cartilage (15,27). Destruction of the collagen network is the crucial step, after which the tissue loss cannot be compensated by endogenous regenerative mechanisms. The resultant tissue loss causes cartilage defects that can progress up to osteoarthritis (13,27).
Semiquantitative MRI Scoring Systems for Osteoarthritis
The main advantage of MRI over radiography and CT is the soft tissue assessment. This makes it possible to not only assess bony structures, but also cartilage and associated soft tissue structures (28).
Since cartilage is the most crucial part for the physiologic function of a joint, cartilage MRI assessment is in the focus of many scoring systems. Several authors developed semiquantitative scoring systems focusing on cartilage damage (29,30,31). Besides cartilage many other structures in a joint can be affected in osteoarthritis. For this reason whole-organ scoring systems have been proposed.
One of the most widely used grading systems in clinical studies for knee OA is the Whole-Organ Magnetic Resonance Imaging Score (WORMS) system developed by Peterfy et al. (32). This system comprises the features of cartilage, bone marrow abnormality, bone cysts, bone attrition, osteophytes, menisci, ligaments, and synovitis, which are graded on spin echo (SE) and fast spin echo (FSE) MR images. Cartilage is graded from “normal” (0 points) to “diffuse (>75%) full thickness defect” (6 points). The other findings are graded in a similar way according to their severity. WORMS discriminates for the location of MRI findings by patellofemoral, femorotibial, anterior, central and posterior, as well as lateral and medial, and subspinous tibial. Finally, a total sum score and sum scores for each finding and compartment can be calculated (32). The interreader agreement for sum scores measured with the intraclass correlation coefficient (ICC) was good to excellent with values between 0.61 and 1 (32).
The Knee Osteoarthritis Scoring System (KOSS), developed by Kornaat et al., contains similar features as WORMS. The differences to WORMS are the inclusion of osteochondral defects, meniscal subluxation, and Baker cyst. Osteophytes are classified as marginal, intercondylar, or central. The ICC values for interobserver reproducibility were between 0.63 for osteochondral defects and 0.91 for bone marrow edema (33). Another major MRI scoring system for the knee is the Boston–Leeds Osteoarthritis Knee Score (BLOKS) which was developed by Hunter et al. (34). Similar to the WORMS the following features are graded on a point scale for different regions in the knee: Bone marrow lesions (BMLs), BML percentage area, percentage of BML rather than cysts, thickness of cartilage lesions, extent of cartilage lesions, osteophytes, synovitis, effusion, meniscal extrusion, meniscal signal, meniscus tear, ligaments, periarticular features. However, the focus in the development of BLOKS was on construct validity (association to knee pain) and longitudinal validity (prediction of future cartilage loss). In particular for the grading of BML the relation to the visual analogue pain score was demonstrated. The interobserver agreement was assessed with weighted kappa and was between 0.51 for meniscal extrusion and 0.79 for meniscus tear (34).
Until recently, semiquantitative MRI grading systems were mainly developed for the knee. In 2011 a comprehensive MR grading system for hip OA has been published by Roemer et al. (35). The so-called Hip Osteoarthritis MRI Scoring System (HOAMS) contains the features cartilage, BML, subchondral cysts, osteophytes, labrum, synovitis, effusion, loose bodies, attrition, dysplasia, greater trochanter tendonitis/bursitis, labral hypertrophy, paralabral cysts, and herniation pits. They reported the interobserver agreement and intraobserver agreement as percentage with 67% to 100% and 62% to 100%, respectively. The construct validity of this system has to be determined in future studies.
Quantification of Cartilage Thickness and Volume
Attempts have been made to develop and validate semiautomated (36,37,38,39) and fully automated (40,41,42) quantitative cartilage assessment methods, which focus mainly on cartilage thickness and volume on MRI. In particular fully automated cartilage assessment could potentially be adopted in clinical practice and are desired by clinicians and researchers. The comparison of semiautomated MRI cartilage volume estimation methods and the gold standard of water displacement show good agreement with variability of around 5% to 10% (39).
The advantage of semiautomatic and automatic cartilage assessment from 3D MRI datasets is the relative lack of observer variability. Even subtle changes in cartilage morphometry over time could be detected for use in clinical research and daily clinical practice (28). Disadvantages are the need of special software and trained personnel, able to segment cartilage areas (for semiautomatic methods). The software is also less sensitive to focal cartilage lesions than expert readers (28). Furthermore, in contrast to semiquantitative scoring systems, quantitative measures like cartilage thickness and volume, demonstrated only minor differences when comparing radiographic mild OA patients to healthy volunteers (43). This fact might be related to the large intra-individual physiologic variation in these parameters.
Most of these methods have been developed for the knee joint and data for the hip joint is scarce. Besides studies using manual cartilage evaluation (44,45,46), only two papers demonstrate automatic or semiautomatic segmentation of cartilage in the hip joint. Nishii et al. used a fully automatic algorithm but used a traction device to separate the articular surfaces of the acetabulum and femur. Their methodology allowed detailed description of the increased cartilage thickness found in dysplastic hips, which is pronounced in the superolateral areas (47). Furthermore, Li et al. (48) used a semiautomatic method to discriminate femoral and acetabular cartilage, in this case without the use of a traction device during MRI.
Continued development in the field of fully automatic hip joint cartilage segmentation is warranted and can be helpful not only for research purposes but also for daily clinical practice. Such automatic systems should not only be capable of segmenting cartilage in healthy hip joints, but also be able to detect cartilage tissue in patients with disease.
Current Biochemical Imaging Methods for Cartilage
All of these morphologic scoring systems for OA look at established disease. It is ideally suited to look for progression of disease. If we are to demonstrate efficacy of a treatment designed to reverse cartilage damage, we would need an imaging method that looks at cartilage damage before structural changes. Biochemical imaging methods such as T2, dGEMRIC, and T1rho may fulfill such a role.
T2
Biophysical Basis for T2 Imaging
T2 quantification in articular cartilage has been in the focus of numerous studies since Lehner et al. (49) demonstrated the variation of T2 across cartilage. The transverse relaxation time T2 (also called spin–spin relaxation time) is dependent on mobility and interaction of water molecules with each other and water molecules with the surrounding matrix molecules. Increased interaction with matrix molecules results in a decreased T2 (50). Increased tissue water content results in increased T2, by reducing molecular interaction (51). The movement of water molecules is relatively restricted in healthy cartilage.
Though T2 is also affected by collagen content (52


Stay updated, free articles. Join our Telegram channel

Full access? Get Clinical Tree


