X-Ray Analysis Validity
Roderic P. Rochester
Learning Objectives
After completing this chapter, students should be able to:
Describe the meaning of Validity.
Discuss the difference between Reliability and Validity.
Explain the different types of Validity.
List many of the concepts that provide the basis of the Orthospinology X-ray analysis.
Discuss the sources of errors that are inherent in the X-ray analysis, and explain their relevance or elimination.
Discuss the types and impact of various challenges to the Validity of the radiographic procedures.
Measure Image rotation.
List the outcome studies and their relationship to Validity.
The Orthospinology procedure is based on the Dr. John F. Grostic model of the upper cervical chiropractic Subluxation complex and dictates that a relative vertebral alignment deviation in the upper cervical spine may result in neurological dysfunction that is due to mechanical irritation, neural Hypoxia, and/or neurological reflexes. The Orthospinology X-ray analysis attempts to measure relative vertebral alignment in the upper cervical spine. The information from the X-ray analysis is used to determine how to deliver a vectored Adjustment, but not necessarily when to make an Adjustment. This chapter discusses the Validity of the Orthospinology X-ray analysis and the challenges incurred when using two-dimensional measurements of the three-dimensional spine.
Validity and Reliability
The idea that a clinical procedure is valid is sometimes difficult to understand. For a system to be valid, it must measure what it is attempting to measure and be reliable. Trial Validity of a measurement system demonstrates the ability to detect changes in the object of measurement that would be expected following an intervention. A method is reliable when it can be repeated multiple times while achieving equivalent results. Intraexaminer is assigned when the same person is using the method repetitively, and Interexaminer is used when comparing the outcomes of different people using the same process.
Reliability and Validity are not the same. For example, a baseball pitcher may be reliable and throw to the same spot every time, but if the spot he throws to is not in the strike zone, his pitches are not valid if his intention is to throw strikes. He demonstrates Reliability but not Validity in this example. If he tries to throw strikes and can throw pitches to the same location each time and the location is in the strike zone, he is considered an established or a valid pitcher.
A procedure is considered clinically valid or established when it demonstrates Validity and Reliability. The Orthospinology X-ray analysis for Atlas laterality is valid, for example, if the measurement magnitude represents the relative alignment of the atlas compared with the occiput. It is considered reliable if the results of multiple measurements are the same or very similar. If the same doctor determines Atlas laterality multiple times on the same X-ray and the results are equal or very similar, then the analysis for Atlas laterality shows Intraexaminer Reliability. Interexaminer Reliability is demonstrated when multiple doctors measure the same X-ray for Atlas laterality and get equivalent answers.
Predictive, Concurrent, and Discriminant Validity
A system that is valid will display different types of Validity. Any model is only as legitimate as its predictability, which is known as predictive Validity. Using the baseball pitcher example above, it can be predicted with a high degree of confidence that he can throw a strike when he desires because his pitches are reliable and valid; therefore, he demonstrates predictive Validity. Likewise, the Orthospinology concept might predict that following a chiropractic Adjustment, the Atlas laterality would be changed in the direction of intent, toward the Orthogonal alignment. Also, following the change in upper cervical alignment, outcome measures of Health, mobility, range of motion, and/or pain would improve. In addition, it may be that the percentage of correction of upper cervical alignment would predict the degree of improved outcome measures demonstrating predictive Validity.
Concurrent Validity occurs when two different methods show the same result and one of the methods is considered valid and reliable or a gold standard. For the baseball pitcher, it could be that his fast ball and his curve ball can be thrown for strikes at will. The problem within chiropractic is that there is no gold standard with which to compare a procedure in the detection of a vertebral Subluxation. The Orthospinology manual analysis for Atlas laterality and the computer-assisted X-ray analysis can demonstrate concurrent Validity if they agree and one method is considered reliable and valid. The X-ray analysis may agree with the Supine leg check, and the assessment is considered established.
A valid procedure will also display the ability to differentiate between groups that are different. This is known as discriminant Validity and might be demonstrated as the ability of the X-ray analysis to determine the difference between patients with or without functional leg length inequality, illness, or pain. It may predict which leg will be drawn short on the Supine leg check or even distinguish between those that will or will not have a good outcome. For the Orthospinology X-ray analysis to be accepted as established, it would have to demonstrate Reliability as well as trial, predictive, concurrent, and discriminant Validity. The only way to investigate these issues is through research that is published in indexed, peer-reviewed research journals.
X-ray Analysis Concepts
Theories are constructed to explain observations of a particular phenomenon using models. A model is built from concepts (Fig. 8-1). The objective researcher wants to pursue the truth and readily admits that what occurs in reality is not known; however, the concepts of a model or theory can be tested using the scientific process. This includes developing a testable Hypothesis, observing and testing the Hypothesis, and accepting, rejecting, or modifying the theory based on the results (Fig. 8-2). The Orthospinology X-ray analysis is composed of many concepts, including those listed here:
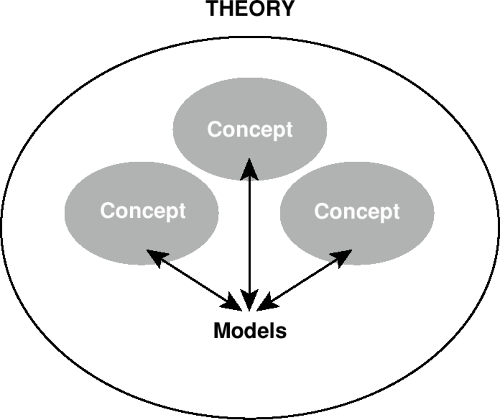 FIGURE 8-1 A model or theory is made from concepts. |
The atlas vertebra can slip right or left relative to the skull primarily in the coronal plane. This is defined by the axes of the atlas vertebra, in a path very near that of a sphere in three dimensions or a circle in two dimensions, around the occipital condyles, allowing measurement in degrees.
The atlas vertebra can rotate relative to the skull, primarily in the horizontal plane as defined by the atlas position.
The atlas can slip on the axis right or left, to a small degree, around the axial surfaces in a path very near that of a circle in two dimensions.
The position of the atlas as related to the skull, axis, and lower cervical spine can be measured from three X-ray views and represents relative alignment, but not exact positioning, in three-dimensional space compared with the three axes of the Cartesian coordinate system.
Measurements from these X-rays can be used to determine a vectored force that will change the relative upper cervical alignment toward the orthogonal position by using height and rotation factors.
Relative alignment change in the cervical spine can be detected before and after the chiropractic Adjustment by radiographic analysis.
The purpose of the X-ray analysis system is to allow a determination of the relative upper cervical alignment that removes the clinical signs of neurological dysfunction for the greatest period of time.
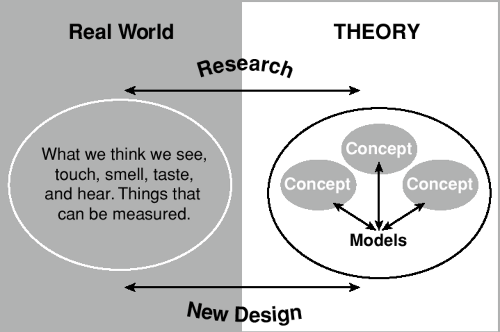 FIGURE 8-2 The method of using research to test Hypotheses is shown. |
Sources of Error Affecting Reliability and Validity
An investigation of the sources of error that may affect the X-ray analysis sheds light on the Validity of the system. The errors can be divided into two major categories: X-ray analysis and patient placement for the radiographs. Potential problems in the X-ray analysis would include the following errors: subjective analysis, measurement, addition of Height factors, recording mistakes, and/or point selection/marking errors. Subcategories for patient placement problems would be the patient relative to the film discrepancies and patient position relative to themselves or postural changes. The source of patient relative to the film errors would include Image rotation remaining on the nasium and the image being too high or low on the X-ray. Postural positioning errors would be represented by changes in posture on the pre- and/or postAdjustment radiographs, including head rotation, lateral flexion, and head translation compared with the thorax (Fig. 8-3).
Subjective analysis occurs when the chiropractor is not blinded as to which is the pre- and post-X-ray, and this may cause unintentional bias. The doctor wants the post–X-ray to demonstrate improvement, and the film analysis becomes like an Ouija board. An example of recording mistakes would be if the degrees were read from the protractor correctly but written down wrong. Addition errors would be if the doctor records everything correctly but makes a mistake in the arithmetic by forgetting to add the odontoid or spinous laterality measurement to the Atlas laterality before recording the number, or adding the Height factors incorrectly. These types of errors would affect both Reliability and Validity; however, they have been greatly reduced with the development of the computer-assisted X-ray analysis. Digitizing anatomical points and letting the computer do the calculations makes a significant improvement in objectivity and eliminates recording, measuring, and addition errors.
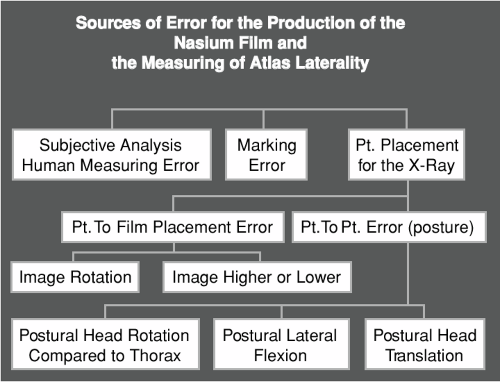 FIGURE 8-3 A flow chart that shows the potential sources of errors of measurement of patient positioning for the Nasium view. |
Marking errors occur in different ways but are primarily anatomical landmark selection discrepancies. It is known that point selection may vary for intra- or Interexaminer choices, and the magnitudes are studied through Reliability testing. Grostic and DeBoer1 published a study in 1982 demonstrating a mean deviation from 0° of “misalignment” being 2.75° and 2.63°, respectively, for rotation and Atlas laterality based on the means of 523 cases. After upper cervical Adjustments, the corresponding values were 1.43° and 1.40°, which is a statistically significant change. This represents an average change of 1.23° or 47% for Atlas laterality and 48% for rotation. They concluded that the Adjustment was responsible for the difference in measurements.
Sigler and Howe2 published a study in 1985 challenging the inter- and Intraexaminer Reliability of the upper cervical X-ray marking system. Their study demonstrated 41% to 71% Interexaminer error, which translates to between a 1.9- and 2.8° standard deviation of measurement of Atlas laterality at a 95% Confidence interval. Several studies refuted the findings of this study over the next 15 years and concluded good to excellent Reliability of the upper cervical X-ray analysis with 95% Confidence intervals and standard errors at 0.66 to 0.94°.3,4,5 One study demonstrated that 12 of 13 doctors tested in a blinded fashion, excluding the Sigler and Howe doctors, were able to detect a 1.23° change with 95% confidence.6 The Reliability of this type of
marking error has been tested using the scientific method multiple times and demonstrated good to very good Reliability for atlas, odontoid, spinous, lower-angle measurements, and the total Height factor. Fair to good Reliability was found for the rotation factor. Computer-assisted analysis using the DOC (digitized radiographic analysis for the Orthospinology practitioner in chiropractic) and the manual X-ray method arrived at equivalent measurements, and both were reliable. Indeed, there are multiple possible errors in the measurement system, although the total of these mistakes are not large enough to prevent Reliability. The Orthospinology X-ray analysis demonstrates good to very good Reliability (Fig. 8-4).
marking error has been tested using the scientific method multiple times and demonstrated good to very good Reliability for atlas, odontoid, spinous, lower-angle measurements, and the total Height factor. Fair to good Reliability was found for the rotation factor. Computer-assisted analysis using the DOC (digitized radiographic analysis for the Orthospinology practitioner in chiropractic) and the manual X-ray method arrived at equivalent measurements, and both were reliable. Indeed, there are multiple possible errors in the measurement system, although the total of these mistakes are not large enough to prevent Reliability. The Orthospinology X-ray analysis demonstrates good to very good Reliability (Fig. 8-4).
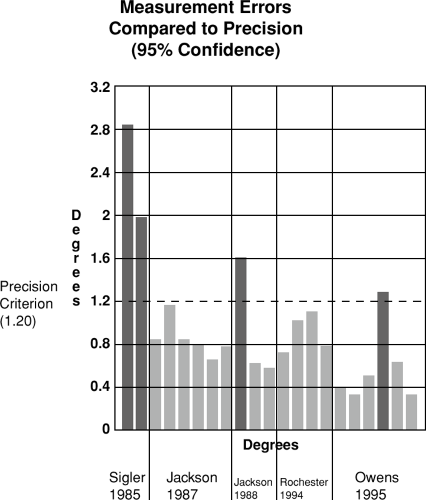 FIGURE 8-4 A chart showing blinded Reliability testing results of multiple doctors related to the precision criteria.18 |
Challenges to the Validity of the X-ray Analysis
Many challenges may affect the soundness of the measurements from X-rays. Because the spine exists in three dimensions and the radiograph is a two-dimensional representation of the shadow of the spine, much information is lost. To minimize distortion in the measurement process, parameters must be established to qualify the Validity. The system can be accepted as established only if it measures what it says that it measures.
Image Rotation
The first challenge to the Validity of the X-ray analysis is the result of Image rotation. Projection distortion of anatomical landmarks occurs when Image rotation is present on the nasium X-ray film. This will significantly distort Linear measurements between structures, but has a minimal impact on angular measurements with small degrees of Image rotation. The Orthospinology system uses angular measurements for this reason. However, the magnitudes of measurements can still be misrepresented even with the use of angular measurements (Fig. 8-5). The size of the discrepancies concerning laterality measurements are linked to the angle of the S-line, Chord angle (anterior head/atlas/odontoid translation compared with the thorax as seen on the lateral view), and skull shape (Fig. 8-6). Errors that result from this type of distortion can affect the central skull line, the Atlas plane line, the axis spinous rotation, and lower-angle measurements.
The higher the S-line and/or the more elongated the skull, the higher the potential for a larger error. These errors have been studied using a three-dimensional computer model and radiographs from a private practice.6 The study demonstrated that with small degrees of Image rotation, the misrepresentation of structural landmarks on the X-ray views are distorted proportionally, and the measurements recorded in degrees from the X-ray analysis are good representations of the model being used (Fig. 8-7). To this degree, the Orthospinology X-ray analysis shows some degree of Validity within limited parameters of Image rotation remaining on the film. The results of this study require that the parameters of Image rotation remaining on the Nasium view be set at 1° or less and 1° or less between the pre- and postimages. Twenty X-rays tested at random in a private practice during the study revealed the average Image rotation was 0.56° (Table 8-1). Grostic was well aware of these issues and recommended no more than a 3-millimeter difference between rotation measurements taken from the lateral canthus of the eye orbit to edge of the skull, bilaterally, which is approximately 1°. Table 8-2 demonstrates the calculation of the Orthospinology Image rotation method, and Figure 8-8 provides an example.
Related posts:

Stay updated, free articles. Join our Telegram channel

Full access? Get Clinical Tree


