Preop
Postop
p value
VAS pain
6.56
1.25
<0.001
ASES pain
19
44
<0.001
ASES function
20
34
<0.001
ASES total
40
79
<0.001
SF-36v2 PF
34
39
0.001
SF-36v2 RP
24
41
<0.001
SF-36v2 BP
35
47
<0.001
SF-36v2 GH
49
46
0.066
SF-36v2 PCS
34
42
<0.001
SF-36v2 VT
45
46
0.183
SF-36v2 SF
42
48
<0.001
SF36v2 RE
35
44
0.006
SF36v2 MH
44
49
0.001
SF36v2 MCS
46
49
0.149
OOSS
42
25
<0.001
Patient satisfaction
9
The average total 4-year cost of RSA for the patients in this study was $24,661 (standard deviation [SD] $2527; range $19,858–$31,909), and these costs were stratified into the various subgroups based on the timing and nature of the cost. Goods and services provided by the hospital cost an average $20,451 (SD $2569; range $15,783–$27,859), whereas goods and services not provided by the hospital cost $4209 (SD $169; range $3705–$4562).
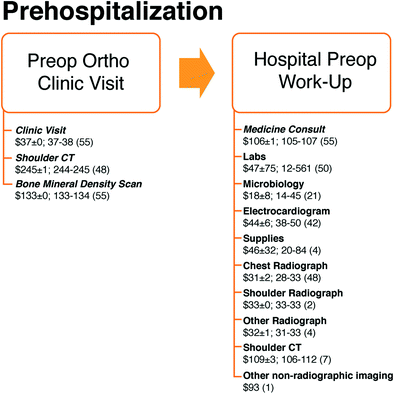
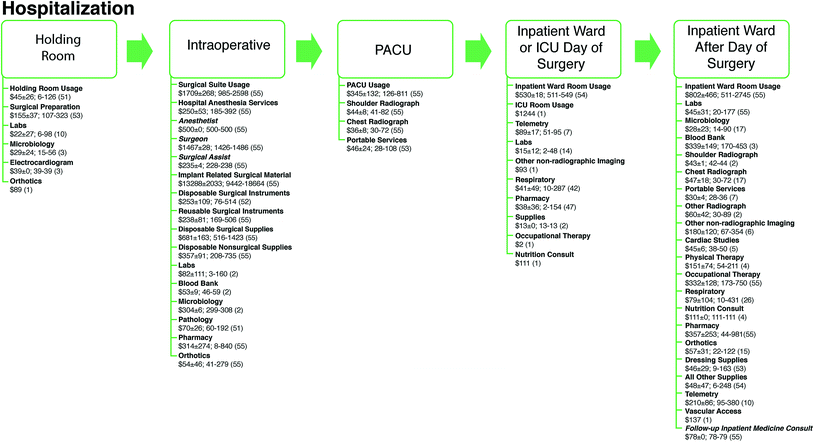
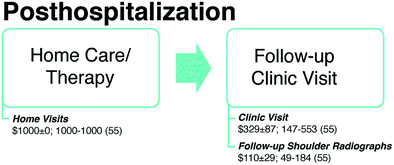
The prehospitalization, hospitalization, and posthospitalization periods accounted for 2.5, 91.6, and 5.8 % of the 4-year total cost of RSA, respectively. Within the prehospitalization period (Fig. 46.1), the shoulder CT was the most expensive component of care (34 % of prehospitalization cost). During the hospitalization period (Fig. 46.2) and also during the entire 4-year study period, the operating room was the most expensive area (86 % of hospitalization cost and 79 % of total cost). Within the operating room, the implants were the single most expensive component of care (59 % of hospitalization cost and 54 % of total cost). The surgeon’s fee was $1467 and was responsible for 6 % of total cost. In the posthospitalization period (Fig. 46.3), the home health care was the most expensive component of care (70 % of posthospitalization cost).


Fig. 46.1
RSA cost of various aspects of care during the prehospitalization period. Costs are represented as [mean ± standard deviation; range] with the number of patients that the cost was attributed to in parenthesis. Costs provided by the hospital are in normal font, while non-hospital costs are in italics

Fig. 46.2
RSA cost of various aspects of care during the hospitalization period. Costs are represented as [mean ± standard deviation; range] with the number of patients that the cost was attributed to in parenthesis. Costs provided by the hospital are in normal font, while non-hospital costs are in italics

Fig. 46.3
RSA cost of various aspects of care during the posthospitalization period. Costs are represented as [mean ± standard deviation; range] with the number of patients that the cost was attributed to in parenthesis. Costs for the posthospitalization period were outside the hospital system and are in italics
The cost of the six patients, which had major complications, included three patients with infection (the total cost of treatment ranged from $7192 to $34,230), two patients with postoperative fractures treated non-operatively (negligible costs), and one patient who required readmission for COPD exacerbation (hospital cost totaled $7434).
Outcomes and Cost of Reverse Shoulder Arthroplasty in Morbidly Obese, a Case–Control Study [35]
The rising number of morbidly obese patients may have significant consequences on the healthcare system, potentially altering the effectiveness, safety, and cost of certain surgical procedures, including reverse shoulder arthroplasty (RSA). We investigated the effect of morbid obesity on outcomes, complications, disposition, and cost in morbidly obese RSA patients in a 1:3 case–control series.
Our joint registry was searched for all primary RSA patients (excluding fractures) with a minimum of 24-months follow-up from 2003–2010; 21 patients with body mass index (BMI) >40 were identified (follow-up 45 ± 16 months, 17 females/4 males, age 69 ± 7) and compared to 63 matched control patients with BMI <30 (follow-up 48 ± 20 months, 50 females/13 males, age 71 ± 6) after a sample size analysis. Outcome data were obtained pre- and postoperatively. Patients’ Charlson-Deyo comorbidity index (CDI), total comorbidities, operative time, blood loss (EBL), hospitalization length, disposition, cost, and complications were recorded.
There were significant (p < 0.05 for all) and comparable improvements for non-obese and morbidly obese patients in functional outcomes (Table 46.2) and range of motion (Table 46.3).
Table 46.2
Subjective outcome scores of obese versus control patients
Obese | Control | p value | Normally distributed | ||
|---|---|---|---|---|---|
Obese | Control | ||||
VAS pain preop | 6.6 ± 1.9 | 6.2 ± 2.2 | 0.398 | N | N |
VAS pain postop | 2.2 ± 2.9 | 1.3 ± 2.2 | 0.293 | N | N |
VAS function preop | 2.1 ± 2.1 | 3.6 ± 2.4 | 0.007 | N | N |
VAS function postop | 6.9 ± 2.4 | 7.8 ± 2.2 | 0.090 | Y | N |
Δ VAS function | 4.8 ± 2.4 | 4.2 ± 2.8 | 0.345 | Y | Y |
Satisfaction | 8.9 ± 1.6 | 9.3 ± 1.3 | 0.280 | N | N |
SST preop | 1.1 ± 1.1 | 2.1 ± 1.9 | 0.031 | N | N |
SST postop | 7.0 ± 3.4 | 8.2 ± 2.9 | 0.139 | Y | N |
Δ SST | 5.6 ± 3.3 | 6.1 ± 3.2 | 0.530 | Y | N |
ASES pain preop | 17.1 ± 9.7 | 19.3 ± 11.0 | 0.372 | N | N |
ASES pain postop | 38.8 ± 14.7 | 43.3 ± 11.0 | 0.293 | N | N |
ASES function preop | 14.8 ± 10.2 | 20.5 ± 10.2 | 0.026 | Y | Y |
ASES function postop | 31.4 ± 9.1 | 34.9 ± 11.1 | 0.089 | Y | N |
Δ ASES function | 16.6 ± 12.7 | 14.4 ± 15.1 | 0.051 | Y | Y |
ASES total preop | 32.0 ± 12.8 | 39.9 ± 17.8 | 0.065 | Y | Y |
ASES total postop
Stay updated, free articles. Join our Telegram channel
Full access? Get Clinical Tree
 Get Clinical Tree app for offline access

| |||||


