Trauma System Management and Financing
Paul A. Taheri
Trauma centers and systems should be financed in a manner consistent with an integrated public health-trauma care plan. Individually, trauma centers function as the critical linkages leading to achieving a truly viable trauma system. Although seemingly straightforward, realizing this funding goal has been elusive for several reasons; these include lack of understanding of the basic business model of health care, poor understanding of what costs should be included in a trauma system, who should pay for these costs, and how they should be paid. This chapter will provide insights into these issues.
BASIC BUSINESS MODEL OF HEALTH CARE AND TRAUMA CENTERS
Clinically, health care delivery is a complex and interdependent series of processes that must function in a coordinated manner to deliver efficacious care. Understanding the basic business model of a hospital requires an understanding of the three basic costs associated with the delivery of care. These costs-variable, fixed, and indirect-are not unique to health care; rather they are present in virtually all businesses.
Variable Costs
These are the costs that are directly attributable to an individual patient and vary with each care episode. Examples of these are the costs associated with the delivery of an antibiotic; usage of durable medical equipment; obtaining a radiograph, laboratory tests, and the like. Typically, variable costs are those costs that are controllable by clinicians. Because more of these resources are consumed during a patient care encounter, the higher the medical bill will be. The corollary to this observation is that the sicker the patient the higher the resource consumption, and the greater the variable costs that will be incurred.
Fixed Costs
These are the costs associated with the physical plant, real property, and equipment required to deliver care. Specifically, the fixed costs can be seen as the cost of the “brick and mortar” associated with a given care unit (e.g., intensive care unit [ICU], operating room [OR], emergency department [ED]). Fixed costs can also be human resources such as the salary associated with the unit clerk, charge nurse, or trauma nurse coordinator. These costs are easy to allocate to a single unit, but not simple to allocate to a specific patient. To best understand the fixed costs associated with a trauma ICU, think of how much it costs to keep the ICU open regardless of patient volume. In other words, the institution bears these fixed costs even if there are no patients in the unit. Cost accountants typically allocate these costs by applying a fixed tax rate to every patient encounter based on the variable costs associated with thespecific clinical encounter. For patients with high variable costs, a tax rate is applied which is typically high (i.e., 50%) and this
is then added to the patients’ variable costs. Therefore for a patient who accumulates $5,000 in variable costs, the fixed costs allocated to the unit would be an incremental $2,500 in addition to the aforementioned variable costs. The total charge for the patient would then be $7,500.
is then added to the patients’ variable costs. Therefore for a patient who accumulates $5,000 in variable costs, the fixed costs allocated to the unit would be an incremental $2,500 in addition to the aforementioned variable costs. The total charge for the patient would then be $7,500.
Indirect Costs
These are the costs that cannot be directly allocated to a specific patient because the cost cannot be readily attributed to a geographically distinct area within the hospital. These include chief executive officer (CEO) salary; cost of maintaining a parking garage, the cafeteria, admissions office, marketing; and the like. Trauma care is emblematic of a system in which substantial investments are required in advance of the patient’s episode of care. Trauma centers must invest in both the physical plant and most importantly the human capital to accept the critically ill. These investments include capacity within the nursing, radiology, and technician staff to be immediately available upon the arrival of an injured patient. Moreover, other forms of capacity such as OR, interventional radiology suites, and ED space must be available. These resources, like all other investments, are expensive and the investment in capacity must be made long in advance of the first patient arrival. Such investments are termed sunk in hospital financial management terminology. Scheduling and prioritizing trauma care are extremely difficult to achieve and never a clinically viable option. The financial management challenges to trauma centers are, therefore, significant.
For trauma centers, a large proportion of the indirect cost is consumed in supplying medical specialist coverage, nursing and other specialized medical personnel, equipment, and space. These costs are experienced from the moment the institution decides to become a trauma center and the costs cannot be easily allocated or recovered from patient billings. These costs are termed the cost of readiness. A study of Florida trauma centers completed in 2002 showed that the “cost of readiness” averaged $2.7 million annually for each of the 20 trauma centers.1 The cost of readiness is a main determinant of the financial health of a trauma system. Despite the fact that a trauma center hospital may have a positive “bottom line,” the cost of readiness is an important factor which may limit the flexibility of the institution in financial markets. This cost may alter the manner in which trauma centers invest in construction to increase capacity. Downstream revenues realized from trauma patients who return to the hospital for treatment rendered after the patient receives funding for health care costs serve to reduce the impact of these outlays.2 Understanding the relationship between cost and reimbursement method for each patient category may also allow for strategic decisions that maximize trauma patient revenue.3 Finally, the cost of readiness is the main reason trauma systems seek durable funding from government sources through local and state taxation schemes, surcharges on fees such as automobile license tags and health insurance costs, as well as “sin taxes” on alcohol and traffic violations.
TABLE 1 COST DETAILS FOR A HYPOTHETICAL INPATIENT STAY, AUGUST 5-7 | |||||||||||||||||||||||||||||||||||||||||||||||||||||||
|---|---|---|---|---|---|---|---|---|---|---|---|---|---|---|---|---|---|---|---|---|---|---|---|---|---|---|---|---|---|---|---|---|---|---|---|---|---|---|---|---|---|---|---|---|---|---|---|---|---|---|---|---|---|---|---|
|
Although all of the components of hospital indirect costs are important to the operational success of the organization, identifying and allocating a specific portion of these costs to a specific patient is remarkably difficult. For example, how much of the CEO’s salary should be allocated to an ICU patient or an ambulatory care patient? The answer to this question is difficult, yet the cost accountants must cover the costs associated with these important functions. In aggregate, hospital fixed costs plus indirect costs are termed overhead.
The Mythology of Health Care Cost Reduction Strategies
For decades, physicians have been asked to reduce the cost of care by rationing resources. This rationing includes reducing the patients’ lengths of hospital stay. To illustrate why this does not work as intended, consider the data in Table 1 on the cost of one hypothetical patient’s stay
in August 1999. This table provides little data on the patient’s diagnosis or care, but it documents the resources consumed. For example, the patient had spent $25 for laboratory tests on August 5, and $18 of this amount was allocated as overhead. The test involved only $7 in variable direct costs. Similarly, the patient incurred $8 in variable direct pharmacy costs on August 6, and the hospital’s accountants added $11 in overhead to help recover other (indirect) costs. The total 3-day cost was $4,145, of which $2,600 was overhead and $770 was the variable direct cost of routine nursing. Variable direct costs on the final day of the patient’s stay were a mere $134.
in August 1999. This table provides little data on the patient’s diagnosis or care, but it documents the resources consumed. For example, the patient had spent $25 for laboratory tests on August 5, and $18 of this amount was allocated as overhead. The test involved only $7 in variable direct costs. Similarly, the patient incurred $8 in variable direct pharmacy costs on August 6, and the hospital’s accountants added $11 in overhead to help recover other (indirect) costs. The total 3-day cost was $4,145, of which $2,600 was overhead and $770 was the variable direct cost of routine nursing. Variable direct costs on the final day of the patient’s stay were a mere $134.
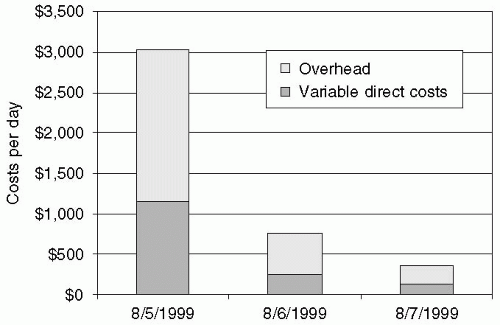 Figure 1 Costs per day, August 5-7, 1999. |
Figure 1 shows the total daily costs. It is easy to see that resource consumption is front-loaded, with the majority expenses being incurred on the first day of the patient’s stay.4 If the caregivers responsible for this patient had somehow succeeded in discharging the patient on the evening of August 6 rather than on August 7, costs would have fallen by only $356, and the true resource savings would have been a mere $134, or just 3.4% of the $4,145 total! Lopping off a full day of this patient’s stay would have saved little. Indeed, from Table 1 it is clear that at most a few hundred dollars could be saved even if this encounter could have been done on an outpatient basis. What is true for this patient is true generally—resource consumption tends to be composed largely of overhead and front-loaded variable costs.
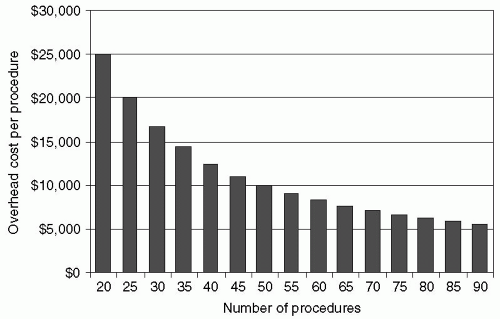 Figure 2 Fixed costs/case with $500,000 in overhead. |
There are few savings attainable from rationing the variable resources needed to treat individual patients. To illustrate, suppose a hospital invests $500,000 in fixed costs for a new clinical service, including space, durable equipment, a salaried administrator, and other capital and human resources. These are the service’s fixed costs, and the hospital incurs them whether it treats 1 patient or 100. This $500,000 investment constitutes “overhead,” and Fig. 2 shows how the overhead cost per case varies with the number of patients treated. If there are only 20 patients, then $25,000 of overhead is allocated to each patient; if there are 50 patients, then overhead falls to $10,000 per patient; and if the hospital can somehow treat 100 patients, the overhead is a mere $5,000 per case. In other words, Fig. 2 shows how fixed cost per case falls as a result of treating more patients. This is the simple logic of “amortizing” fixed costs by spreading the cost over a larger group of patient encounters by increasing “throughput.” This fact of business life is no more or less compelling in health care than in other high fixed-cost industries. The benefits are readily apparent in industries ranging from manufacturing to transportation to publishing to software. It is worth noting that amortization does not depend upon achieving “economies of scale.” Economy of scale refers to producing products in large volumes to reduce unit costs, whereas amortization focuses on making full use of all available fixed resources. A pediatrician has high fixed costs but enjoys few economies of scale. Even operating on a relatively small scale the pediatrician must schedule as many patients as possible during the course of a working day.
If a hospital functions at high capacity utilization, then inpatient length of stay is important, not because
discharging a patient early saves resources. But because reducing length of stay frees up capacity, thereby creating opportunities to admit more patients, improvement of throughput leads to more efficient capacity utilization, and a healthier financial status for the institution. The goal is not to discharge patients early from hospital or to rush them from beginning to end. Basic operations management techniques expedite care, thereby improving service and outcomes while raising patient satisfaction. Understanding the distribution of these costs is relevant to understanding how hospitals and health systems make investment decisions. In general, the distribution is as follows (see Fig. 3): The fixed cost accounts for approximately 15% to 20% of the total cost of care. The indirect and variable costs account for approximately 40% to 45% and 35% to 40%, respectively, of the care. In aggregate, these overhead costs account for approximately 60% to 65% of all the costs associated with the delivery of patient care. An alternative way of thinking of these “overhead costs” is how much it would cost to have the hospital functioning if no patients were admitted. From an economist’s point of view, a hospital and health system is a high fixed cost and relatively low variable cost business. This economic model applies to programs within the institution such as trauma, transplant, and others. Understanding this fundamental economic tenet regarding the business of health care is critical to understanding trauma center financing. Once it is understood that most costs are fixed, this business model requires high volumes of patients to be financially viable. The goal is to optimize the system by high throughput volume (putting more patients through the system, center, or service) in order to amortize the large fixed costs over as many patients as possible. This model is common in industries such as education, automobile manufacturing, oil and gas exploration, and pipeline construction.
discharging a patient early saves resources. But because reducing length of stay frees up capacity, thereby creating opportunities to admit more patients, improvement of throughput leads to more efficient capacity utilization, and a healthier financial status for the institution. The goal is not to discharge patients early from hospital or to rush them from beginning to end. Basic operations management techniques expedite care, thereby improving service and outcomes while raising patient satisfaction. Understanding the distribution of these costs is relevant to understanding how hospitals and health systems make investment decisions. In general, the distribution is as follows (see Fig. 3): The fixed cost accounts for approximately 15% to 20% of the total cost of care. The indirect and variable costs account for approximately 40% to 45% and 35% to 40%, respectively, of the care. In aggregate, these overhead costs account for approximately 60% to 65% of all the costs associated with the delivery of patient care. An alternative way of thinking of these “overhead costs” is how much it would cost to have the hospital functioning if no patients were admitted. From an economist’s point of view, a hospital and health system is a high fixed cost and relatively low variable cost business. This economic model applies to programs within the institution such as trauma, transplant, and others. Understanding this fundamental economic tenet regarding the business of health care is critical to understanding trauma center financing. Once it is understood that most costs are fixed, this business model requires high volumes of patients to be financially viable. The goal is to optimize the system by high throughput volume (putting more patients through the system, center, or service) in order to amortize the large fixed costs over as many patients as possible. This model is common in industries such as education, automobile manufacturing, oil and gas exploration, and pipeline construction.
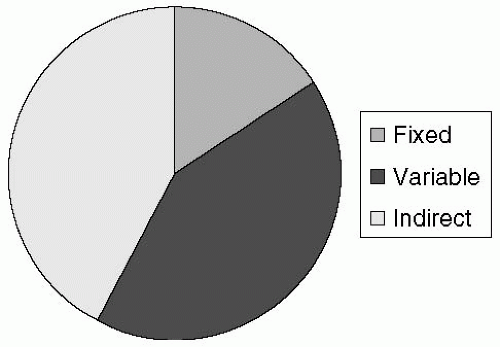 Figure 3 Hospital/health system cost structure displayed graphically. |
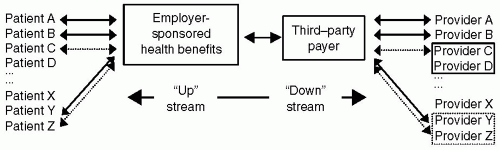 Figure 4 Diagrammatic representation of the complex relationships between payers, providers, and consumers of health care. |
Understanding these costs allows for enhanced insight into the management perspectives of health systems and trauma centers. From a management perspective, health systems must invest large amounts of capital in both the physical plant and in training and maintaining the requisite specialized human capital. The plant investments are easily seen and quantified, such as a new computed tomography (CT) scanner, new ORs, or new space in the ED. In addition, a portion of the human capital such as nursing and various therapists can be assigned or allocated to a specific region within the hospital (OR, ED, radiology). In the case of trauma, much of this expense comes in the form of trauma center readiness. Trauma centers by their very nature require a high level of on-demand support staff including physicians, specialists, and others to function properly. Several observations are important in understanding how these costs impact care. First, most costs are in “overhead” (fixed and indirect costs), not variable costs. For more than a decade, clinicians and administrators have focused their cost reduction efforts on the variable costs (per diem charges, laboratory costs, medications, and supplies), yet the bulk of the costs are in “overhead.” Second, hospitals and health systems are by fiscal necessity, required to treat increasing volumes of patients to remain viable. Moreover, how these costs are specifically allocated at the patient level can then create some unfortunate consequences related to the financial interpretation of a given patient care episode. For example, legal and fiscal restraints prevent hospitals from discounting the billings for patients who are “self-pay” or who have no funding. This fact leads to the appearance of differential billing favoring patients who are more affluent at the expense of indigent patients.
How is Care Financed?
Health care is financed through multiple links and various financial intermediaries. Figure 4 depicts some but not all of the contractual relationships, with employees “up” stream as ultimate purchasers of care and providers all the way “down” stream as ultimate sellers. It describes three contractual interfaces-between employer and employee, between employer and third-party payer, and between third-party payer and health care provider. Each interface
is complex and made more difficult by their many interactions. Therefore, for example, employees’ covered benefits depend on the contractual relationships that third-party payers negotiate with providers downstream, while downstream contracts are negotiated with upstream relationships in mind.
is complex and made more difficult by their many interactions. Therefore, for example, employees’ covered benefits depend on the contractual relationships that third-party payers negotiate with providers downstream, while downstream contracts are negotiated with upstream relationships in mind.
THIRD-PARTY PAYERS
One way to parse these contracts is to identify third-party payers as the nexus through which contracting occurs. As an empirical matter, this makes sense, because the two largest payers, Medicare and Medicaid, are huge government agencies that set their contractual terms unilaterally. The terms they dictate anchor health care financing, even if other third-party payers cannot (or choose not to) follow Medicare and Medicaid. The approach, therefore, is to describe these third-party payers; then explain how they contract with other parties upstream and downstream.
Figure 5 shows the percentage of the US population covered by health insurance in 2005.5 Medicare and Medicaid together cover 29% of Americans; various Blue Cross Blue Shield (BCBS) plans cover 19%; other private payers have a 32% share; and 15% of the population is uninsured. This section briefly summarizes each payer category.
Government Payers: Medicare, Medicaid, TRICARE, and Others
Medicare and Medicaid are the largest and most influential third-party payers. Medicare is the federal government’s health insurance for elderly Americans. It also covers some disabled patients and patients with end-stage renal disease. Medicare is financed through a payroll tax (currently 2.9%) on all workers. When workers retire, they are then entitled to Medicare coverage at a nominal fee. Medicare “Part A” is available at no charge and covers hospital and skilled nursing facility care; Medicare “Part B” is Supplementary Medical Insurance (SMI) that reimburses physicians’ professional fees, diagnostic tests, radiology, pathology, and various other services. Part B is optional, but nearly everyone who is eligible pays the modest premium. In 2003, Congress added prescription drug coverage which began in 2006.
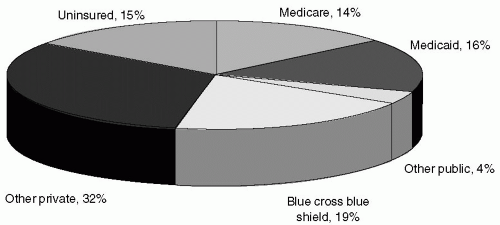 Figure 5 Proportions of US health care financing by payer source. |
Medicaid provides health coverage for the poor. Eligibility is narrow, however, with an emphasis on families with children. (According to Harvard’s Health Care Insurance Report5 of 31 million Americans living in poverty in 2003, only 12 million were covered by Medicaid.) Medicaid also covers nursing home care for the elderly, if they have exhausted their Medicare coverage as well as their personal savings. Finally, Medicaid also provides benefits to the disabled. Medicaid is financed out of the general revenues of the federal government and the individual states, which together share the financial burden. Medicaid is administered by individual states. There are other government payers. TRICARE insures active duty military and uniformed retirees, along with their families. The Federal Health Benefits Program (FEHB) covers approximately 9 million federal employees and their dependents through 350 health plans nationwide. The State Children’s Health Insurance Program (SCHIP) provides insurance to children in families that earn more than Medicaid allows but too little to afford other coverage. To cover the health care costs of their workers’ job-related injuries, employers pay into a state fund called Workers Compensation.
“The Blues”
BCBS plans are collectively the nation’s oldest and largest health insurers. Historically, they have been state-based not-for-profit firms (e.g., BCBS of Michigan). “The Blues” began consolidating in the 1980s, and of 110 plans in 1987, only 39 remained in 2003. Wellpoint is the largest BCBS plan, formed by the merger of many state plans, and it has converted from not-for-profit to a for-profit publicly traded company. Other BCBS plans have also converted to for-profit. In 2003, not-for-profit BCBS plans provided coverage to 88 million Americans.
Related posts:

Stay updated, free articles. Join our Telegram channel

Full access? Get Clinical Tree


