TABLE 61.1 Characteristics of the Three Metabolic Systems | ||||||||||||||||||||||||||||||||||||
|---|---|---|---|---|---|---|---|---|---|---|---|---|---|---|---|---|---|---|---|---|---|---|---|---|---|---|---|---|---|---|---|---|---|---|---|---|
| ||||||||||||||||||||||||||||||||||||
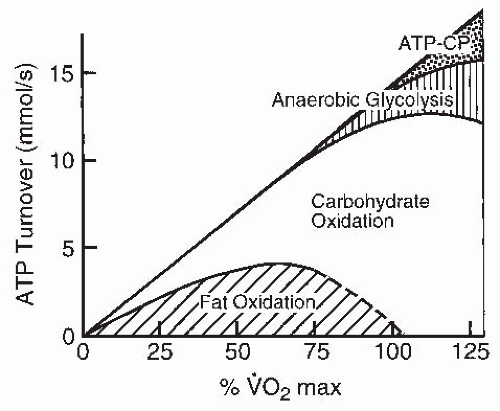
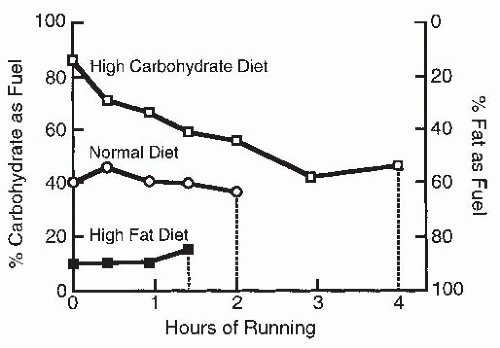
diet, mode of exercise, and level of fitness. As the intensity of the exercise is increased, the predominant fuel source shifts toward carbohydrate. This is partly because ATP production shifts toward anaerobic metabolism during high-intensity exercise and carbohydrate is the only fuel available for anaerobic glycolysis. Carbohydrates are made available to the contracting muscle through mobilization of muscle and liver glycogen stores as well as through ingested carbohydrates that are circulating in the bloodstream.
TABLE 61.2 Characteristics of the Different Metabolic Substrates | ||||||||||||||||
|---|---|---|---|---|---|---|---|---|---|---|---|---|---|---|---|---|
|
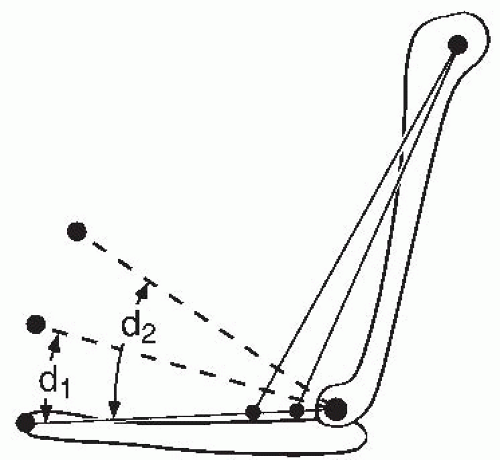
contractile element with both series and parallel elastic elements. The contractile element actively generates force and represents the interaction between actin and myosin filaments. The elastic elements are purely passive components acting as mechanical springs. The series elastic element represents the tendinous insertions of muscle, and the parallel elastic element represents the connective tissue surrounding the various subunits of the muscle.
 FIGURE 61-6. Mechanical model of muscle consisting of a contractile element and two elastic elements. (From Roberts TDM. Neurophysiology of Postural Mechanics. London: Butterworth; 1978.) |
TABLE 61.3 Muscle Fiber Type Continuum Using the Myosin ATPase Classification System | |||||||||||||||||||||||||||||||||||
|---|---|---|---|---|---|---|---|---|---|---|---|---|---|---|---|---|---|---|---|---|---|---|---|---|---|---|---|---|---|---|---|---|---|---|---|
|
phosphorylase. Phosphorylase is an enzyme that is involved in the breakdown of glycogen. As a result, these fibers are suited for performance of high-intensity, short-duration work. Hybrid subtypes exist linking the major fibers of I and IA and IX on a continuum from type I to IC to type IIC, IIAC to IIA to IIAX to IIX. With activation of the motor units, a transition of the ATPase isoforms will move from the type IIX to the type IIA subtype (17). The continuum of hybrids fibers goes from the most oxidative isoform type I to the least oxidative isoform type IIX. However, again, when a motor unit is activated, oxidative processes increase and exercise training will even leave type IIX fibers that remain with higher concentrations of oxidative enzymes. Thus, the transition to the primary fiber type as visualized by the histochemical staining is related to the oxidative status of the fiber while it keeps its characteristic size and function. Capillary development also follows this transition to greater density as oxidative needs increase. However, due to the fact that type I motor units are orderly recruited first in almost all activities and are involved for the repetitive endurance activities, their oxidative, mitochondrial, and capillary profiles are always greater than type II or fast motor units.
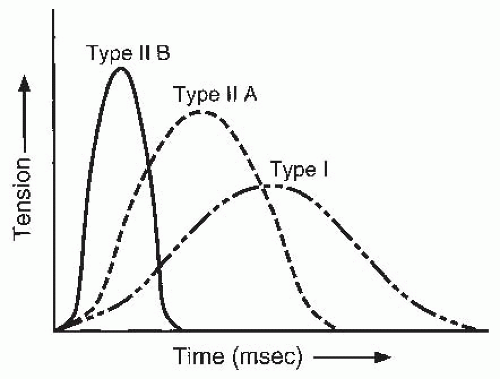 FIGURE 61-7. Schematic representation of rate of tension generation and force production with different fiber types. The speed of contraction and force are greatest for type II fibers. |
inhibition of the protective reflex mechanisms. Furthermore, the bilateral deficit has been shown to be reduced through training with bilateral contractions (33).
increases the mechanical stiffness of the joint and can provide considerable resistance to perturbating forces such as those that might be encountered while walking across a crowded room with a full glass. This same phenomenon may also play a role in protecting joints from traumatic forces.
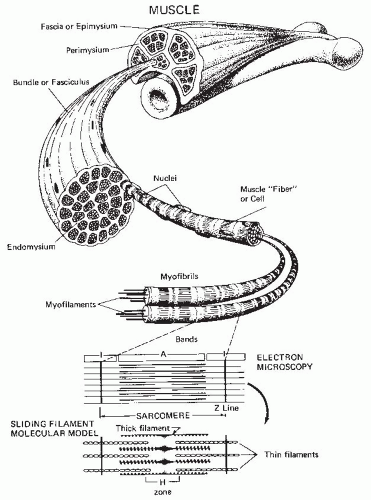
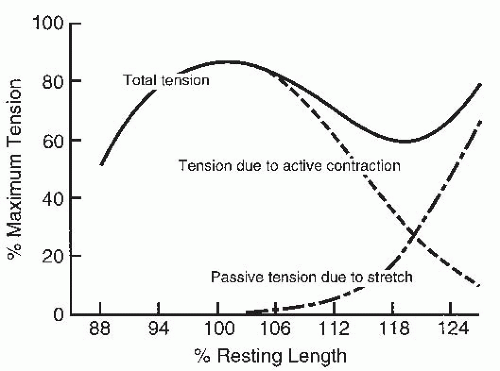
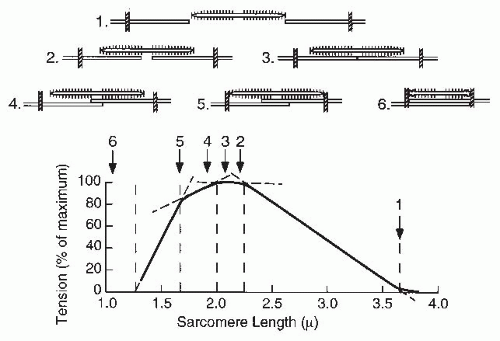
myosin filaments interact at the sarcomere level. Figure 61-13 shows the length-tension relationship for a single muscle fiber and the overlap of the actin and myosin filaments in a single sarcomere (40). As the overlap between actin and myosin increases, so does the tension production. Maximal tension is developed at lengths yielding maximal contact of actin and myosin filaments. As the sarcomere length decreases further, the actin filaments begin to overlap. It is believed that this interferes with crossbridge formation and causes a decline in tension development. Variations among sarcomeres and muscle fibers cause the length-tension curve to be more rounded for a whole muscle.
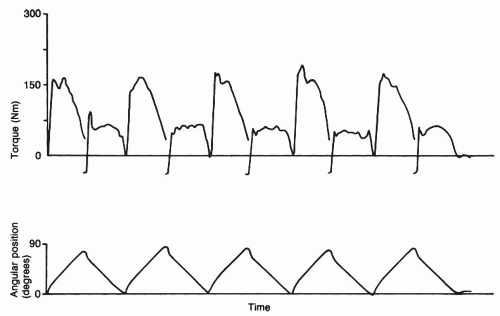
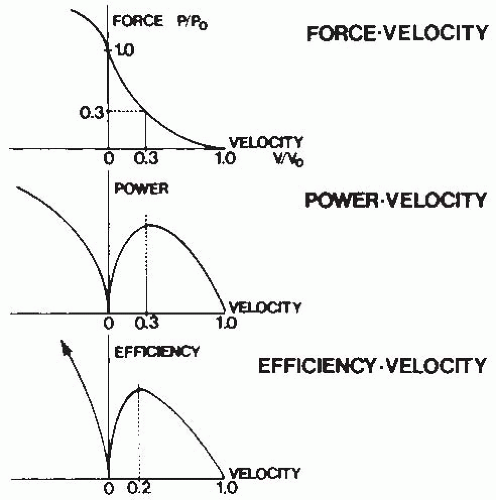
movement commonly tested in the clinical setting (41). This figure demonstrates how maximal torque varies across movements when angular velocity is constant.
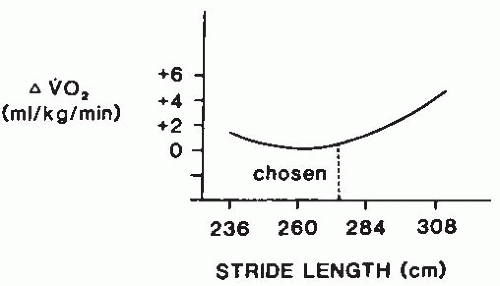
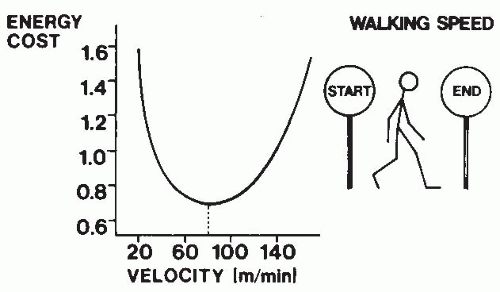
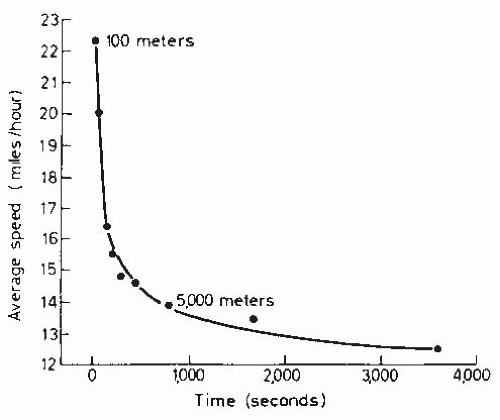
that optimizes the aerobic demands for walking a given distance (Fig. 61-17) (50).
threefold increase in arteriovenous oxygen difference at maximal exercise (59).
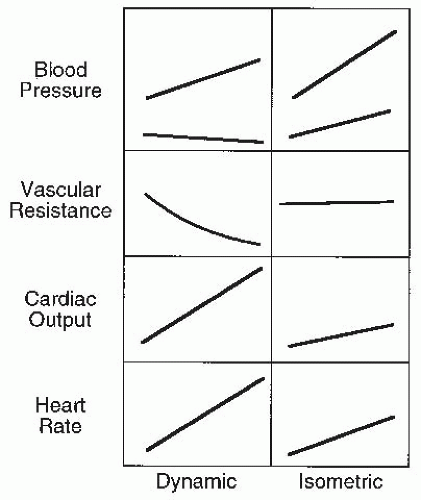
of a volume load on the left ventricle (94,95). Although initial studies suggested that the magnitude of the presssor response to static exercise was primarily related to the percentage of MVC, most (but not all) subsequent studies suggest that the amount of muscle mass used also impacts positively on the pressor response.
information on secondary prevention of cardiovascular disease, the reader is referred to the Chapter, “Cardiac Rehabilitation”.
(prediabetic state) reduced their incidence of DM during follow-up with a lifestyle diet/exercise intervention program designed to lose weight compared with those receiving normal care. This benefit was even more effective than that resulting from the administration of an oral antihyperglycemic agent.
coronary arterial vasoconstrictor response observed in atherosclerotic segments and thereby improve coronary artery blood flow. Aerobic conditioning has been recently reported to help prevent and restore age-related declines in endothelialdependent vasodilation in healthy people (185).
TABLE 61.4 Physiologic Adaptations to Aerobic Exercise Training as Observed in Resting and Exercise States | ||||||||||||||||||||||||||||||||||||||||||||||||||||
|---|---|---|---|---|---|---|---|---|---|---|---|---|---|---|---|---|---|---|---|---|---|---|---|---|---|---|---|---|---|---|---|---|---|---|---|---|---|---|---|---|---|---|---|---|---|---|---|---|---|---|---|---|
|
volume increases with training is not entirely clear but involves increased cardiac preload and probably enhanced myocardial contractility and relaxation (66,201). Aerobic training causes an increase in total blood volume that partially accounts for the increased cardiac preload. The extent of cardiac adaptations appears to be related to such training factors as the length, intensity, duration, and mode of training and the time of life at which training was initiated.
TABLE 61.5 Borg RPE 6-20 Scale | ||||||||||||||||||||||||||||||||
|---|---|---|---|---|---|---|---|---|---|---|---|---|---|---|---|---|---|---|---|---|---|---|---|---|---|---|---|---|---|---|---|---|
| ||||||||||||||||||||||||||||||||
Stay updated, free articles. Join our Telegram channel

Full access? Get Clinical Tree


