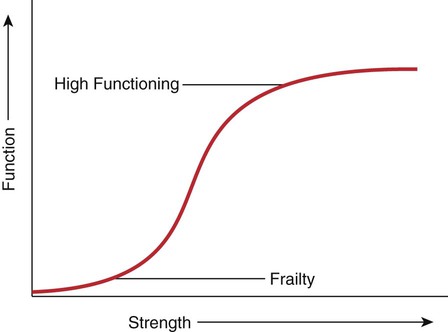
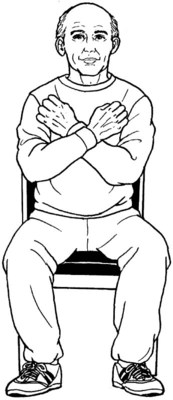
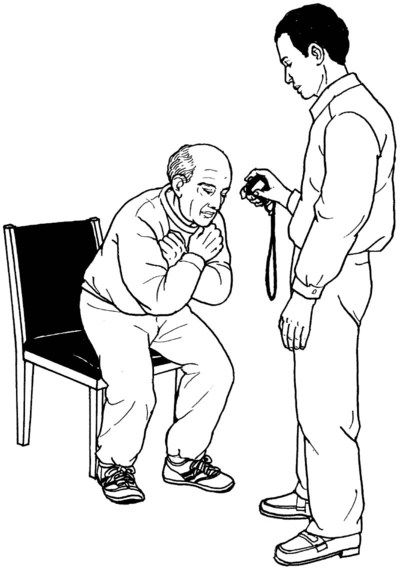
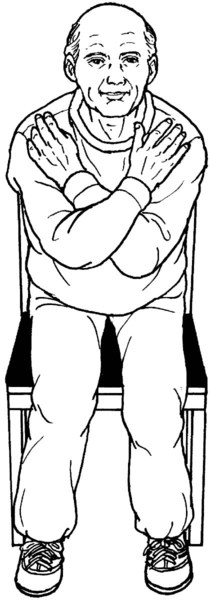
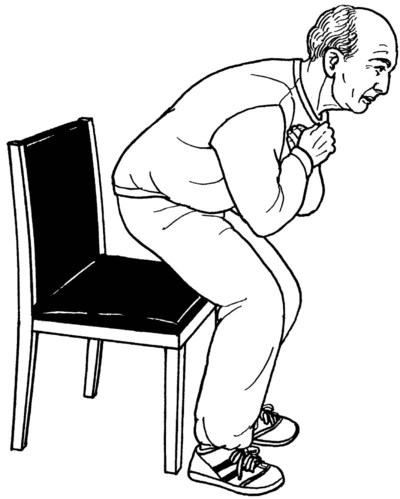
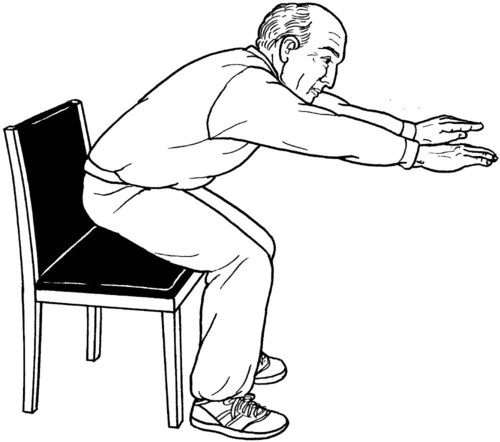
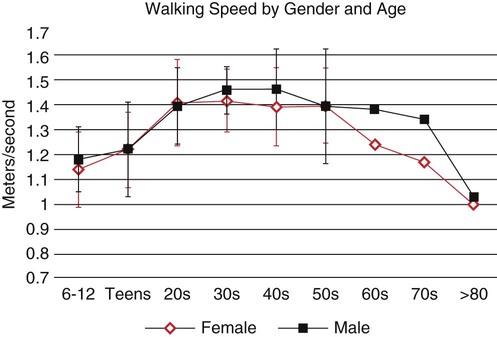
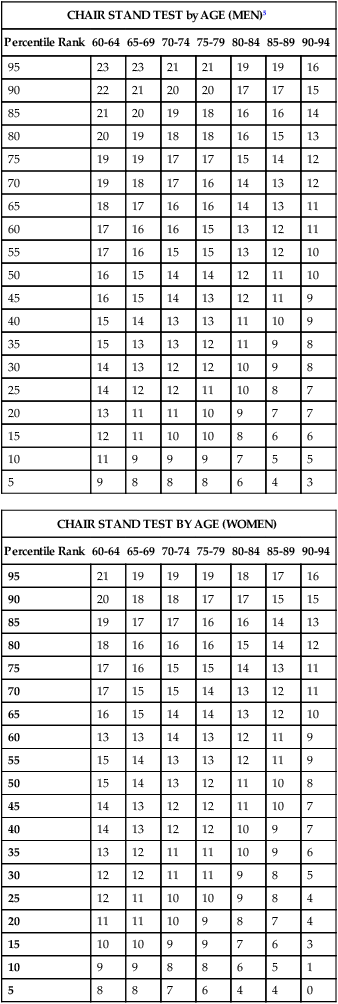
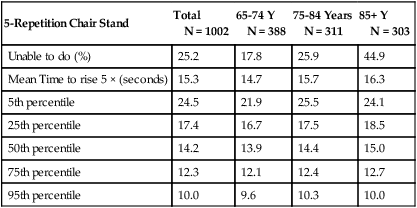
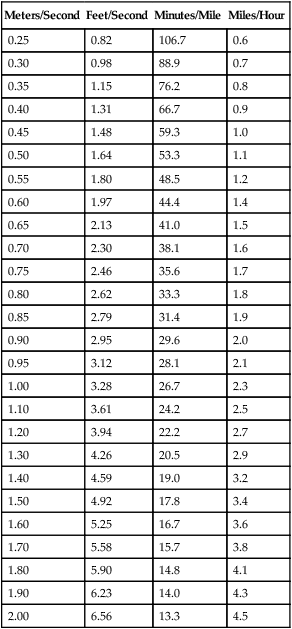
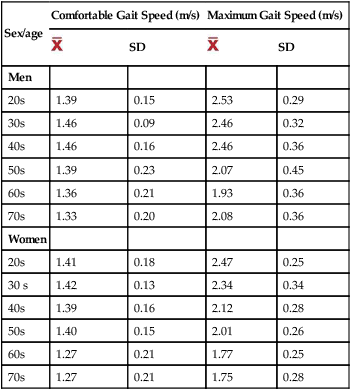
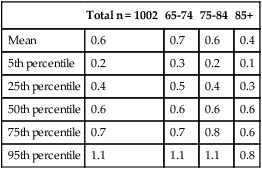
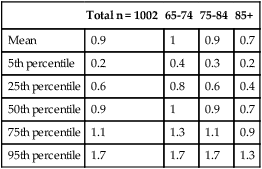
The Nagi Model of Disablement1 as well as the newer International Classification of Functioning (ICF) disablement model2 describe the impact of disease and pathology within the context of both function and societal roles and provide a conceptual model to guide clinical practice. In these models, diminished muscle strength is seen as an impairment that affects a person’s ability to perform functional tasks or to fulfill societal roles. Muscle strength testing takes place at the impairment level whereas testing performance of a functional task occurs at the function level. One goal of this chapter is to integrate impairment (strength deficit) and functional loss. It is generally accepted that in the normal person, performance of basic functional tasks requires a relatively small amount of muscle strength in relation to the total amount of strength that existed before the injury, before a lifestyle of inactivity, or before the passage of years. The minimum amount of strength required is referred to as a “strength threshold.” If patients have strength above the required threshold amount, they are unlikely to show deficits in performance. The relationship of strength to function up to a specific threshold is illustrated in Figure 9-1. According to the principle illustrated in this graph, if we strengthen a patient sufficiently and bring his or her strength value to the point at which the curve flattens out, a patient should be strong enough to perform the task. For example, about 45% of one’s body weight is required to rise from a chair without using the arms.3 If a person is unable to rise from a chair unassisted because of weakness in the lower extremities, strengthening will help to improve that function. Further strengthening will allow the person to rise more quickly and efficiently and will create a strength reserve to help preserve the ability to perform the task in the future. An analysis of any functional task shows that movements are multiplanar and asymmetrical, incorporate rotation, and are speed and balance dependent. Therefore, simply testing a muscle’s maximum ability to generate force will not accurately represent its functional ability. Observation of the individual performing the functional task is the only way to accurately test functional ability. Such observation provides information about the quality of the performance, which in turn informs the therapist’s clinical decision making. Inferring that a specific muscle is functional without direct observation of the functional task is incorrect and should be avoided. Table 9-1 shows the key muscles required for some basic functional tasks. Table 9-1 KEY MUSCLES ESSENTIAL FOR FUNCTIONAL MOVEMENTS Timed Five-repetition Version: Table 9-2 shows normative ranges for physically active older men and women. For the 30-second chair stand, seven repetitions may indicate frailty in people with coronary artery disease.9 Likewise, eight repetitions may be the threshold for physical disability.5 Table 9-2 CHAIR STAND NORMS FOR PHYSICALLY ACTIVE OLDER ADULTS Source of data for women: Rikli RE, Jones CJ. Senior Fitness Test Manual. Champaign, IL: Human Kinetics; 2001. Table 9-3 shows normative ranges for moderately disabled women—that is, those who have difficulty performing two ADL tasks. The Women’s Health and Aging Study (of moderately to severely disabled women) found a mean time for ages 65 to 85 and older of 15.3 seconds.10 The more time required, the more likely it is that the individual is frail.11 Table 9-3 CHAIR STAND PERFORMANCE FOR MODERATELY DISABLED WOMEN Y, age in years. Moderately disabled women were those with difficulty in two or more activities of daily living tasks. Adapted from Ferrucci L, Guralnik JM, Bandeen-Roche KL, et al. Performance measures from the Women’s Health and Aging Study. http://www.grc.nia.nih.gov/branches/ledb/whasbook/chap4/chap4.htm. Accessed January 8, 2012. Gait speed is a functional test of one’s ability to walk at a comfortable (usual) speed. A fast-paced walk can demonstrate available reserve and the ability to accelerate rapidly, such as in the need to get across a street. Possible gait speed times range from the fastest sprinters to the slowest possible gait, often seen in individuals residing in nursing homes. Gait speed has been called the sixth vital sign because of its validity in predicting functional ability, frailty, nursing home placement, and the ability to walk in the community.15 It can be measured in any person who can walk, even those using assistive devices. Hip extension and abduction, knee extension, ankle plantar flexion, and ankle dorsiflexion with inversion.12 Hip flexion also contributes to walking velocity.13 The reader is referred to the gait section of this chapter for a more specific list of muscles that are imperative for smooth and normal gait. Gait speed is related to age (Figure 9-7).15 Gait speed at “usual pace” was found to be a consistent predictor of disability, cognitive impairment, institutionalizations, falls, and/or mortality.16 A speed of less than 0.8 meters per second (m/s) is a predictor of 8-year mortality in predisabled women 75 years or older17 and is considered pathologic.18 A speed of less than 1.0 m/s identifies well-functioning people at high risk of health-related outcomes19 and impaired function.20 In one study, the mean gait speed used by 139 pedestrians was 1.32 (SD, 0.31) m/s.21 A cutoff score of 0.57 m/s can indicate that the person is in need of physical therapy.22 First, describe the test clearly to the individual. Demonstrate the test if needed, taking care not to walk too fast. Then, have the patient perform two trials with adequate rest in between, scoring the faster one. Test both comfortable (usual) and fast gait speeds. Begin timing the individual when the first foot crosses the line at the beginning of the course (Figure 9-8,A) and stop timing when the first foot crosses the end line (Figure 9-8,B). Any part of the foot will do; it is just important to be consistent. Standing, holding the stopwatch perpendicular to the starting line. Therapist will walk with the patient to obtain an accurate view of when the first foot crosses the finish line. The therapist will begin timing when the first foot (or part of the first foot) crosses the start line of the 4-meter walkway (see Figure 9-8,A). The time taken to walk 4 meters is divided into 4 for a result in meters per second (m/s). There are many gait speed standards. Gait speeds of 1.75 m/s to 2.25 m/s are normal in high-functioning older adults, whereas gait speeds slower than 0.5 m/s are common in nursing home residents. Table 9-4 indicates some conversions from meters/second to feet/second and miles/hour. Tables 9-5, 9-6 and 9-7 list normative values for gait speed by age. Table 9-4 Table 9-5 MEAN USUAL GAIT SPEED TIME FOR MEN AND WOMEN AGE 20 YEARS AND OLDER SD, standard deviation; x, mean. Data from Bohannon RW. Comfortable and maximum walking speed of adults aged 20-79 years: reference values and determinants. Age Ageing. 1997;26(1):15-19. Table 9-6 NORMS FOR USUAL GAIT SPEED TIME (M/S) FOR MODERATELY DISABLED WOMEN AGE 65 AND OLDER M/s, meters per second; n, number of subjects. Moderately disabled women were those with difficulty in two or more activities of daily living tasks. Subjects were asked to walk at their usual and customary pace for 4 m. Adapted from: Ferrucci L, Guralnik JM, Bandeen-Roche KL, et al. Performance measures from the women’s health and aging study. http://www.grc.nia.nih.gov/branches/ledb/whasbook/chap4/chap4.htm. Accessed January 8, 2012. Table 9-7 NORMS FOR FAST GAIT SPEED TIME (M/S) FOR MODERATELY DISABLED WOMEN AGE 65 AND OLDER M/s, meters per second; n, number of subjects. Moderately disabled women were those with difficulty in two or more activities of daily living tasks. Adapted from: Ferrucci L, Guralnik JM, Bandeen-Roche KL, et al. Performance measures from the women’s health and aging study. http://www.grc.nia.nih.gov/branches/ledb/whasbook/chap4/chap4.htm. Accessed January 8, 2012. The short physical performance battery (SPPB) can be used to assess how well older adults perform mobility-related tasks and tasks that are important to the performance of daily activities. This test battery can predict future disability, hospitalization, and death even in patients who report no disability at initial testing.23 Early identification of these people, who are presumably in a preclinical stage of disability, can provide an opportunity for early intervention that may prevent further progression of disability. Most of the tasks in the battery are timed, providing some norms to compare specific patient performance. The SPPB was developed by the National Institute on Aging for the Established Populations for Epidemiologic Studies of the Elderly and has been used in many research studies. A free download of the instructions (with script) and DVD are available at http://www.grc.nia.nih.gov/branches/ledb/sppb/index.htm.
Testing Functional Performance
Introduction
Functional Testing
Functional Movement
Key Muscles
Bed mobility
Abdominals, erector spinae, gluteus maximus
Transfers and squats
Gluteus maximus, medius, and obturator externus, piriformis, quadriceps
Ambulation and stair climbing
Abdominals, erector spinae, gluteus maximus and medius, obturator externus, piriformis, quadriceps, and anterior tibialis and gastrocsoleus
Floor transfers
Abdominals, erector spinae, gluteus maximus and medius, obturator externus, piriformis, quadriceps and gastrocsoleus
Fast gait and jumping
Gastrocsoleus, gluteus maximus and medius, quadriceps
Chair Stand
Scoring
CHAIR STAND TEST by AGE (MEN)5
Percentile Rank
60-64
65-69
70-74
75-79
80-84
85-89
90-94
95
23
23
21
21
19
19
16
90
22
21
20
20
17
17
15
85
21
20
19
18
16
16
14
80
20
19
18
18
16
15
13
75
19
19
17
17
15
14
12
70
19
18
17
16
14
13
12
65
18
17
16
16
14
13
11
60
17
16
16
15
13
12
11
55
17
16
15
15
13
12
10
50
16
15
14
14
12
11
10
45
16
15
14
13
12
11
9
40
15
14
13
13
11
10
9
35
15
13
13
12
11
9
8
30
14
13
12
12
10
9
8
25
14
12
12
11
10
8
7
20
13
11
11
10
9
7
7
15
12
11
10
10
8
6
6
10
11
9
9
9
7
5
5
5
9
8
8
8
6
4
3
CHAIR STAND TEST BY AGE (WOMEN)
Percentile Rank
60-64
65-69
70-74
75-79
80-84
85-89
90-94
95
21
19
19
19
18
17
16
90
20
18
18
17
17
15
15
85
19
17
17
16
16
14
13
80
18
16
16
16
15
14
12
75
17
16
15
15
14
13
11
70
17
15
15
14
13
12
11
65
16
15
14
14
13
12
10
60
13
13
14
13
12
11
9
55
15
14
13
13
12
11
9
50
15
14
13
12
11
10
8
45
14
13
12
12
11
10
7
40
14
13
12
12
10
9
7
35
13
12
11
11
10
9
6
30
12
12
11
11
9
8
5
25
12
11
10
10
9
8
4
20
11
11
10
9
8
7
4
15
10
10
9
9
7
6
3
10
9
9
8
8
6
5
1
5
8
8
7
6
4
4
0
5-Repetition Chair Stand
Total
N = 1002
65-74 Y
N = 388
75-84 Years
N = 311
85+ Y
N = 303
Unable to do (%)
25.2
17.8
25.9
44.9
Mean Time to rise 5 × (seconds)
15.3
14.7
15.7
16.3
5th percentile
24.5
21.9
25.5
24.1
25th percentile
17.4
16.7
17.5
18.5
50th percentile
14.2
13.9
14.4
15.0
75th percentile
12.3
12.1
12.4
12.7
95th percentile
10.0
9.6
10.3
10.0
Gait Speed
Purpose:
Essential Muscle Movements for Task Performance:
Validity:
Testing Procedure:
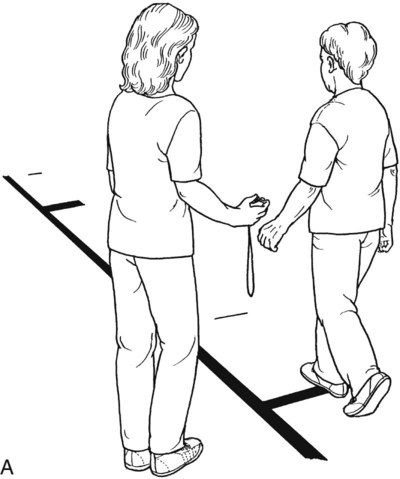
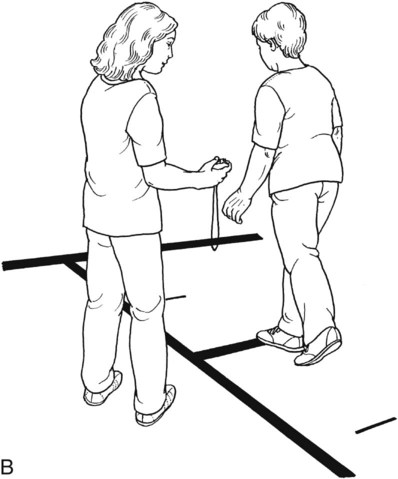
Position of Therapist:
Scoring
Meters/Second
Feet/Second
Minutes/Mile
Miles/Hour
0.25
0.82
106.7
0.6
0.30
0.98
88.9
0.7
0.35
1.15
76.2
0.8
0.40
1.31
66.7
0.9
0.45
1.48
59.3
1.0
0.50
1.64
53.3
1.1
0.55
1.80
48.5
1.2
0.60
1.97
44.4
1.4
0.65
2.13
41.0
1.5
0.70
2.30
38.1
1.6
0.75
2.46
35.6
1.7
0.80
2.62
33.3
1.8
0.85
2.79
31.4
1.9
0.90
2.95
29.6
2.0
0.95
3.12
28.1
2.1
1.00
3.28
26.7
2.3
1.10
3.61
24.2
2.5
1.20
3.94
22.2
2.7
1.30
4.26
20.5
2.9
1.40
4.59
19.0
3.2
1.50
4.92
17.8
3.4
1.60
5.25
16.7
3.6
1.70
5.58
15.7
3.8
1.80
5.90
14.8
4.1
1.90
6.23
14.0
4.3
2.00
6.56
13.3
4.5
Sex/age
Comfortable Gait Speed (m/s)
Maximum Gait Speed (m/s)

SD

SD
Men
20s
1.39
0.15
2.53
0.29
30s
1.46
0.09
2.46
0.32
40s
1.46
0.16
2.46
0.36
50s
1.39
0.23
2.07
0.45
60s
1.36
0.21
1.93
0.36
70s
1.33
0.20
2.08
0.36
Women
20s
1.41
0.18
2.47
0.25
30 s
1.42
0.13
2.34
0.34
40s
1.39
0.16
2.12
0.28
50s
1.40
0.15
2.01
0.26
60s
1.27
0.21
1.77
0.25
70s
1.27
0.21
1.75
0.28
Total n = 1002
65-74
75-84
85+
Mean
0.6
0.7
0.6
0.4
5th percentile
0.2
0.3
0.2
0.1
25th percentile
0.4
0.5
0.4
0.3
50th percentile
0.6
0.6
0.6
0.6
75th percentile
0.7
0.7
0.8
0.6
95th percentile
1.1
1.1
1.1
0.8
Total n = 1002
65-74
75-84
85+
Mean
0.9
1
0.9
0.7
5th percentile
0.2
0.4
0.3
0.2
25th percentile
0.6
0.8
0.6
0.4
50th percentile
0.9
1
0.9
0.7
75th percentile
1.1
1.3
1.1
0.9
95th percentile
1.7
1.7
1.7
1.3
Short Physical Performance Battery
Purpose:
![]()
Stay updated, free articles. Join our Telegram channel

Full access? Get Clinical Tree


