Chapter 36 Obesity
Overview
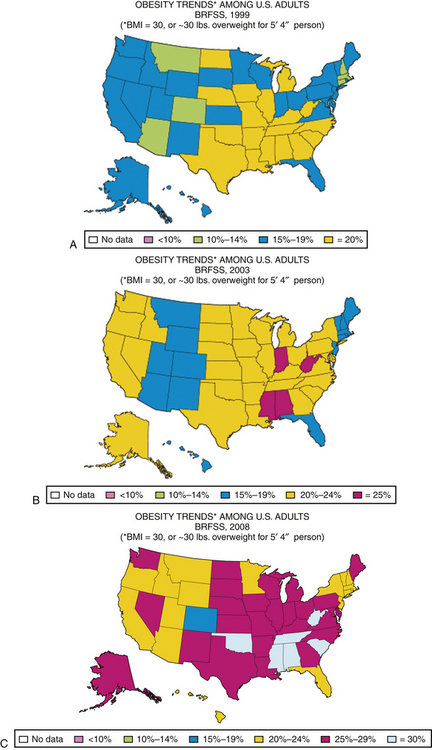
Obesity has been a rapidly developing health concern in the United States. The ongoing Behavioral Risk Factor Surveillance System (BRFSS) and National Health and Nutrition Examination Survey (NHANES) provide a longitudinal view of changes in the obesity problem. BRFSS data are from a state-based telephone survey, and NHANES data are based on measurements of a representative sample of the U.S. population. The self-reporting design of BRFSS tends to underestimate weight, but ongoing studies can be examined for trends. NHANES reported that the prevalence of U.S. adults in the overweight category (BMI ≥25 kg/m2) increased from 46% to 61% between the late 1970s and 1990s (Zimmerman, 2002). As of 1999–2000, 64.5% of adults were overweight and 30.5% were obese (BMI ≥30 kg/m2) (Flegal et al., 2002). Prevalence estimates from the Centers for Disease Control and Prevention (CDC) for 2007–2008 found that 32.2% of men and 35.5% of women were obese. In addition, surveys from 1976–1980 and 2003–2006 found that obesity increased from 5.0% to 12.4% among children age 2 to 5 years; from 6.5% to 17.0% for ages 6 to 11 years; and 5.0% to 17.6% for ages 12 to 19 years. Changes in obesity prevalence have affected all U.S. regions (Fig. 36-1).

Figure 36-1 U.S. maps reflecting changes in obesity prevalence estimates over time.
(Courtesy Centers for Disease Control and Prevention. Behavioral Risk Factor Surveillance System.)
Improved treatment of comorbidities has made assessing obesity’s impact on mortality more difficult, but estimates of the excess mortality associated with obesity in the United States range from 100,000 to 300,000 deaths each year. Persons in the overweight category have 20% to 40% increased mortality, and obese persons have a twofold to threefold increase in mortality (Adams et al., 2006).
Assessment
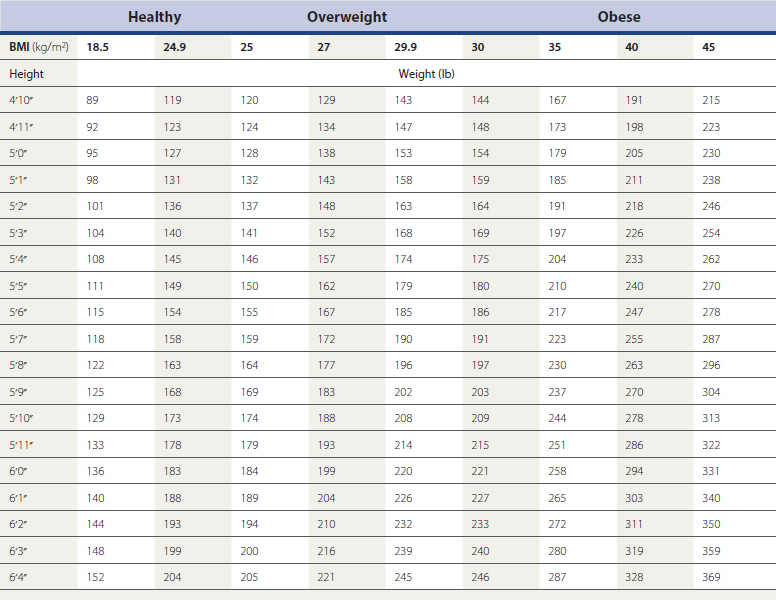
The primary parameter used to categorize weight is BMI: 18.5 and 24.9 is normal in adults; 25 to 29.9 is overweight; and 30 or greater is obese. Class III, “severe,” or “extreme” obesity is 40 and higher. Calculated from height and weight and expressed in kg/m2, BMI is a readily available tool in the assessment of obesity (Table 36-1). Because it correlates with total body fat and with the complications of obesity better than body weight, BMI is a recommended parameter to assess obesity, but an imperfect tool to measure adiposity. A high value may reflect greater lean body mass rather than adiposity in muscular individuals. In addition, BMI does not reflect distribution of body fat, a factor that influences risk.
From birth to age 2 years, overweight is assessed by the weight-for-length percentile; at or above the 95th percentile is considered overweight or obese. For the pediatric population age 2 to 19 years, percentile ranks based on the 2000 CDC growth charts for the United States are used to define overweight and obesity. The CDC defines overweight between ages 2 and 19 years as a BMI between the 85th and 95th percentiles for age and sex. A child or adolescent with BMI at or above the 95th percentile is considered obese.
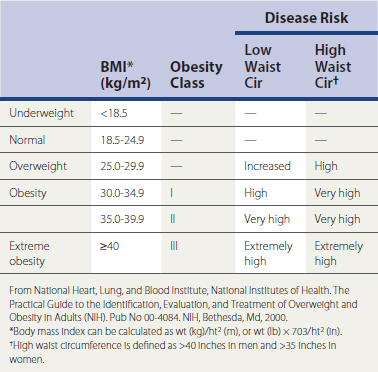
The distribution of body fat also affects health risks. Central obesity, also referred to as visceral, abdominal, or android obesity, is associated with a greater risk of complications, including the metabolic syndrome, as discussed later. Waist-to-hip ratio has been used to assess central obesity, but gender-specific waist circumference, taken at the level of the iliac crest, has proved to be a better assessment of the distribution of body fat. Health risks increase above a waist circumference of 35 inches in women and 40 inches in men, and as a continuous variable with increasing waist circumference, but these cutoffs facilitate a simple classification of risk in a continuous variable. Magnetic resonance imaging (MRI) and computed tomography (CT) of the abdomen have also been used to assess visceral deposition of fat in research settings, but cost and lack of easy accessibility make them impractical for clinical use. Table 36-2 lists the classification of obesity based on BMI and waist circumference.
Demographics
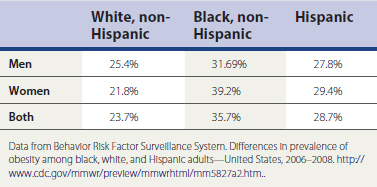
Obesity is a concern within virtually all demographic groups (Table 36-3). The high prevalence of obesity is seen in both genders, most ethnic groups, and at all ages. Within those groups, the impact is not uniform.
Education Level
Education level is inversely related to the risk of obesity, which may partly explain the decreased risk with increased socioeconomic status in developed countries. Access to health care, greater awareness of healthy lifestyle habits, and more access to recreational facilities are potential factors in this association.
Determinants of Obesity
Genetics vs. Lifestyle
Modulation of Appetite
Many hormonal factors are involved in appetite, as well as in the absorption, storage, and use of calories. Factors providing input to the brain include leptin levels, vagal afferent activity, and fluctuation in plasma glucose levels. Neuropeptides and monoamine neurotransmitters are also involved in appetite control. Some weight loss medications exert their influence through modulation of neurotransmitter levels, which may affect appetite or satiety.
Influences on Central Obesity
Central obesity suggests increased visceral fat deposits, likely caused by increased production of peptides and other metabolic messengers. Hormonal influences most likely play a role in the distribution of fat. Central obesity is believed to result partly from increased androgenic effects, which is why men have a greater tendency for central obesity. Central obesity is also associated with hyperandrogenic states in women, such as polycystic ovary syndrome (PCOS). The increase in visceral deposition of fat that can occur after menopause in women may be related to a decrease in growth hormone and estrogen production (see Chapter 35).
Lifestyle Influences
Endocrine and Metabolic Factors
Specific identifiable endocrine or metabolic disorders known to cause obesity account for less than 1% of the obese population, contrary to what is commonly believed (see also Chapter 34).
Medical Complications
Type 2 Diabetes Mellitus
According to BRFSS, the prevalence of type 2 diabetes mellitus (T2DM) increased from 4.9% in 1990 to 7.9% in 2000 (Mokdad et al., 2003). This change has been clearly linked to the increase in obesity. The risk of T2DM is lowest below a BMI of 22 to 23 kg/m2. At a BMI of 31, the risk for women in the NHS was 40-fold greater than in women with a BMI less than 22 (Colditz et al., 1995). For men in the Health Professionals Follow-up Study, the risk of T2DM above a BMI of 35 kg/m2 was increased 60-fold. Up to 80% of cases of T2DM can be attributed to overweight and obesity. There appears to be a time delay of about 10 years between the development of overweight and onset of the diabetes (Bray, 2003). As weight increases, insulin resistance and compensatory insulin secretion also increase. At some point, the body’s ability to secrete insulin does not meet requirements, and blood glucose rises. Weight loss is recommended to lower elevated glucose levels in overweight and obese persons with T2DM.
Stay updated, free articles. Join our Telegram channel

Full access? Get Clinical Tree


