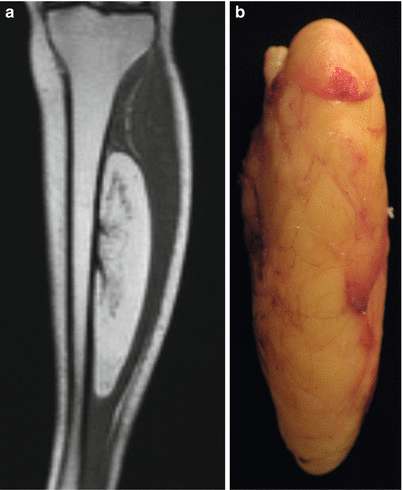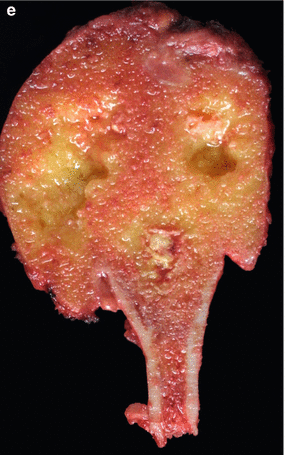
Fig. 41.1
(a) Radiograph of a lipoma in the proximal end of the fibula with some central areas of calcification. (b) MPR CT of same case. Coronal view. (c) MRI T1-weighted image, coronal view. Lesion signal intensity is similar to normal adipose bone marrow. (d) MRI DP fat-saturated image, coronal view. Lesion presents the same signal as normal adipose bone marrow. (e) Specimen cut surface with characteristic yellowish color
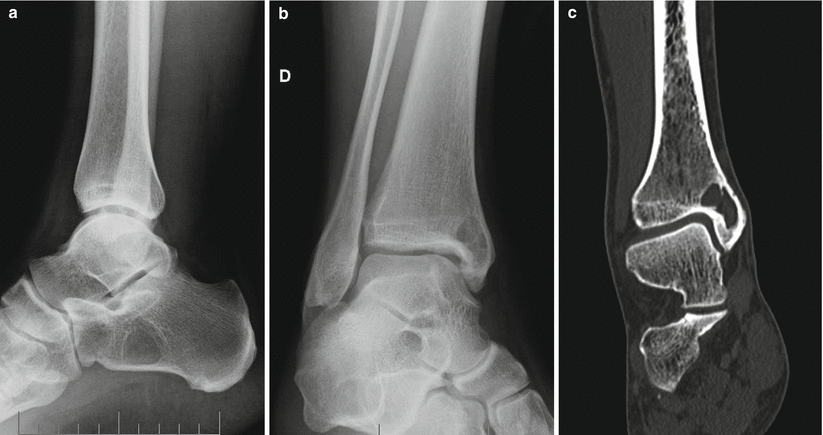
Fig. 41.2
(a–c) Radiograph and CT of a case of multiple lipomas: in a characteristic calcaneal location and in the lower tibia
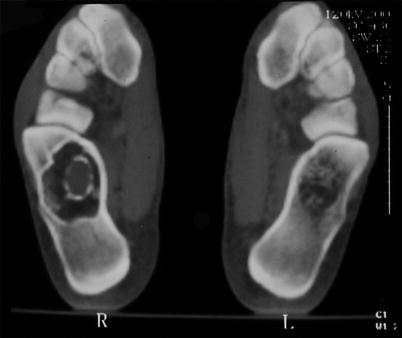
Fig. 41.3
Bilateral calcaneal lipomas with central mineral calcifications, a common finding