Chapter 8 Interpreting the Medical Literature
Applying Evidence-Based Medicine in Practice
Building Clinical Evidence from Published Research
In Chapter 10, information from the Women’s Health Initiative (WHI) about HRT is considered, and similar epidemiologic and statistical issues are covered. Chapter 10 emphasizes the importance of how risk data are framed or presented to the patient and the primacy of patient preference (i.e., ability to make informed decisions about therapy). Unfortunately, evidence concerning the ideal manner of presenting information to patients and clinicians and promoting informed decision-making is still scant. This chapter and Chapter 10 take a slightly different approach to similar clinical questions, and together, these two chapters provide the background for the motivated family physician to better understand concepts of risk and probability and to foster enhanced physician-patient decision-making.
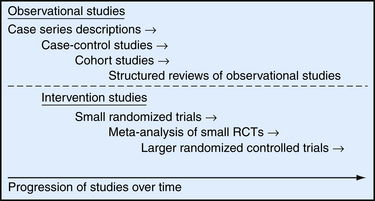
Evidence for interventions such as HRT usually begins with observational studies, including unblinded case series, case-control studies, and cohort studies, and it culminates in randomized, controlled trials (RCTs) (Figure 8-1). To better understand how we arrived at the current clinical understanding of HRT and its effects on heart disease, we review the progression of research studies and evidence over the past 30 years. A series of observational studies in the 1970s and 1980s led to regular prescribing of HRT to prevent a number of significant health conditions in postmenopausal women.
The Power of Randomized, Controlled Trials
In RCTs, study participants are randomly allocated to two or more groups and then assigned to receive an intervention such as HRT or to receive no active treatment (i.e., placebo or to continue with their usual care). RCTs greatly add to the confidence of measured results because the structure of an RCT helps to eliminate many of the inherent biases that are in observational studies. For example, in cohort studies of HRT and CHD, it is hypothesized that women who choose to take HRT are generally healthier and have better healthy lifestyle practices than women who do not choose to take HRT. Because participants in an RCT are randomly assigned to treatment and control groups, they are less likely to have differences in other factors that might prevent or promote heart disease.
Understanding the Statistical Significance of Study Results
Reports from RCTs such as the WHI study frequently include relative risk as a summary measure of differences between the treatment and placebo groups (Table 8-1). To arrive at the relative risk, the researcher first measures the incidence rate of an outcome in each of the two study groups (i.e., treatment and placebo). The incidence rate for each group is a ratio of the number of new outcome events, such as CHD events, divided by the number of patients at risk for the outcome in that group over a specific period. In multiyear studies, the average annual incidence rate is often reported as a summary measure. In a placebo-controlled RCT, the relative risk is then calculated as a ratio of the incidence rate for the treatment group divided by the incidence rate for the placebo group (Table 8-2).
Table 8-1 Understanding Study Results
| Typical summary rates from randomized, controlled trials: |
 |
 |
| Summary measures that may be more meaningful for clinicians: |
 |
 |
Table 8-2 Examples of Summary Rates from the Women’s Health Initiative (WHI) Study
| The following equations show how to take a summary rate commonly reported in published studies (i.e., relative risk) and calculate a summary measure (e.g., number needed to treat, number needed to harm) that may be more useful in describing the results to clinicians and patients. The example considers the average annual incidence rates and relative risk for coronary heart disease (CHD) events in the WHI study on the effects of hormone replacement therapy (HRT): |
 |
 |
 |
| The relative risk describes a relative 29% increase in CHD events. It may be more useful to consider the absolute difference in incidence rates between the two groups to understand the magnitude of the potential risk for a given patient: |
 |
| The number needed to harm (NNH) can be calculated to describe, on average, how many women must be treated for 1 year to cause one additional CHD event attributable to HRT: |
 |
Data from Ebell MH, Messimer SR, Barry HC. Putting computer-based evidence in the hands of clinicians. JAMA 1999;28:1171-1172.
Confidence intervals are much more informative than p values. When relative risk is reported as the summary result of a study, the 95% confidence interval (CI) is often used to give an indication of the precision of the estimated relative risk. The 95% CI describes the range within which there is a 95% probability that the true relative risk (RR) is in that range. An RR of 1.0 indicates no difference. For example, if a study reported an RR of 2.5 with a 95% CI of 2.3 to 2.7, we could be reasonably certain (95% certain) that the true RR was no less than 2.3 and no greater than 2.7. Our conclusion would be that the estimated RR of 2.5 is fairly precise. However, if RR was reported as 2.5 with a 95% CI of 1.1 to 5.0, the true RR could be as low as 1.1 (almost no difference) or as high as 5.0 (a fivefold difference), an obviously imprecise estimate of the relative risk.
Interpreting Study Results: Statistical and Clinical Significance
Although the WHI showed a statistically significant increase in the relative risk of CHD events among women who were randomly assigned to take HRT, it is important to consider the absolute difference in CHD events between the two groups to understand the strength of the association and to discuss the risk of HRT treatment with individual patients. Calculating absolute risk (in addition to relative risk) is a helpful way to understand the level of risk that HRT may add for a group of women who are at risk for CHD events (see Table 8-2).
When reported in terms of relative risk, the weight of the association between HRT and CHD sounds ominous (i.e., a 29% increase). However, in terms of absolute risk attributable to HRT treatment, a less portentous picture emerges (see Table 8-2). In the WHI study, women taking HRT had an average rate of CHD events of 0.37% per year, an average of 37 events per 10,000 women each year, and those in the placebo group had an annual rate of 0.30%, or 30 events per 10,000 women each year. Although the adjusted RR of CHD is 1.29 (0.37 divided by 0.30), the attributable risk or risk difference between the two groups is 0.07% (0.37 minus 0.30). In other words, approximately seven additional cases of CHD occurred for 10,000 women using HRT during each year over the course of the study. The attributable risk of the treatment group can be summarized as the number needed to harm (NNH) or, if a study reports a beneficial effect, the number needed to treat (NNT). In this case the NNH was approximately 1430; on average, for every 1430 patients treated with HRT, one additional CHD event occurred (i.e., the inverse of the risk difference, 0.07, or 10,000 divided by 7) (see Table 8-2). The NNH or NNT is often a more understandable and useful summary of study outcomes when physicians and patients weigh the risks and benefits of a particular therapy.
Related posts:

Stay updated, free articles. Join our Telegram channel

Full access? Get Clinical Tree


