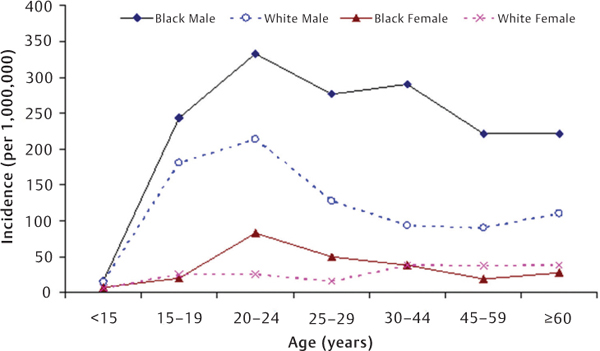
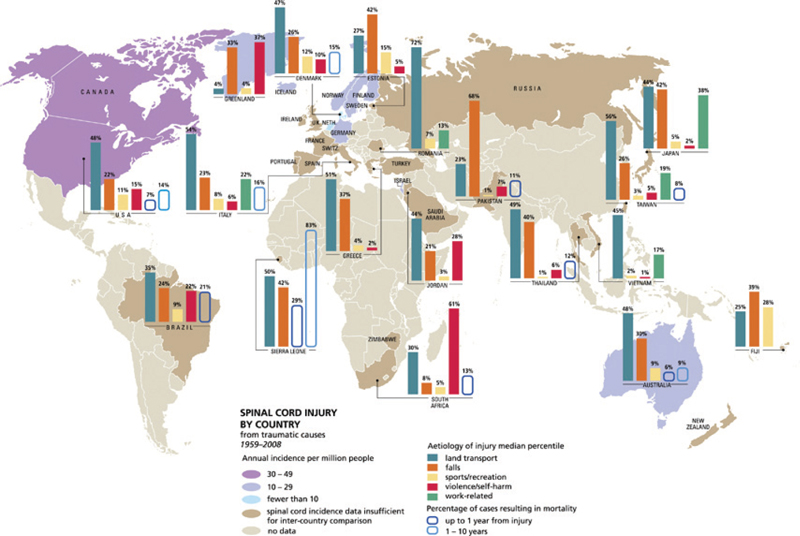
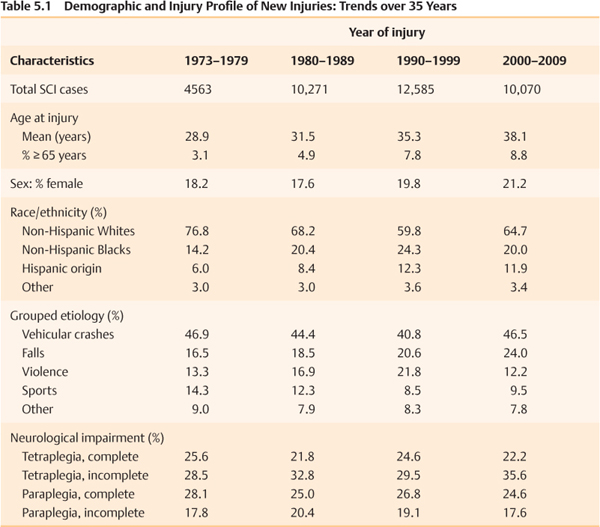
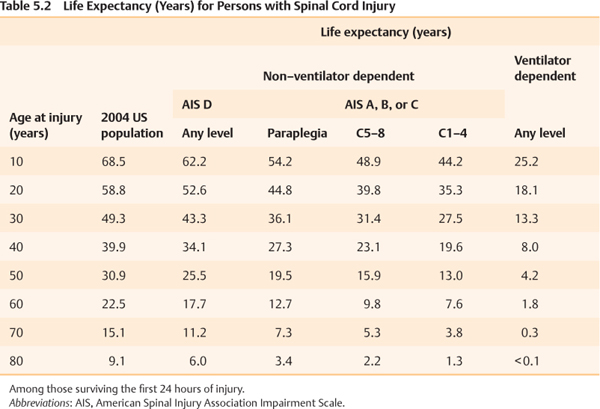
5 Key Points 1. The epidemiological statistics relating to spinal cord injury (SCI) are bittersweet: relatively low incidence, young age of most victims, typically with lifelong disability, high costs of health care, yet mostly preventable. 2. This chapter reviews the basic facts and figures about SCI, including incidence, prevalence, life expectancy, etiologic risk factors, neurological deficits, associated injuries, and trends over time in the United States. 3. It is hoped that the prevention and control of SCI as well as the planning and coordination of SCI care and services over a patient’s lifetime will be significantly improved through a better understanding of SCI epidemiology. Spinal cord injury (SCI), typically defined as an acute traumatic lesion of the spinal cord resulting in any degree of sensory/motor deficit or bladder/bowel dysfunction temporarily or permanently,1 accounts for only a small proportion of all injuries; but the associated disabilities and life changes render SCI one of the most catastrophic injuries. Because disabilities are typically permanent, yet many SCIs are potentially preventable, understanding the epidemiological profile of SCI is essential for injury prevention and control and also for strategic planning of clinical and supportive SCI services throughout the region and country. This chapter uses data from the statewide population-based surveillance systems in the United States, the National SCI Statistical Center (NSCISC), and several population-based studies to summarize the quantitative and qualitative features of SCI. To better estimate the impact of SCI, beginning in the early 1980s, many US states established a population-based surveillance system and mandated by law the reporting of new cases of SCI to state health departments.1 Hospitals were the primary sources of information, but some states also required reporting from public/private health and social agencies, physicians, emergency medical services staff, and chief medical examiners. Based on reports published by the state SCI registries2–13 and previous incidence studies at the regional14–17 and national levels,18–20 the annual incidence of SCI in the United States varies from 25 new cases per million population in West Virginia from 1985 to 19882 to 83 new cases per million population in Alaska from 1991 to 1993.13 Taking all estimates together, excluding those who die at the scene of the accident, the average is ∼ 40 new SCI cases per million population per year. Given the current size of the US population, this totals ∼ 12,000 new SCIs each year. The incidence of prehospital SCI deaths has been estimated by several studies,11,12,16,17 ranging from four cases per million in Utah from 1989 to 1991 to 21 cases per million in Northern California from 1970 to 1971. The incidence of SCI is typically reported to be lowest for the pediatric group and highest for persons in their late teens and twenties and declines consistently thereafter; this is supported by virtually all previous incidence studies. SCI occurs predominantly among men across all age groups. The male to female incidence rate ratio is about 4:1 and varies by age.2,8,10–12 The incidence rates are higher for blacks than for whites, especially among men and for violence-related SCI. The whites to blacks incidence rate ratio is 1.4:2.0 overall8,10,11,14,17,18 but is 6.3:17.8 for SCI with violence-related etiology.5,8,10,11 Using the state of Mississippi as an example, the relative incidence of SCI between male and female, between blacks and whites, and across age groups is depicted in Fig. 5.1.11 Approximately 22 to 50% of new SCI cases report alcohol use or test positive for blood alcohol at the time of injury.2,8,10–14,20,21 The association with alcohol consumption is particularly common among Native Americans, with injuries occurring between 10 pm and 4 am, pedestrian injuries, and cervical injuries.10,13,21 SCI occurs most frequently on weekends, accounting for ∼ 55% of total injuries.8,22 The incidence of SCI also increases during the warm weather months, with 38 to 44% of total injuries occurring during May through August,8,22 which is largely attributable to higher frequencies of diving and other recreational sport mishaps in summer. Fig. 5.1 Annual incidence rate (per million population) of spinal cord injury in Mississippi, United States 1992–1994.11 External causes of SCI are often grouped into five categories: motor vehicle crashes, violence, sports/recreational activities, falls, and all other causes. Vehicular crashes, predominantly automobile crashes, are the leading cause of SCI in all US states and across sexes and racial groups except blacks, for whom violence is also a common cause. For example, in the state of Oklahoma, the annual incidence of SCI from violence is the same as that from vehicular crashes in the black population—21 new cases per million. Approximately 74% of violence-related SCIs are due to gunshot wounds.10 Falls are typically the next leading cause of injury, followed by sports/recreational activities. Approximately 72% of falls are attributable to falls from a height, whereas diving mishaps account for ∼ 46 to 75% of SCIs due to recreational sports.8,10,22 Acts of violence are usually reported as the fourth leading grouped etiology of SCI among whites. The injury etiology also varies by age groups.8,10,23 The recreational sport mishaps are common among persons younger than 15 years of age, whereas falls rank first among persons older than age 65 years. The activity that has a high frequency as a cause of injury may suggest being risky to a specific group, but also could be attributable to a relatively high participation rate of such an activity among this specific group. Work in understanding the global epidemiology of SCI has been prolific. Foremost in this work is the recent establishment of a living data repository structure by the International Spinal Cord Society to allow documentation and mapping of SCI statistics around the world24 (http://www.iscos.org.uk/page.php?content=57). For example, the incidence rate is noted to be more than twice as high in North America than in Australia (15 per million) and western Europe (16 per million). The external cause of injury also varies by countries and regions (Fig. 5.2). The international variation could be explained, to a large extent, by the differences in underlying population characteristics (age, race, sex) and external factors (urbanization, road condition, policy measures, such as implementation of seat-belt restraint laws, etc.). It can also be attributable to the differences in reporting procedures, case definition, and completeness of case ascertainment. Fig. 5.2 Global mapping of spinal cord injury from traumatic causes by country 1959–2008. (From Cripps RA, Lee BB, Wing P, Weerts E, Mackay J, Brown D. A global map for traumatic spinal cord injury epidemiology: towards a living data repository for injury prevention. Spinal Cord 2011;49:493–501. Reprinted with permission.) There have not been any population-based incidence studies of SCI in the United States since the early 1990s. It is not clear whether the incidence has changed in recent years. Data from the SCI Model System, however, provide insight into the relative contribution of each factor to the occurrence of SCI over time. The regional SCI Model System program was established in the early 1970s with funding from what is now the National Institute on Disability and Rehabilitation Research. All Model System centers are required to collect and submit data on their patients to a national database managed by the NSCISC.24 As of April 2009, this database contains data from 26 SCI Model System centers on 37,489 patients injured between 1973 and 2009. Analyzing data from the NSCISC database, we observed a steady increase in age at injury over time, from an average of 28.9 years in 1973 to 1979 to 38.1 in 2000 to 2009 (Table 5.1). The percentage of individuals who are age 65 or older has also increased from 3.1% to 8.8% during the same period. The male to female ratio changed from 4.5 in 1973 to 1979 to 3.7 in 2000 to 2009. Moreover, a substantial trend has also been observed in the racial/ethnic distribution of persons enrolled in the NSCISC database over time, the percentage of persons of Hispanic origin increasing from 6.0% to 11.9% over the last 3 decades. Vehicular crashes have consistently been the leading cause of injury among persons who are enrolled in the NSCISC database (Table 5.1). The percentage of SCIs from falls has increased steadily over time, from 16.5% during 1973 to 1979 to 24.0% in 2000 to 2009. The percentage of violent etiology increased substantially between 1973 and 1999, but significantly dropped in 2000 and after. Sporting injuries continuously declined for ∼ 25 years and were steady over the past 10 years. The proportional nature of these statistics can only reflect the relative importance of the contribution of these external factors to the causation of SCI but cannot present the underlying changes in the cause-specific incidence over time. Population-based studies are needed to further understand these trends in external causes of injury and also in the demographic profile of SCI. The level of SCI as classified by the International Standards for Neurological Classification of Spinal Cord Injury,25 is mostly at the cervical level among persons in the NSCISC database (53.2%), followed by thoracic (35.6%) and lumbosacral levels (11.2%). The most common segment is C5 (15.4%) and C4 (14.4%), followed by C6 (10.9%), T12 (6.7%), C7 (5.4%), and L1 (5.1%).26 At the time of discharge from in-patient rehabilitation, 47.5% of persons have neurologically complete injuries according to the American Spinal Injury Association (ASIA) Impairment Scale (AIS A), 10.7% have incomplete injuries with sensory sparing (AIS B), 12.0% have incomplete injuries with nonfunctional motor capabilities below the lesion level (AIS C), 29.1% had incomplete injuries with functional motor capabilities below the lesion level (AIS D), and 0.7% had essentially complete neurological recovery (AIS E).26 External causes of injury play a meaningful role in determining the preserved neurological function.8,23,26 Approximately three quarters of violence-related SCIs result in paraplegia, with 1.5 times more complete injuries than incomplete injuries (42.5% vs 25.6%).23 In contrast, up to 88.0% of recreational sports-related SCIs result in tetraplegia with an almost identical frequency of complete and incomplete injuries (43.5% vs 44.5%). Vehicular crashes and falls usually result in tetraplegia, 54.9% and 57.7%, respectively, and incomplete tetraplegia is slightly more common in falls than in vehicular crashes (37.2% vs 32.3%).23 There seems to be a trend toward increased likelihood of an incomplete cervical injury over the last 3 decades (Table 5.1). As the frequency of violence-related SCI decreases, the percentage of paraplegia seems to decrease over the past 20 years. Life expectancy of persons with SCI has improved significantly during the past few decades but remains below normal.27 The NSCISC data show that the overall mortality is ∼ 4.5% during the first year of injury, 2.1% at postinjury year 2, and 1.3 to 2.5% per year thereafter.26 The median life expectancy is ∼ 33 years after injury but varies considerably by level and completeness of injury, status of ventilator use, age, sex, and other factors.27,28 The recent estimates of life expectancy from the NSCISC databases are depicted by age at injury, ventilator dependency, and level and completeness of injury in Table 5.2. Prevalence reflects the number of persons with an SCI who are currently alive, which is primarily a function of incidence (number of new cases each year) and mortality (number of deceased cases each year). The prevalence of SCI has been estimated by studies that were based on the mathematical relationship of incidence, survival, and prevalence29,30; extrapolated data from a regional disability survey31; data from the National Health Interview Survey32; and involved a nationwide probability sample of small geographic areas and institutions.33 The reported prevalence ranges from 525 cases per million population in 1975 to 1124 cases per million population in 1981. Utilizing a complex mathematical model including age-sex-specific incidence, survival, and baseline prevalence, a recent study estimated ∼ 250,000 persons living with SCI in 2004 in the United States and projects an increase to 270,000 persons in 2014 due to improved life expectancy.34 The average age of all persons living with SCI using this calculation, including new and existing cases, in the United States has been estimated to be 41 years in 1988, which is ∼ 10 years older than the average age among new cases in the NSCISC database during the same period. In the report published by Berkowitz et al. in 1988, 5.4% of those with SCIs were below age 25, 54.2% were aged between age 25 and 44, 27.8% between age 45 and 64, and 12% were aged 65 or older.35 Because women usually have a longer life expectancy than men, the male to female prevalence ratio is typically lower than that observed among new SCI cases (2.6 vs 4.0). The white to nonwhite ratio among persons with SCI who were alive in 1988 was 1.5, similar to the ratio among new cases.35
Epidemiology of Traumatic Spinal Cord Injury
 Incidence
Risk Factors for Spinal Cord Injury
External Causes of Injury
International Variation
 Trends
 Level and Completeness of Injury
 Life Expectancy
 Prevalence
Demographic Profile of Prevalent Cases
Related posts:
 Pharmacotherapy in Acute Spinal Cord Injury: Focus on Steroids
Spontaneous Recovery Patterns and Prognoses after Spinal Cord Injury
Glial Scar and Monocyte-Derived Macrophages Are Needed for Spinal Cord Repair: Timing, Location, and Level as Critical Factors
The Human Central Pattern Generator and Its Role in Spinal Cord Injury Recovery
Spinal and Supraspinal Plasticity after Spinal Cord Injury
Research in Spinal Cord Injury: Building an Effective Translational Research Program
Pharmacotherapy in Acute Spinal Cord Injury: Focus on Steroids
Spontaneous Recovery Patterns and Prognoses after Spinal Cord Injury
Glial Scar and Monocyte-Derived Macrophages Are Needed for Spinal Cord Repair: Timing, Location, and Level as Critical Factors
The Human Central Pattern Generator and Its Role in Spinal Cord Injury Recovery
Spinal and Supraspinal Plasticity after Spinal Cord Injury
Research in Spinal Cord Injury: Building an Effective Translational Research Program
Stay updated, free articles. Join our Telegram channel

Full access? Get Clinical Tree


