Diagnostic Imaging Techniques of the Foot and Ankle
Imran M. Omar
Diagnostic imaging of the foot and ankle has made numerous advancements in the last 25 to 30 years and allows rapid, noninvasive, high-resolution depiction of anatomy and pathology. Technical advances in magnetic resonance imaging (MRI), including faster gradients, higher field strength magnets, and better coils; in computed tomography, including the advent of helical acquisition and multidetector capabilities; and in ultrasound, including higher frequency transducers, have allowed better understanding of foot and ankle pathology and associated findings. For example, high frequency ultrasound is well suited to examine superficial structures commonly encountered in the musculoskeletal system (like peripheral nerves, tendons, and ligaments) and visualization of structures during real-time scanning can be used to give physiologic or biomechanical information such as detecting abnormal tendon subluxation or ligament insufficiency during dynamic or stress maneuvers.1
Imaging of the foot and ankle is particularly challenging for several reasons. There are numerous small structures in close proximity with complex, nonlinear courses, such as the lateral ankle ligaments and intrinsic musculature, which can be difficult to distinguish without thorough understanding of the anatomy. Many of these structures are difficult to see without proper patient positioning, optimization of the plane of scanning to image the desired anatomy, or adjusting image acquisition parameters to obtain the highest possible resolution. Furthermore, patient positioning and imaging planes may not be standardized between institutions which may cause differences in the appearance and orientation of structures. Therefore, imagers must be aware of these differences in the appearances of certain structures based on patient positioning in order to avoid misinterpretation.
Moreover, on cross-sectional imaging, there is no consensus on nomenclature of standard orthogonal imaging planes, especially in the forefoot. In the hindfoot/ankle the axial, sagittal, and coronal planes are contiguous with the lower extremity. However, in the forefoot, some imagers refer to the short axis as the axial plane, whereas others refer to it as the coronal plane. This may cause confusion when reported findings are communicated to others. Thus, it is important to describe suspected sites of pathology on several planes whenever possible.
Finally, ultrasound in particular is highly dependent on probe positioning and often relies on smaller field-of-view images than other imaging modalities. This makes sonographic images difficult to reproduce and may not allow the study interpreter to adequately place suspected pathology within an anatomic context.
However, with increasing utilization of diagnostic imaging in the foot and ankle, imagers and clinicians are becoming more aware of these considerations. This will help to mitigate the impact the issues may have and further improve the diagnostic capabilities of noninvasive imaging.
RADIOGRAPHY
Conventional radiography is the standard initial diagnostic imaging modality to assess the foot and ankle.2 A number of factors allow radiography to serve as an excellent survey modality in the musculoskeletal system. First, this modality has superior spatial resolution of osseous structures compared to MRI and offers strong contrast resolution to discriminate between bone, metal, calcification, fat, and soft tissues. Therefore, it provides a detailed anatomic assessment of the bones to help diagnose fractures, identify and characterize areas of periosteal reaction and osteolysis, and evaluate osseous alignment in order to suggest biomechanical alterations or sites of related injuries. Moreover, radiographs can depict areas of soft-tissue swelling or calcifications, which often allows diagnosis of specific pathologies or limits the differential diagnosis to help guide further diagnostic testing.2 Compared with cross-sectional imaging modalities, radiographs are relatively resistant to artifacts from metals, which can degrade other imaging studies and render them unable to be interpreted.3 As a result, radiographs are helpful in assessing for orthopedic hardware alignment and potential complications such as fractures or loosening.
Additionally, radiographs can be obtained fairly quickly and inexpensively, which helps clinicians and imagers to make decisions and initiate therapy in a timely manner. Furthermore the images are reproducible, with most institutions obtaining standard views of the foot and ankle, including anteroposterior (AP) (Fig. 13.1), lateral (Fig. 13.2), mortise (Fig. 13.3), and possibly oblique images (Fig. 13.4) of the ankle and AP
(Fig. 13.5), lateral (Fig. 13.6), and oblique (Fig. 13.7) images of the foot. Additional standard radiographic protocols are available for bones like the calcaneus (Figs. 13.8 and 13.9) and sesamoid bones (Figs. 13.10 and 13.11); which may be difficult to characterize on standard ankle or foot radiographs. The guidelines for obtaining many of these projections—including the descriptions for acquiring the standard views outlined in the figure legends in this chapter—have been established for many years, having been compiled in the current standard text Merrill’s Atlas of Roentgenographic Positions since 1949.4, 5 As such, diagnostic radiographs performed at one institution can also be interpreted by other institutions and radiographs of the same body parts can be serially obtained, allowing radiographic follow-up and helping to guide longitudinal management of patients.
(Fig. 13.5), lateral (Fig. 13.6), and oblique (Fig. 13.7) images of the foot. Additional standard radiographic protocols are available for bones like the calcaneus (Figs. 13.8 and 13.9) and sesamoid bones (Figs. 13.10 and 13.11); which may be difficult to characterize on standard ankle or foot radiographs. The guidelines for obtaining many of these projections—including the descriptions for acquiring the standard views outlined in the figure legends in this chapter—have been established for many years, having been compiled in the current standard text Merrill’s Atlas of Roentgenographic Positions since 1949.4, 5 As such, diagnostic radiographs performed at one institution can also be interpreted by other institutions and radiographs of the same body parts can be serially obtained, allowing radiographic follow-up and helping to guide longitudinal management of patients.
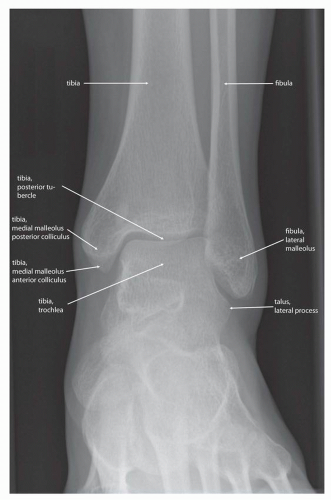 Figure 13.1 Anteroposterior ankle radiograph. In a standard anteroposterior image of the ankle the patient is imaged with the leg extended and the patient supine. The foot is positioned so its long axis is approximately perpendicular to the long axis of the lower extremity. The x-ray beam is centered between the malleoli at the tibiotalar joint. The image should include the distal third of the tibia and fibula to the proximal metatarsals. The talar dome is seen in profile. There is mild overlap of the lateral malleolus and the lateral talus whereas the medial tibiotalar joint is open. Weight-bearing views are also commonly performed. In this instance the patient is erect on the platform with the heels abutting the image receptor (IR) and the toes directed forward. Both feet are often included on the same image for comparison. |
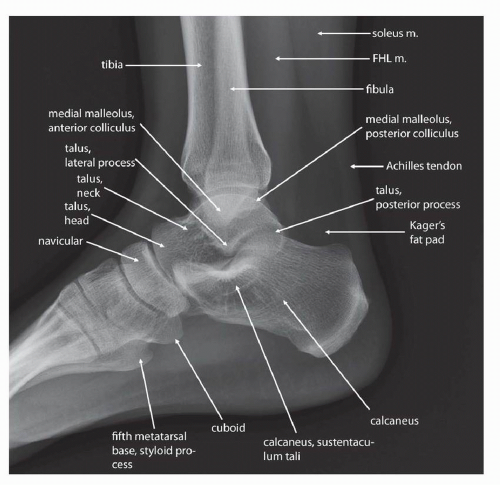 Figure 13.2 Lateral ankle radiograph. On the lateral radiograph either mediolateral (ML) or lateromedial (LM) images can be performed. In the ML image the lateral margin of the foot is placed against the image receptor (IR) with the long axis of the IR parallel to the long axis of the lower extremity. As in the anteroposterior view the foot is positioned so its long axis is approximately perpendicular to the long axis of the lower extremity. Alternatively, the LM view is performed with the medial portion of the foot against the IR. Although the ML view is generally more comfortable, the LM view more commonly represents a true lateral of the foot and ankle in which there is greater superimposition of the metatarsals. The beam is centered about 2 cm above the inferior tip of the lateral malleolus. The standard image shows the medial and lateral margins of the talar dome in profile overlapping one another. The fibula should project over the posterior half of the tibia, the medial malleolus should be slightly anterior to the lateral malleolus, and the base of the fifth metatarsal should be visible. |
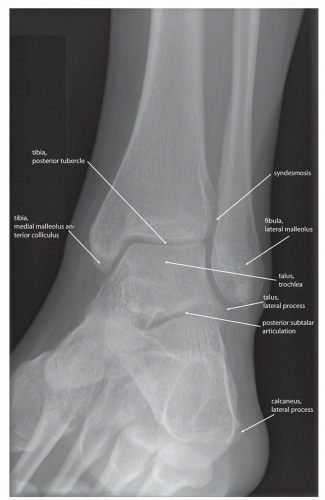 Figure 13.3 Mortise view. This view is more common than internal oblique ankle radiographs and is useful for examining the talar dome in profile. The patient is placed between 15 and 20 degrees of internal rotation with the long axis of the foot perpendicular to the long axis of the calf. The x-ray beam is centered between the malleoli at the tibiotalar level. In this view there is no overlap of the lateral malleolus and the lateral talus. However, there is mild overlap of the distal tibia and fibula. Normally, there is uniform joint space width along the tibiotalar and talofibular articulations measuring approximately 5 mm. |
On the other hand, a few limitations of conventional radiography have necessitated the development of additional imaging modalities. Although radiographs are very good for depicting osseous pathology they are less helpful than cross-sectional techniques in evaluating soft-tissue derangements.3 Unless there is a significant fat component or calcification, the soft tissues often have similar attenuations which may make discriminating soft-tissue structures and pathology difficult.
Because radiographs are two-dimensional representations of three-dimensional structures the images rely on proper patient and x-ray beam positioning to prevent superimposition of bones and other radiopaque structures. The perspective of anatomic structures and the way the structures are radiographically depicted change depending on the orientation of the x-ray beam with respect to the structures being imaged, a principle known as parallax.6 Awareness of parallax is important in properly positioning patients, especially in foot and ankle imaging because subtle alterations in the x-ray beam orientation can obscure areas of interest. For example, a true AP radiograph of the foot often distorts the appearance of the tarsometatarsal joint, whereas angulating the x-ray beam toward the heel by
about 10 degrees often shows the joint in profile and may help to better show subtle pathologies such as Lisfranc fracture-dislocations (see Fig. 13.5). AP weight bearing of both feet on the same cassette is essential to detect subtle diastasis between the first and second metatarsal bases as well as the first and second cuneiforms (see Fig. 13.5C). In many instances this overlap is unavoidable and certain structures cannot be adequately assessed on standard projections. For example, on standard forefoot radiographs, the sesamoid bones overlap with one another or the metatarsal head which may preclude their thorough assessment and require additional views for better radiographic evaluation. Pronation and abduction stress tests of the forefoot can be useful as well.
about 10 degrees often shows the joint in profile and may help to better show subtle pathologies such as Lisfranc fracture-dislocations (see Fig. 13.5). AP weight bearing of both feet on the same cassette is essential to detect subtle diastasis between the first and second metatarsal bases as well as the first and second cuneiforms (see Fig. 13.5C). In many instances this overlap is unavoidable and certain structures cannot be adequately assessed on standard projections. For example, on standard forefoot radiographs, the sesamoid bones overlap with one another or the metatarsal head which may preclude their thorough assessment and require additional views for better radiographic evaluation. Pronation and abduction stress tests of the forefoot can be useful as well.
 Figure 13.4 Oblique ankle radiograph. This view is usually performed to see the distal tibiofibular (syndesmosis) joint in profile (white arrow) and is obtained with the patient in approximately 35 to 45 degrees of internal rotation. The patient is imaged with the foot in 10 to 15 degrees of plantar flexion which prevents overlap of the posterior calcaneus and lateral malleolus. The externally rotated oblique is less commonly obtained but may be useful in assessing the anterior tibial tubercle and the lateral malleolus. |
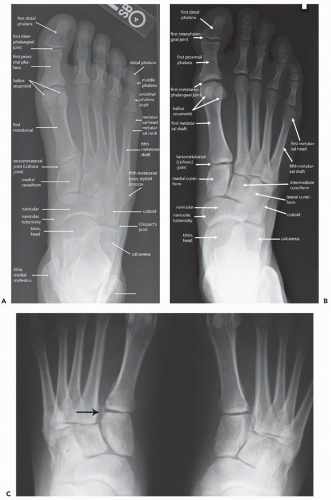 Figure 13.5 Anteroposterior foot radiograph. (A) The anteroposterior radiograph of the foot is obtained with the patient supine and the knee flexed so that the sole of the foot rests on the table. The x-ray beam is centered at the third metatarsal base. The beam may be perpendicular to the table (A) or may be angulated about 10 degrees toward the heel (B) to view the tarsometatarsal joint in profile. This subtle difference is an example of how parallax affects the image. On the standard image the articulation between the medial and intermediate cuneiforms is seen in profile—the second, third, and fourth metatarsal bones are evenly spaced and the second through fifth metatarsal bases overlap. (C) Weight-bearing anteroposterior radiograph of both feet shows diastasis between the base of the first and second metatarsals (arrow) on the left as well as intercuneiform diastasis proximally. |
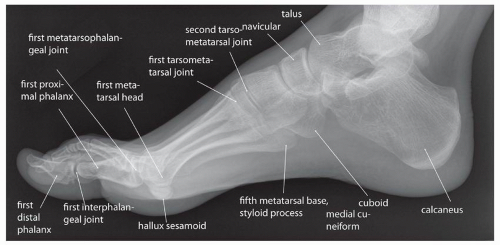 Figure 13.6 Lateral foot radiograph. As in the lateral ankle radiograph the lateral foot radiograph can be performed in the mediolateral or lateromedial positions. The lateromedial is usually less comfortable but more reliably produces a standard lateral image. The foot should be positioned so its long axis is perpendicular to the long axis of the calf and the x-ray beam is directed at the third metatarsal base. In this view the metatarsals are superimposed and the fibula projects over the posterior tibia. Because there may be slight distortion in the appearance of the subtalar and tibiotalar joints compared with a lateral ankle radiograph the lateral foot radiograph should not substitute for a true lateral ankle radiograph. |
 Figure 13.7 Internally rotated oblique radiograph. This view is best used to image the cubocalcaneal, cubocuneiform, and cubometatarsal joints which are seen in profile. The patient is supine with the knee flexed and the plantar surface of the foot resting on the table. The thigh is then internally rotated to make a 30-degree angle opening laterally between the sole of the foot and the table. The x-ray beam should be centered at the third metatarsal base. On this image the fifth metatarsal base is well seen and there is no overlap of the third, fourth, or fifth metatarsal bases. Occasionally, an externally rotated oblique may be performed with external rotation of the thigh that produces a 30-degree angle opening medially between the sole of the foot and the table. This view is better for looking at the medial and middle cuneiforms, first and second metatarsals, and navicular. |
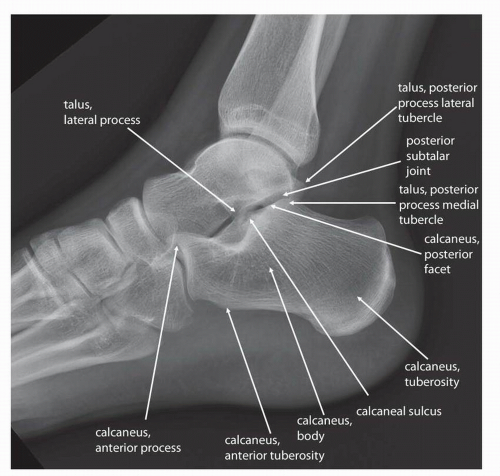 Figure 13.8 Lateral calcaneus radiograph. This is a mediolateral view with the lateral aspect of the foot resting on the image receptor The x-ray beam is centered on the central calcaneal body, approximately 2.5 cm distal to the medial malleolus. There should be no calcaneal rotation, the sustentaculum tali and lateral calcaneal tuberosity should be visible, and the subtalar joint should be seen in tangent. |
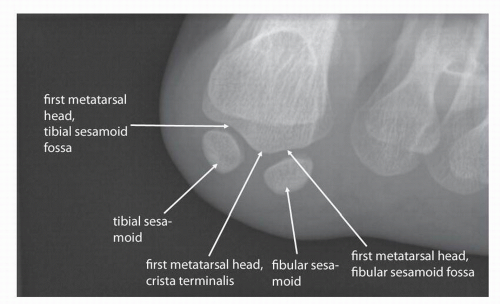 Figure 13.9 Plantar-dorsal or dorsoplantar (axial) radiographs of the calcaneus. These produce an anteroposterior image of the calcaneus and are helpful in seeing the posterior and middle subtalar joints in profile. The plantar-dorsal radiograph is obtained with the patient supine and the lower extremity extended. The foot is dorsiflexed so its long axis is perpendicular to the image receptor. The x-ray beam is then angled cephalad about 40 degrees to the long axis of the foot and first penetrates the sole of the foot. The dorsoplantar view is performed with the patient prone with a wedge or pillow placed under the distal calf. With the foot dorsiflexed to produce a 90-degree angle between the long axis of the foot and calf the x-ray beam is directed caudally 40 degrees to initially penetrate the posterior heel. |
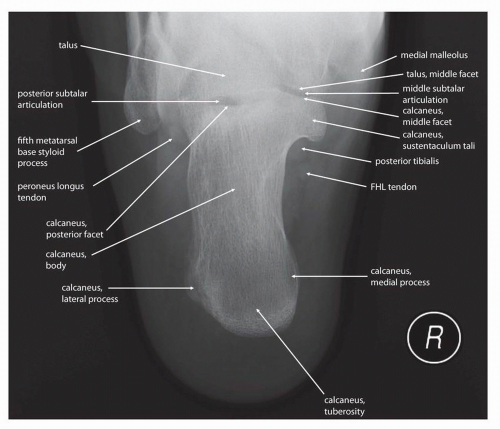 Figure 13.10 Sesamoid tangential radiograph. This view is used to see the sesamoid bones and hallux/sesamoid articulations in profile. It can be performed with the patient supine or prone and the great toe extended. Often a towel or strap is used to support the great toe in passive extension. |
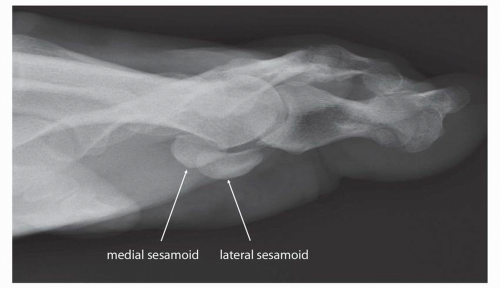 Figure 13.11 Causton sesamoid tangential radiograph. This oblique lateromedial view of the sesamoid bones separates the bones and avoids significant overlap. With the patient in the lateromedial position the x-ray beam is angled 40 degrees and directed toward the heel. The x-ray initially penetrates the lateral margin of the forefoot. |
Because of the complex anatomy of the foot and ankle and the dependence of radiography on patient positioning with respect to the x-ray beam, a number of specialized views in which the x-ray beam is oblique to the standard orthogonal planes are effectively employed to help see structures that normally overlap on conventional views. Other techniques, including stress views, can help identify soft tissue injuries not normally seen on radiographs. Osseous alignment during stress can be objectively quantified and compared with the contralateral side and can provide insight into abnormal foot and ankle biomechanics.7 Common examples of stress views are (i) weight-bearing views that can detect flatfoot deformities or areas of joint space narrowing that may not be seen on non-weight-bearing views, and (ii) AP views of the ankle with passive hindfoot inversion that can suggest lateral collateral ligamentous complex tears or insufficiency (Fig. 13.12A). In the AP ankle view with passive hindfoot varus stress 12 degrees of talar tilt or 5 degrees more than the contralateral side is considered positive. Sagittal stress views of the ankle are performed with the ankle in 10 to 20 degrees plantar flexion while applying anterior counterpressure to the distal tibia and a forward thrust on the cupped heel. Anterior translation of the talus of more than 4 mm is indicative of anterior ankle instability and insufficiency of the anterior talofibular ligament (Fig. 13.12B). ATelos stress apparatus can also be used in obtaining these views. For medial or deltoid insufficiency, a valgus force is applied to the heel in a mortise stress view of the ankle with counterpressure applied laterally to the distal leg (Fig. 13.12C). A gravity medial stress view is as effective as the manual technique. The medial clear space normally measures 4 mm (see Fig. 13.12D and Chapter 10).
COMPUTED TOMOGRAPHY
Like radiography, CT uses ionizing radiation for imaging. However, CT generates a regularly spaced stack of contiguous two-dimensional images generally oriented transverse to the long axis of the imaged structure. The complex anatomy of the foot and ankle—and the differences in orientations of imaged structures on cross-sectional examinations from those seen in surgical dissection or conventional radiography—make interpretation of cross-sectional studies challenging to interpret. As a result, adequate interpretation of these studies requires good understanding of the imaged anatomy. However, cross-sectional imaging techniques provide a noninvasive method to more clearly visualize complex anatomic relationships than radiography because they resolve the problem of overlapping structures that can prevent adequate radiographic visualization of structures. CT easily distinguishes bone and calcifications, metal, soft tissue, gas, and fat and is particularly useful in musculoskeletal imaging in the assessment of osseous pathology. In foot and ankle imaging, CT is most commonly used to detect radiographically occult fractures or to characterize complex injuries such as calcaneal fractures for intra-articular extension to the subtalar joint, articular surface incongruity, or intra-articular fracture fragments.8 CT can also help to detect areas of osteolysis9 or periosteal reactions that may indicate aggressive bone destruction and soft tissue calcifications in processes like tophaceous gout or tumors with calcified matrix.10 Tendons are well seen on routine CT, and this modality can be useful in the foot and ankle to demonstrate the position of tendons with respect to fracture fragments and to help determine whether there may be tendon impingement.8
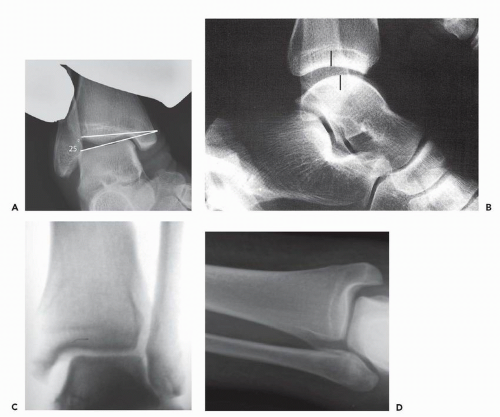 Figure 13.12 (A) Anteroposterior ankle stress radiograph. This view is helpful to assess the integrity of the medial and lateral ankle ligaments. The ankle is imaged in the anteroposterior projection with the distal calf immobilized and either inversion stress to test the lateral ligaments or eversion stress to test the medial ligaments is placed on the ankle. The study indicates ligament insufficiency if there is abnormal opening of the joint on the side of suspected ligament injury. However, there is great variability among normal people in the degree of opening during stress maneuvers and it is frequently necessary to obtain a similar image of the asymptomatic contralateral side. One grade system measures the tilt angle between the tibial plafond and the talar dome. Angles less than 5 degrees are considered normal. Angles between 5 and 15 degrees are borderline abnormal, those between 15 and 25 degrees are probably abnormal, and those angles greater than 25 degrees are definitely abnormal. (B) Sagittal stress view with the ankle in 20 degrees of plantar flexion. The talus translates more than 4 mm relative to the center of the tibial plafond. The posterior ankle opens up (posterior hiatal sign). This indicates anterior ankle instability due to an incompetent anterior talofibular ligament. (C) Manual mortise medial stress view shows widening of the medial clear space of more than 4 mm which denotes complete deltoid ligament tear. The example shows a case with no fibular fracture. The normal contralateral ankle can be stressed for a baseline. (D) Gravity medial mortise stress x-ray (with affected limb down and in decubitus position) is as reliable as and more comfortable than manual stress view. |
CT is also commonly used following surgery to determine osseous and hardware alignment and detect signs of orthopedic hardware failure. Metal often creates a particular streaking artifact, which produces dark streaks across the images adjacent to the metal and can prevent visualization of the margins of the metallic structure.11, 12 However, techniques like using thinner section collimation or maximizing the tube current and peak voltage, or using software corrections, can reduce the impact of this artifact and often allow CT to be useful for appraising the hardware and adjacent soft tissues.11
Modern CT scanners are very fast, often obtaining reproducible image sets with extended fields-of-view within seconds. To help clarify anatomy, the imaging data from these studies can be reconstructed in other cross-sectional planes either oriented to the long axis of the imaged body part or along other structures (Fig. 13.13). Alternatively, the data can be used to create three-dimensional renderings that can be helpful as an anatomic overview and guide interventional planning.13
Although intravenous iodinated contrast administration is not routinely performed, it is indicated in specific circumstances
including depicting vascular anatomy,14 detecting synovial proliferation and fluid collections, and characterizing soft tissue lesions for necrosis or cystic components. This is most commonly used in diagnosing and characterizing inflammatory arthropathies or infections and detecting fluid collections such as abscesses.15
including depicting vascular anatomy,14 detecting synovial proliferation and fluid collections, and characterizing soft tissue lesions for necrosis or cystic components. This is most commonly used in diagnosing and characterizing inflammatory arthropathies or infections and detecting fluid collections such as abscesses.15
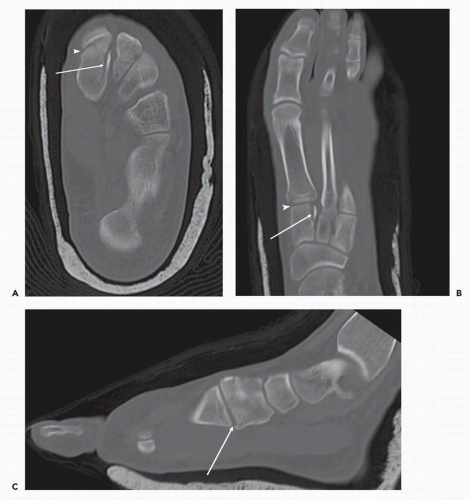 Figure 13.13 Computed tomography (CT) of hindfoot and midfoot showing the utility of multiplanar reformatted imaging. (A) Axial CT of the hindfoot and midfoot demonstrates a fracture of the lateral surface of the medial cuneiform (arrow) in the region of the Lisfranc ligament attachment. The arrowhead indicates the first tarsometatarsal joint. Because the patient was positioned with the ankle in plantar flexion, the anatomic relationships of the midfoot and the relationship of the fracture to the intercuneiform and tarsometatarsal joints is difficult to assess. (B) Reformatted horizontal long-axis image of the foot better depicts the fracture (arrow), whereas sagittal reformatted images (C) demonstrate 3 mm of distal medial cuneiform articular surface step-off at the tarsometatarsal joint that was difficult to perceive on the true axial images. |
MAGNETIC RESONANCE IMAGING
After obtaining initial radiographs MRI is often the test of choice to further image the foot and ankle. In the ankle MR is most commonly indicated when assessing the tendons and ligaments,16, 17 neurovascular structures such as within the tarsal tunnel, plantar fascia,18 and the osseous structures to look for radiographically occult fractures,19 detect findings of ankle impingement syndromes,20 and characterize osteochondral injuries of the talar dome.21


Related posts:

Stay updated, free articles. Join our Telegram channel
Full access? Get Clinical Tree
