(3)
Department of Orthopaedic Surgery, University of Missouri, Missour, Columbia, USA
1.1 Definitions
Confounding Variable
a factor (such as educational level) not specifically assessed by a study, but which may influence outcome.
Bias
intentional or unintentional errors in assigning patients to treatment groups (selection bias) or in evaluating exposures or outcomes. These errors make the likelihood of making a type I or type II error more likely and thus diminish the value of a study.
Sensitivity
the probability that a test is positive when there is disease present (true positive/(true positive + false negative)).
Specificity
the probability that if a test is negative, then the disease will not be present (true negative/(true negative + false positive)).
Relative Risk
the probability that a patient who has a risk factor also has a disease or condition, compared to the probability that a patient who has the disease does not have the risk factor.
Given the following:
Risk factor | Disease present | Disease not present |
|---|---|---|
Yes | a | b |
No | x | y |
Odds Ratio
if a patient has a disease or condition, what is the probability of having a given risk factor? (more commonly used in orthopedic literature than relative risk)
Type I Error
an error in which the null hypothesis is true, but the statistics rejects this. Also known as “α” or false-positive rate. For example, a spam filter flags an email as spam, but in fact it is not.
Not to be confused with the significance level of a test, which is set by the researcher at a predetermined level (.05) and reflects the threshold at which he/she is willing to accept the likelihood of a type I error.
Type II Error
conversely, an error in which the null hypothesis is false, but the test statistics accepts it as true. Also known as “β” or false negative. For example, when a spam filter fails to catch a spam email.
P-Value
the probability of the difference between two means is due to chance assuming that the null hypothesis is true.
Power
the ability of a study to correctly identify that the null hypothesis is false. Expressed as 1-β.
Effect Size
magnitude of the difference between the experimental group and the control group. Related to the concept of clinical significance in contrast to the statistical significance of a test.
Confidence Interval
a range which is likely to include the mean of a population for which the mean is unknown.
Incidence
the rate of having a given condition during a given time, e.g., the incidence of having a revision arthroplasty within 10 years from the index operation is 5 %.
Prevalence
a “snapshot” at a given point in time of how many subjects have a given condition, e.g., the prevalence of people of Asian ethnicity in San Francisco in the 1990 census was 29.1 %.
1.2 Statistical Inference
Statistical inference is the use of statistical tests to estimate the characteristics of the entire population based on the known characteristics of a limited sample.
Parametric tests are those which assume a normal population distribution. Nonparametric tests do not assume a normal population distribution.
Continuous data is numerical data which includes non-integer values. This data may be analyzed using a Student’s t-test (parametric) or Mann–Whitney test (nonparametric).
Categorical data is data which has a limited set of values, e.g., male or female. This data may be analyzed using a chi-square test or, when there are less than five observations in a category, a Fisher’s exact test. Proportions may also be analyzed with these methods.
Multiple regression analysis is a generic term encompassing several statistical methods which attempt to quantify the contribution of each of several variables to the observed outcome.
1.3 Study Design
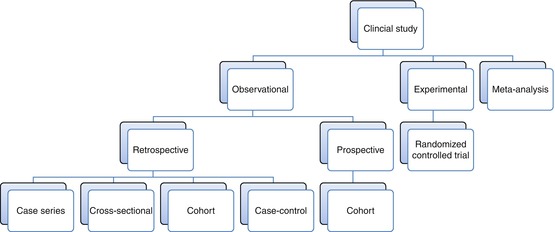
Experimental studies are those in which two (or more) treatment or exposure groups are selected by the investigator, usually assigned in a random fashion. These studies are potentially the most powerful studies since they may eliminate selection bias. However, many clinical studies are not amenable to randomization because of ethical considerations (amputation vs. limb salvage) or group size considerations (rare diseases).
Observational studies are those in which the treatment or exposure is not selected by the researcher. This type of study may be very powerful if the researcher is careful to eliminate as many confounding variables and biases as possible prior to beginning the study.
Prospective Study
the outcome cannot occur until after the patient is enrolled.
Retrospective Study
the outcome has already occurred before the study begins. Generally is considered more prone to bias than prospective studies.
Cohort Study
a given outcome is correlated with a given treatment or exposure. A cohort study can be prospective or retrospective.
Case–Control Study
a retrospective study which has two groups, cases (subjects which received a given treatment) and controls (subjects which did not). These groups are compared for the presence or absence of risk factors.
Cross-sectional
a retrospective study which reports the prevalence of a condition. May be useful to determine if a condition warrants further study.
Case Series
a retrospective report of a group of patients who had the same treatment or exposure.
Related posts:

Stay updated, free articles. Join our Telegram channel

Full access? Get Clinical Tree


