1
English version
1.1
Introduction
The daytime hospitalization (DH [HDJ, in French]) sectors of specialized follow-up care and rehabilitation (FCR [SSR, in French]) services treat patients requiring the intervention of a multidisciplinary team (physicians, physical therapists, occupational therapists, speech therapists…) and who are sufficiently autonomous and/or supported to justify having them stay in their own homes . In this respect, they correspond to the French decree No. 92-1102 of 2 October 1992 pertaining to the “technical conditions of functioning that must be met by health care structures existing as alternatives to hospitalization” .
In the “internal” branch, the patient is transferred from the complete hospitalization (CH) sector of FCR to DH. In the “external” branch, the patient is directly referred to DH-FCR either from his home through specialized physical and rehabilitation medicine consultation or from an acute service (in case of an upper limb operation, for example).
Treatment duration is at times short (multidisciplinary evaluation or expertise, evaluation and local treatment of spasticity, education in use of self-administered urinary elimination devices, validation of electric wheelchairs…) and at times longer (reinduction therapy after a stroke, back exercises, reeducation of a limb following surgery, readaptation to effort…). Admission to the internal branch is generally immediate (direct transfer from CH to DH). As regards the external branch, on the other hand, excessively lengthy waits for admission (several months) are far from rare, and they are incompatible with a therapeutic project, especially in cases of post-acute care. Mean or median rates and delays of admission can in this respect be considered as important factors in management of DH-FCR units. More specifically, the two parameters – percentages, days elapsed – can be used as means of monitoring DH functioning over time and of establishing comparisons between several units.
In the present work, we have applied a method that is well-known but new in the context: survival analysis (SA). It effectively complements the above-mentioned parameters by indicating:
- •
the admission rate (“death” event in SA) according to time elapsed since the request for admission;
- •
the time needed to successfully process a given percentage of the requests.
Moreover, graphic SA presentation is particularly well-suited to benchmarking between several hospitalization units and to monitoring a unit over time. Finally, it is possible to draw statistical comparisons between several survival curves.
1.2
Method
Three DH-FCR facilities in the French region of Bourgogne (Burgundy) participated in this study: the orthopedics DH and the neurology DH of the university hospital center of Dijon (DH-DO and DH-DN) and the orthopedics-neurology DH of the Tonnerrois hospital center (DH-T).
Admission requests for these three units were compared over the January–August 2013 period. During the last three months of 2013, the DH-T unit had been reorganized for the purpose of streamlining processes in the external branch. Reorganization essentially involved dedicated DH therapists and the weekly program of patient management. Analysis of the unit was subsequently renewed for the January–August 2014 period.
Requests for admission to a single-location DH (validation of electric wheelchair, botulinum toxin injection…) are generally not subjected to the same constraints and do not entail waits for admission as long as those entailed by requests for treatment in series of locations; as a result, they were not taken into consideration.
Median rates and delays of admission were calculated. Survival analysis (SA) was carried out to compare the three DH facilities and to appraise the evolution having taken place in Tonnerrois unit from 2013 to 2014. Survival curves were drawn up according to the classical Kaplan-Meier method, while comparison was carried out using the Log-rank test . Calculations were performed using Number Cruncher Statistical System 9 software .
1.3
Results
1.3.1
Comparison of the three DHs
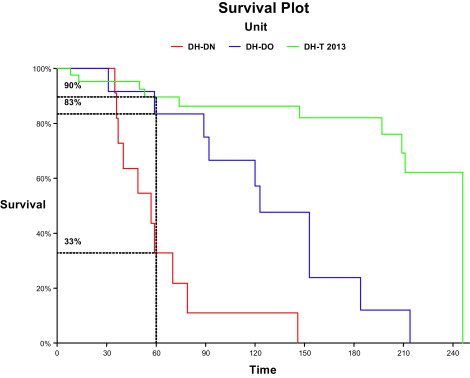
From January to August 2013, twelve requests for admission to the external branch were received by DH-DN, and 10 (83%) were honored prior to the end of the period, with median turnaround time of 53 days (from 18 to 146). DH-DO received 14 requests of which 10 (71%) were honored, with median turnaround time of 122 days (from 30 to 214). Forty-one requests were addressed to DH-T, of which 10 (24%) were honored, with median turnaround time of 111 days (from 8 to 242).
Survival curves for the three units are presented in Fig. 1 . It may be observed that after 60 days, 33% of the admission requests had not been honored at DH-DN (percentage corresponding to that of the SA “survivors”), 83% at DH-DO and 90% at DH-T. In order to honor half of the admission requests, it had taken an average of fifty-seven days for DH-DN, compared with 123 for DH-DO and 246 for DH-T. The Log-rank test used for comparison of the three survival curves was statistically significant ( P < 10 −6 ).
1.3.2
The evolution of DH-T from 2013 to 2014
From January to August 2014, out of twenty-one requests for admission to the external branch received by DH-T, 19 (90%) were honored prior to the end of the period. Median turnaround time for admission was 17 days (from 0 to 78).
Survival curves for 2013 and 2014 are depicted in Fig. 2 . It may be observed that from one time period to the next, the percentage of admission requests that had not been honored after 60 days of waiting had plummeted from 90% to 5%. In 2014, it took an average of nineteen days for DH-T to honor half of the admission requests, compared with 246 in 2013. The Log-rank test comparing the two survival curves was statistically significant ( P < 10 −6 ).

1.4
Discussion
We used survival analysis (SA) according to the Kaplan-Meier method with the Log-rank test to compare the rates and delays of admission in three DH-FCR units and to measure their evolution over time. The method provides numerical and graphical results that are easy to interpret and suited to the objective of our study. It enables interested parties:
- •
to estimate the percentage of actual admissions (SA “death” event) according to the time elapsed since the request;
- •
to calculate the time needed to honor a given percentage of the requests;
- •
to compare the “survival curves” of several departments.
It is applied in most (paid) statistical software and uses only the data regularly collected in the FCR units, which is to say data and status of the admission request at the moment of the study (“admission on hold” or “patient admitted on xx/xx/20xx”). Needless to say, only the accepted admission requests shall be taken into consideration.
In our study, the impact of the action carried out in the Tonnerrois hospital center on admission in DH-T from 2013 to 2014 is perfectly illustrated by SA. That much said and as is the case with any strictly quantitative method, it is not meaningful unless it is completed by a qualitative analysis. In actuality, the low rate of admission to DH-DO at 60 days is not due to insufficient accommodation capacity or poor organization. In fact, the unit is limited to chronic lower back pain patients enrolled in a reconditioning program. Most members of this population are still active, and it is impossible for them to find time for the program on short notice after an initial contact in consultation (which corresponds to the official date of the admission request). For this reason, treatment of a patient classically begins several months subsequent to the request. By contrast, DH-DN welcomes numerous retired or invalid patients, who are markedly more available. “On hold” periods are consequently shorter in DH-DN than in DH-DO, and this is no way related to better organization of the neurology branch.
1.5
Conclusion
As its name does not indicate, survival analysis (SA) is not reserved for patients suffering from severe illnesses for whom death is an event to be expected sooner or later. The event studied can be a relapse in chronic disease, but also cure of the condition, not to mention loss of a job or engine failure. In our study, the subjects to be analyzed were requests for admission, and “death” meant actual DH admission. In the overall framework of a continual quality improvement process, parameters such as “percentage of admission requests honored at 15, 30 or 60 days or time needed to honor 50% or 90% of admission requests” are relevant indicators for yearly monitoring of a FCR unit or for benchmarking between several departments. SA is an effective means of estimating the different parameters and of graphically representing them using an intuitive model that is relatively easy for non-specialists as well as specialists to comprehend.
Disclosure of interest
The authors declare that they have no conflicts of interest concerning this article.
2
Version française
2.1
Introduction
Les secteurs d’hospitalisation de jour (HDJ) des services de soins de suites et réadaptation (SSR) spécialisés prennent en charge des patients nécessitant l’intervention d’une équipe pluridisciplinaire (médecins, kinésithérapeutes, ergothérapeutes, orthophonistes…) et qui sont suffisamment autonome et/ou entourés pour autoriser le maintien à domicile . À ce titre, elles répondent au décret n o 92-1102 du 2 octobre 1992 relatif aux « conditions techniques de fonctionnement auxquelles doivent satisfaire les structures de soins alternatives à l’hospitalisation » .
Dans la filière « interne », le patient est transféré du secteur d’hospitalisation complète (HC) de SSR vers l’HDJ. Dans la filière « externe », le patient est adressé directement en HDJ-SSR, depuis son domicile via une consultation spécialisée de médecine physique et réadaptation, ou depuis un service de soins aigus (membre supérieur opéré, par exemple).
Les prises en charge y sont parfois courtes (bilan ou expertise pluridisciplinaire, bilan et traitement local de la spasticité, éducation aux auto-sondages urinaires, validation de fauteuils roulants électriques…), parfois plus longues (séjour de réinduction de la rééducation à distance d’un AVC, école du dos, rééducation d’un membre à distance d’une intervention, réadaptation à l’effort…). Les délais d’admission dans la filière interne sont habituellement nuls (transfert direct de l’HC vers l’HDJ). Dans la filière externe, des délais d’admission trop longs (plusieurs mois) sont parfois observés et donc incompatibles avec le projet thérapeutique, notamment en post-aigu. Le taux et le délai moyens ou médians d’admission sont, à ce titre, des éléments importants à implémenter au tableau de bord des unités HDJ-SSR. Ces deux paramètres peuvent être utilisés pour suivre le fonctionnement d’une HDJ dans le temps ou pour comparer entre elles plusieurs unités.
Dans le présent travail, nous avons utilisé une méthode bien connue mais nouvelle dans ce contexte : l’analyse de survie (AS). Elle complète avantageusement les deux paramètres précités car elle donne :
- •
le taux d’admission (évènement « décès » de l’AS) en fonction du temps écoulé depuis la demande ;
- •
le temps nécessaire à écouler un certain pourcentage de ces demandes.
De plus, sa présentation graphique est particulièrement adaptée au benchmarking entre plusieurs unités d’hospitalisation et au suivi dans le temps d’une unité. Enfin, il est possible de comparer statistiquement plusieurs courbes de survie.
2.2
Méthode
Trois HDJ-SSR de Bourgogne ont participé à cette étude : l’HDJ orthopédique et l’HDJ neurologique du CHU de Dijon (HDJ-DO et HDJ-DN), l’HDJ ortho-neurologique du centre hospitalier du Tonnerrois (HDJ-T).
Les demandes d’admissions vers ces trois unités ont été comparées sur la période janvier–août 2013. Durant le quatrième trimestre 2013, une réorganisation de l’unité HDJ-T a été menée dans le but de fluidifier la filière externe. Cette réorganisation a essentiellement concerné l’effectif des rééducateurs dédiés à l’HDJ et le programme hebdomadaire de prise en charge des patients. L’analyse a donc été renouvelée pour cette unité sur la période janvier–août 2014.
Les demandes d’admission pour une venue unique en HDJ (validation de fauteuil roulant électrique, injection de toxine botulinique…) ne sont généralement pas soumises aux mêmes contraintes et ne souffrent pas de délais d’admission aussi longs que les demandes de prise en charge pour des séries de venues. Elles n’ont donc pas été considérées.
Les taux et délais médians d’admissions ont été calculés. Une AS a été réalisée pour comparer les trois HDJ et apprécier l’évolution de l’HDJ-T entre 2013 et 2014. Les courbes de survie ont été réalisées selon la méthode classique de Kaplan-Meier et leur comparaison par le test du Log-rank . Les calculs ont été effectués avec le logiciel Number Cruncher Statistical System 9 .
2.3
Résultats
2.3.1
Comparaison des trois HDJ
Douze demandes d’admission de la filière externe ont été reçues entre janvier et août 2013 par l’HDJ-DN, 10 (83 %) ont été honorées avant la fin de cette période, avec un délai médian de 53 jours (de 18 à 146). L’HDJ-DO en a reçu quatorze, dont 10 honorées (71 %) avec un délai médian de 122 jours (de 30 à 214). Quarante et une demandes ont été adressées à l’HDJ-T, 10 ont été honorées (24 %) avec un délai médian de 111 jours (de 8 à 242).
Les courbes d’AS pour les trois unités sont présentées en Fig. 1 . On constate qu’après 60 jours, 33 % des demandes d’admissions n’étaient pas encore honorées par HDJ-DN (correspondent aux « survivants » de l’AS), 83 % pour HDJ-DO et 90 % pour HDJ-T. Il fallait cinquante sept jours à l’HDJ-DN pour honorer la moitié des demandes d’admission, contre 123 pour l’HDJ-DO et 246 pour l’HDJ-T. Le test du Log-rank pour la comparaison des trois courbes de survie était statistiquement significatif ( p < 10 −6 ).
Related posts:
 Enhancing Annalsvalue through quality
Six years of bilingual edition for The Annals of PRMare coming to an end
Pain during injections of botulinum toxin in children: Influence of the localization technique
Validation of an Arabic version of the Oswestry index in Saudi Arabia
Teres major tendon tears in a professional boxer
The motor function measure to study limitation of activity in children and adults with Charcot-Marie-Tooth disease
Enhancing Annalsvalue through quality
Six years of bilingual edition for The Annals of PRMare coming to an end
Pain during injections of botulinum toxin in children: Influence of the localization technique
Validation of an Arabic version of the Oswestry index in Saudi Arabia
Teres major tendon tears in a professional boxer
The motor function measure to study limitation of activity in children and adults with Charcot-Marie-Tooth disease
Stay updated, free articles. Join our Telegram channel

Full access? Get Clinical Tree


