Abstract
The progression of adolescent idiopathic scoliosis is typically monitored via regular radiographic follow-up. The Cobb angle (as measured on whole-spine radiographs) is considered as the gold standard in scoliosis monitoring.
Objective
To determine the sensitivity and specificity of back surface topography parameters, with a view to detecting changes in the Cobb angle.
Patient and method
One hundred patients (mean age: 13.3) with Cobb angles greater than 10 degrees were included. Topographic parameters were measured in a standard position and in a position with hunched shoulders. Gibbosities and spinal curvatures were evaluated.
Results
An increase of more than 2 degrees in any one gibbosity or in the sum of the gibbosities (in either of the two examination positions) enabled the detection of a five-degree increase in the Cobb angle with a sensitivity of 86% and a specificity of 50%.
Conclusion
If the present results are confirmed by other studies, analysis with back surface topography parameters may reduce the number of X-ray examinations required to detect increases in the Cobb angle.
Résumé
L’évolution de la scoliose idiopathique de l’adolescent est classiquement contrôlée par un suivi radiographique régulier. L’angle de Cobb, mesuré sur des radiographies de rachis entier, est considéré comme le gold standard de ce suivi.
Objectif
L’objectif de notre travail était d’étudier la sensibilité et la spécificité de paramètres de topographie de surface du dos pour détecter les changements de l’angle de Cobb.
Patients et méthode
Cent patients âgés de 13,3 ans en moyenne et présentant des angles de Cobb de plus de 10 degrés ont été inclus. Les mesures des paramètres topographiques étaient réalisées dans une position standard et dans une position permettant de dégager les omoplates. Les paramètres topographiques testés étaient les gibbosités et les courbures rachidiennes.
Résultats
La majoration de plus de 2 degrés de l’une des gibbosités ou de la somme des gibbosités mesurées dans l’une ou l’autre des positions permettait de détecter les aggravations de 5 degrés de l’angle de Cobb avec une sensibilité de 86 % et une spécificité égale à 50 %.
Conclusion
Si ces résultats sont confirmés par d’autres études, l’analyse en topographie de surface pourrait réduire le nombre de radiographies utilisées pour détecter les majorations de l’angle de Cobb.
1
English version
1.1
Introduction
Adolescent idiopathic scoliosis corresponds to a three-dimensional deformation of the spine. The prevalence of this condition ranges from 0.5 to 4%, depending on the reference angles used . In the absence of aetiological treatment, patient care relies on physical and surgical techniques . Therapeutic decisions are based on clinical examinations and radiological assessments . The rationale for this type of care is based on the ease of performance of X-rays and the high inter-reader reproducibility of this approach when performed under standardized conditions . However, the X-ray-based approach repeatedly exposes the patient to ionizing radiation , which is responsible for an increased risk of carcinogenesis in patients being monitored for scoliosis/kyphosis .
In order to avoid unnecessary X-rays, clinical examinations (such as Adam’s forward bend test) are used to screen for waist symmetry, shoulder balance spinal curves or gibbosities. Indeed, the forward bend is a simple, reproducible and sensitive test for the detection of scoliosis . However, its value in the monitoring of scoliosis has not been extensively evaluated.
Non-radiological instrumental techniques have been developed with a view to detecting scoliosis and monitoring its progression. These approaches measure the back’s surface topography and are mainly based on optical devices: the Optronic Torsograph , computer optical topography , raster stereography with the Quantec Spinal Image System , the Formetric system , the Inspeck system , the ISIS2 , and Fortin’s system . Additionally, laser doppler and ultrasound techniques have also been used to map the back surface. These devices have very satisfactory measurement reproducibilities in terms of both inter-reader agreement and repeated examinations . In contrast, the lack of data on the optical devices’ ability to detect changes in the Cobb angle means that these systems are rarely used . Hence, many X-ray examinations tend to be performed before the absence of progression can be confirmed.
This raises the question of whether it is possible to reduce the number of X-rays used to monitor idiopathic scoliosis during growth periods in older children and adolescents.
In this context, the objective of the present study was to evaluate the sensitivity and specificity of a number of optically measured topographic parameters for detecting the accentuation of progressive idiopathic scoliosis in pre- and peripubescent children, with a view to avoiding unnecessary follow-up X-rays in this population.
1.2
Patients and methods
1.2.1
Study design and procedures
We performed a prospective, non-interventional study that included all the children consulting a private-practice physical and rehabilitation medicine (PRM) physician for the treatment of idiopathic scoliosis of more than 10 degrees relative to the initial Cobb angle. The exclusion criteria were severe scoliosis requiring direct surgical treatment, patent congenital abnormalities on X-rays and neurological abnormalities. All patient inclusions and topographic measurements were performed by the same physician. In compliance with the Declaration of Helsinki, all the patients (together with their parents) were provided with comprehensive information and gave their consent to use of their personal data in the study. In all, 100 patients were consecutively included over a three-year period. The monitoring frequency was exactly the same as in standard care with individual adjustments.
The X-rays were performed without a corset. A topographic analysis of the surface of the back was performed in a consultation a few days after each radiological assessment. The radiological and topographic parameters were recorded at each step in the patient’s follow-up.
1.2.2
Radiological parameters
Telemetry X-ray images of the spine were acquired on large cassettes (30–90 or 30–120). The Cobb angle was always calculated by the PRM physician supervising the scoliosis follow-up. It was defined as the angle formed between the upper and lower endplates of the upper and lower end vertebrae, defined as those with the greatest slope relative to the horizontal . The spinal curves were topographically classified into three patterns :
- •
type A = cervicothoracic and upper thoracic curves above a contralateral thoracic or thoracolumbar counter-curve;
- •
type B = thoracic and thoracic-lumbar curves above a lumbar counter-curve;
- •
type C = lumbar and thoracolumbar curves starting with an oblique iliolumbar segment and without a lower lumbar counter-curve.
We considered progressing curves to be those that worsened between two successive measurements of the Cobb angle. Three different progression thresholds were considered: 5 degrees (corresponding to the threshold most frequently used in the literature), 3 degrees (corresponding to the lower boundary of intra-observer variability in X-ray reading, as reported by Morrissy et al. ) and 10 degrees (a threshold used by other researchers ).
1.2.3
Parameters describing the back’s three-dimensional topography
We used the BIOMOD™-L system (AXS MEDICAL, Merignac, France) to study the back’s surface topography; the system’s reproducibility has already been studied in young patients with scoliosis .
Before each topographic examination, the clinician placed four skin markers near the C7 spinous process, the fossae lumbales laterales and the top of the intergluteal cleft. Next, the physician determined the alignment of the spinous processes by palpation and drew a line with a marker.
In order to take account of postural bias, images were acquired in two positions:
- •
the “hunched position”. The patient stood with his/her shoulders rounded, in order to stop the shoulder blades from sticking out and enable more accurate measurement of any thoracic gibbosities ;
- •
the “stance position”. The patient stood upright in a natural position while holding onto vertical bars in front (i.e. a similar position to that used for standard X-ray acquisitions ).
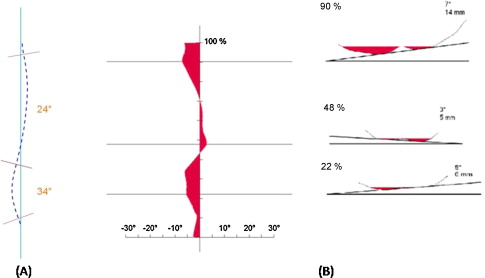
After the skin markers’ positions had been validated by the clinician, the system automatically calculated the angle of the spinal curves in the frontal plan (defined as the angle between the most inclined perpendiculars, relative to the horizontal) ( Fig. 1 A) . To avoid confusion with the Cobb angle, these angles were referred to as “sinuosity angles”, as defined by Stagnara . The gibbosities (defined as an angle formed by the tangent to the thoracic or lumbar processes relative to the patient’s frontal plan) were automatically calculated for each region of the spinal and were displayed as an interactive diagram that enabled the physician to place a cursor over the curves and visualise the largest gibbosities ( Fig. 1 B).
The clinician could thus select three gibbosities in three regions, by analogy with the X-ray measurements: type A (cervicothoracic gibbosities), type B (thoracolumbar gibbosities) and type C (lumbar gibbosities), the values of which were immediately recorded.
1.3
Statistical analysis
The criteria selected to determine clinical progression of scoliosis were based on increases in gibbosities and sinuosities. We considered each individual gibbosity as well as the sum of the gibbosities. A combination of these variables was also studied (see Tables 2–4 ).
For both individual gibbosities and the summed gibbosities, the threshold for a significant change was set to 2 degrees. For sinuosities, the positivity threshold was set to 10 degrees. These thresholds correspond to the system’s inter-observer measurement error .
After anonymization, statistical analysis of the data was performed by a third-party service provider. The analysis compared the chosen parameters in successive pairs of examinations of the same patient throughout the follow-up period. For each threshold level, we counted the number of patients with an increase in the Cobb angle detected by surface topography (true positives [TPs]), those with an increase in the Cobb angle not detected by surface topography (false negatives [FNs]), the number of patients considered rightly by surface topography not to have increased their Cobb angle (true negatives [TNs]) and those considered wrongly by surface topography to have increased their Cobb angle (false positives [FPs]). For the selected surface topography parameters, the positive predictive value (PPV = TP/(TP + FP)), the negative predictive value (NPV = TN/(TN + FN)), the specificity (TN/(TN + FP)) and the sensitivity (TP/(TP + FN)) were then calculated.
1.4
Results
In all, we collected the data on 100 patients and 150 pairs of consecutive measurement sessions. The characteristics of the study participants are summarized in Table 1 . The follow-up covered all periods of bone growth (8% before point P in puberty, 20% before Risser grade 1, 17% around Risser grade 1, 26% between Risser grades 1 and 3, and 29% between Risser grades 4 and 5). The distribution of the observed curves on X-rays showed a predominance of type B and C curves (with types A, B and C accounting respectively for 11, 40 and 49% of the curves). This same was true for the gibbosities (20, 38 and 42% for types A, B and C, respectively). Forty-eight patients (30%) were not treated between two consecutive examinations, whereas 102 cases (70%) wore a corset.
| n | Mean ± standard deviation | Median [range] | |
|---|---|---|---|
| Age (years) | 150 | 13.3 ± 2.1 | 14 [7–20] |
| Time interval between two assessments (months) | 150 | 7.8 ± 28 | 7 [3–18] |
| Cobb angle, initial type A (degrees) | 17 | 22 ± 13 | 23.5 [10–48] |
| Cobb angle, initial type B (degrees) | 60 | 22 ± 8 | 22 [10–45] |
| Cobb angle, initial type C (degrees) | 73 | 16 ± 7 | 16 [10–35] |
By considering the spinal curve that had progressed most between two measurement sessions, Cobb angle increases of more than 3, 5 and 10 degrees were observed in 58 patients (39%), 37 patients (25%) and 9 patients (6%), respectively.
1.4.1
Determination of the most sensitive parameter for detecting radiological progression
The PPVs, NPVs, sensitivities and specificities of the parameters studied for detecting progression of the Cobb angle with thresholds of 3, 5 and 10 degrees are reported in Tables 2–4 , respectively. In the present section, we emphasize only the most relevant results. The “f” parameter (the increase in the sum of the gibbosities in either position, or an increase in at least one of the gibbosities in either position) was most sensitive for detecting progression over the three Cobb angle thresholds (with sensitivities of 86, 86, and 100% for 3, 5 and 10 degrees, respectively).
| a | b | c | d | e | f | |
|---|---|---|---|---|---|---|
| TP | 36 | 35 | 26 | 19 | 12 | 50 |
| TN | 67 | 63 | 82 | 76 | 85 | 53 |
| FP | 25 | 29 | 10 | 16 | 7 | 39 |
| FN | 22 | 23 | 32 | 39 | 46 | 8 |
| Total | 150 | 150 | 150 | 150 | 150 | 150 |
| TP (%) | 24 | 23 | 17 | 13 | 8 | 33 |
| TN (%) | 45 | 42 | 55 | 51 | 57 | 35 |
| FP (%) | 17 | 19 | 7 | 11 | 5 | 26 |
| FN (%) | 15 | 15 | 21 | 26 | 31 | 5 |
| NPV (%) | 75 | 73 | 72 | 66 | 65 | 87 |
| PPV (%) | 59 | 55 | 72 | 54 | 63 | 56 |
| Sensitivity (%) | 62 | 60 | 45 | 33 | 21 | 86 |
| Specificity (%) | 73 | 68 | 89 | 83 | 92 | 58 |
| a | b | c | d | e | f | |
|---|---|---|---|---|---|---|
| TP | 22 | 26 | 19 | 13 | 9 | 32 |
| TN | 74 | 75 | 96 | 91 | 103 | 56 |
| FP | 39 | 38 | 17 | 22 | 10 | 57 |
| FN | 15 | 11 | 18 | 24 | 28 | 5 |
| Total | 150 | 150 | 150 | 150 | 150 | 150 |
| TP (%) | 15 | 17 | 13 | 9 | 6 | 21 |
| TN (%) | 49 | 50 | 64 | 61 | 69 | 37 |
| FP (%) | 26 | 25 | 11 | 15 | 7 | 38 |
| FN (%) | 10 | 7 | 12 | 16 | 19 | 3 |
| NPV (%) | 83 | 87 | 84 | 79 | 79 | 92 |
| PPV (%) | 36 | 41 | 53 | 37 | 47 | 36 |
| Sensitivity (%) | 59 | 70 | 51 | 35 | 24 | 86 |
| Specificity (%) | 65 | 66 | 85 | 81 | 91 | 50 |
| a | b | c | d | e | f | |
|---|---|---|---|---|---|---|
| TP | 7 | 8 | 8 | 7 | 5 | 9 |
| TN | 87 | 85 | 113 | 113 | 127 | 61 |
| FP | 54 | 56 | 28 | 28 | 14 | 80 |
| FN | 2 | 1 | 1 | 2 | 4 | 0 |
| Total | 150 | 150 | 150 | 150 | 150 | 150 |
| TP (%) | 5 | 5 | 5 | 5 | 3 | 6 |
| TN (%) | 58 | 57 | 75 | 75 | 85 | 41 |
| FP (%) | 36 | 37 | 19 | 19 | 9 | 53 |
| FN (%) | 1 | 1 | 1 | 1 | 3 | 0 |
| NPV (%) | 98 | 99 | 99 | 98 | 97 | 100 |
| PPV (%) | 11 | 13 | 22 | 20 | 26 | 10 |
| Sensitivity (%) | 78 | 89 | 89 | 78 | 56 | 100 |
| Specificity (%) | 62 | 60 | 80 | 80 | 90 | 43 |
1.4.2
Analysis of false negatives
For Cobb angle increases of 3 and 5 degrees, parameter “f” respectively generated eight and five FN patients. The five FN patients not detected by parameter “f” at a Cobb angle increase of 5 degrees were all over the age of 14, with a Risser grade of 2 or more and a Cobb angle increase of between 6 and 7 degrees. The three additional FN patients not detected by parameter “f” at a Cobb angle threshold of 3 degrees were aged between 13 and 14, with a Risser grade of 2 (n = 2) or 0 (n = 1) and a Cobb angle increase of between 3 and 4 degrees.
1.5
Discussion
Taken as a whole, our results show that parameter “f” was most sensitive for detecting the progression of scoliosis for all three angle thresholds considered here. It combined an increase of more than 2 degrees in any one gibbosity or in the sum of the gibbosities. Hence, parameter “f” appears to be the most valuable criterion for minimizing the underestimation of progression. Moreover, the specificity of parameter “f” is high enough to reduce the number of X-rays required for follow-up. In fact, this parameter was able to detect 3-, 5- and 10-degree increases in the Cobb angle with sensitivities of 86, 86 and 100% and specificities of 58, 50 and 43%, respectively. In practice, the data in Tables 2–4 (the numbers of true and false positives and negatives) enable us to evaluate the proportion of the 150 monitoring X-rays that could have been avoided. For a 3-degree progression in the Cobb angle, use of parameter “f” to trigger an X-ray assessment would have reduced the number of the latter to 89 (TPs + FPs), corresponding to a 40% reduction and with eight progressions (FNs) left undetected. Likewise, 89 X-ray assessments (a 40% reduction) would also have been required for 5- and 10-degree progression, with no undetected progressions (FNs) for 10 degrees.
The repeated measurement of a single gibbosity (parameters “a” and “b”) does not appear to be sufficiently specific or sensitive for detecting progression of the Cobb angle. In line with other reports, we increase the topographic assessment’s sensitivity and specificity by combining several parameters .
When first considering the stance position as the reference position, we analyzed the corresponding sensitivity and specificity data. The stance position is associated with high specificity for the measurement of sinuosity angles. However, the “c” and “d” parameters (analysing the sums of the gibbosities) were always more sensitive in the hunched position than in the stance position. From this standpoint, and given the equivalent reproducibilities of the two positions , an approach combining the two postures appears to be optimal because it maintains comparability with X-ray measurements while increasing the sensitivity with which progression of scoliosis can be detected.
To make our approach easier to understand, we limited the construction of our parameters to combinations of simple clinical measurements . To facilitate comparisons, we have analyzed three thresholds for progression of the Cobb angle. Our study revealed that by taking account of the sum of the gibbosities, parameter “f” limited postural bias and increased the sensitivity of the surface topography measurement for detecting a radiological accentuation of more than 5 degrees. Our analysis of FNs appears to show a decrease in the sensitivity of parameter “f” with advancing age; this agrees with literature data showing dissociation between the progression of gibbosities and that of the Cobb angle at the end of the growth phase .
In the present study, changes in the alignment of the spinous processes (parameter “e”) appeared to be highly specific for an increase in the Cobb angle. These results are similar to those of Weisz et al. , who reported a specificity of 84% for the increase in a scoliotic curve. However, our results showed that this criterion lacks sensitivity (21, 24 and 56% for increases in the Cobb angle of 3, 5 and 10 degrees, respectively). This lack of sensitivity is certainly due to the rotation of the vertebras, which orientates the spinous process towards the concavities of the scoliotic curves.
Goldberg et al. used a 10-degree threshold to analyze the predictive performance of the Quantec system (a sensitivity and an NPV of 100%, a specificity of 45% and a PPV of 62%) . For this same threshold, parameter “f” also showed a sensitivity of 100%. In contrast, it had low specificity (43%). For the 10-degree threshold, parameter “c” (the sum of the gibbosities in the hunched position) had a sensitivity of 89% and a specificity of 80%. By using parameter “c” as a trigger for radiological assessments, only 36 X-rays would have been needed. In others words, 86% of the X-ray examinations could have be avoided at the cost of missing a single accentuation.
1.6
Study limitations
One of the limitations of our study is that it was not able to establish a link between the deformations of the back in the standing position and the clinical gibbosities measured when bending forward. Although some studies have reported on the reproducibility of clinical measurements of gibbosities , the value of a clinical examination in detecting the accentuation of scoliosis has not (to the best of our knowledge) been investigated.
Secondly, the study was performed using simple combinations of parameters. A more in-depth study might help to optimize the detection test, notably by assessing age-related variations in sensitivity and specificity (as suggested here by our analysis of FNs).
Another limitation of our study relates to the fact that all data were acquired by a single operator. However, a previous study showed the good “inter-observer” reproducibility of the gibbosity and sinuosity measurements performed here .
1.7
Conclusion
A surface topography analysis in the hunched and stance position enables radiological aggravations to be detected with good sensitivity. Use of this technique may enable a significant reduction in the number of X-ray examinations used to detect increases in the Cobb angle. The present results must nevertheless be confirmed by other studies.
Acknowledgments and disclosure of interest
We wish to thank Ghislaine Martinez for assistance with loading images.
Dr Georges de Korvin performed the study with a prototype system loaned to him by the manufacturer. This loan was free of charge and enabled Dr de Korvin to perform a proof-of-concept study to confirm his initial hypothesis. No study funding was provided.
Mr Tiana Randriaminahisoa is a PhD student with a CIFRE grant as part of a collaboration between the University of Lyon 1 and the company AXS Medical. He was not involved in the acquisition or statistical processing of the data.
The other authors declare that they have no conflicts of interest concerning this article.
2
Version française
2.1
Introduction
La scoliose idiopathique de l’adolescent est une déformation tridimensionnelle du rachis, dont la fréquence varie entre 0,5 et 4 % selon les angles de référence retenus . En l’absence de traitement étiologique, le suivi thérapeutique est basé sur des techniques physiques et chirurgicales . Les décisions thérapeutiques reposent à la fois sur l’examen clinique et sur le suivi radiologique . Ce mode de suivi est expliqué par la simplicité de réalisation des radiographies et leur reproductibilité inter-lecture dans des conditions standardisées . Cependant, il expose aux radiations ionisantes répétées , responsables d’une augmentation du risque néoplasique chez les patients suivis pour scoliose/cyphose .
Pour éviter des radiographies inutiles, l’examen clinique reposant sur l’analyse des symétries de taille, de l’équilibre des épaules ainsi que la recherche d’une courbure rachidienne ou d’une gibbosité (Adam’s Forward Bending Test), reste un test simple, reproductible et sensible pour la détection des scolioses . Cependant, son intérêt dans le suivi des scolioses demeure mal évalué.
Des techniques instrumentales non radiologiques se sont développées dans le but de détecter et de suivre l’évolution des scolioses. Ces examens s’appuient sur la mesure de la surface du dos. Ils utilisent principalement des systèmes optiques : Optronic Torsograph , COMOT , Raster stéréographie Quantec , Formetric , appareil de Pazos et al. , ISIS2 , appareil de Fortin . À côté des techniques optiques, le laser et le doppler aérien ont aussi été utilisés pour reproduire la surface du tronc. Les études montrent que ces systèmes ont des reproductibilités de mesure tout à fait satisfaisantes tant pour les relectures d’un examen que pour la réalisation répétée d’examens . En revanche, en raison d’un manque d’études évaluant leur capacité de dépistage des changements de l’angle de Cobb , les systèmes optiques demeurent peu utilisés et de nombreuses radiographies sont effectuées pour constater une absence d’évolution.
Une question se pose donc : est-il possible de réduire le nombre de radiographies dans le suivi de la scoliose idiopathique en période de croissance, en particulier chez le grand enfant et l’adolescent ?
Dans ce contexte, l’objectif de notre travail était donc d’évaluer la sensibilité et la spécificité de différents paramètres topographiques mesurés par système optique pour dépister l’aggravation des scolioses idiopathiques évolutives en période pré- et péripubertaire, et éviter un certain nombre de radiographies inutiles dans le cadre du suivi cette population.
2.2
Patients et méthode
2.2.1
Organisation de l’étude
Nous avons réalisé une étude prospective non interventionnelle. Ont été inclus, l’ensemble des enfants consultant un médecin MPR ayant une activité libérale, pour la prise en charge d’une scoliose idiopathique de plus de 10 degrés d’angle de Cobb initial. Les critères d’exclusion étaient la présence d’une scoliose sévère relevant directement d’un traitement chirurgical ou la présence d’une anomalie congénitale patente sur la radiographie ou la détection d’une anomalie lors de l’examen neurologique. L’ensemble des inclusions et des acquisitions topographiques ont été réalisées par le même médecin. Conformément à la déclaration d’Helsinki, tous les patients, accompagnés de leurs parents, ont été informés et ont donné leur consentement pour que les données les concernant soient exploitées dans cette étude. Au total, 100 patients ont été consécutivement inclus sur une période de 3 ans. La fréquence des examens respectait strictement celle de la procédure de soins habituelle avec des ajustements individuels.
Les radiographies ont été réalisées sans corset. L’analyse topographique de la surface du dos a été réalisée en consultation quelques jours après chaque bilan radiologique. Les paramètres radiologiques et topographiques ont été notés à chaque étape du suivi.
2.2.2
Les paramètres radiologiques
Les clichés radiographiques étaient réalisés sur des télémétries du rachis sur grande cassette (30–90 ou 30–120). La lecture des angles de Cobb était toujours faite par le même médecin MPR qui réalisait le suivi de scoliose. L’angle de Cobb était défini par l’angle formé entre les plateaux supérieur et inférieur des vertèbres limites supérieure et inférieure, définies comme étant celles dont les inclinaisons sont maximales par rapport à l’horizontale . Les courbures ont été classées selon le modèle topographique en trois niveaux :
- •
A = courbures cervico-thoraciques et thoraciques supérieures sus jacentes à une courbure thoracique ou thoraco-lombaire controlatérale ;
- •
B = courbures thoraciques et thoraco-lombaires avec une contre courbure lombaire sous-jacente ;
- •
C = courbures lombaires et les courbures thoraco-lombaires avec départ ilio-lombaire oblique, sans contre courbure lombaire inférieure.
Nous avons considéré comme évolutive toute majoration entre deux examens successifs de l’angle de Cobb d’au moins l’une des courbures, en considérant trois seuils d’évolutivité : 5 degrés, ce qui correspond au seuil généralement admis dans la littérature, 3 degrés correspondant à la limite inférieure de variabilité intra-observateur de la lecture des radiographies rapportée par Morrissy et al. et aussi 10 degrés, seuil utilisé par d’autres auteurs .
2.2.3
Les paramètres de topographie tridimensionnelle du dos
Nous disposions pour notre étude du système de topographie de surface du dos Biomod™-L dont la reproductibilité des mesures a été étudiée sur de jeunes patients scoliotiques .
Avant chaque examen topographique, le clinicien plaçait quatre marqueurs cutanés au niveau de la saillie de l’épineuse C7, des fossettes de Michaelis et du sommet du pli inter fessier. Puis, il repérait la ligne des épineuses par palpation et la traçait au crayon.
Afin de prendre en compte les biais dus à la posture, les acquisitions étaient réalisées dans deux positions :
- •
la position 1, dite « position enroulée » : debout, épaules enroulées, pour dégager la surface du dos du relief des omoplates, permettait de mesurer plus précisément les gibbosités thoraciques ;
- •
la position 2, dite « position en appui » : debout, en position naturelle, mains sur des barres verticales, était similaire à celle utilisée pour la prise de clichés radiologiques .
Après validation du repérage des marqueurs cutanés par le clinicien, l’appareil calculait automatiquement les valeurs angulaires des courbures rachidiennes projetées dans le plan frontal (définies comme l’angle entre les normales à la ligne spinale les plus inclinées) ( Fig. 1A ). Pour éviter les confusions avec les courbures radiologiques, ces angles ont été nommés angles de sinuosité comme le définissait Stagnara . Les gibbosités, définies par l’angle formé par la tangente aux saillies thoraciques ou lombaires par rapport au plan frontal du patient, étaient automatiquement calculées à chaque niveau et apparaissaient sur un diagramme interactif permettant de visualiser les gibbosités maximales et de situer un curseur en regard ( Fig. 1B ).

Related posts:
 Enhancing Annalsvalue through quality
Six years of bilingual edition for The Annals of PRMare coming to an end
Validation of an Arabic version of the Oswestry index in Saudi Arabia
Use of psychoactive substances in persons with spinal cord injury: A literature review
Teres major tendon tears in a professional boxer
The motor function measure to study limitation of activity in children and adults with Charcot-Marie-Tooth disease
Enhancing Annalsvalue through quality
Six years of bilingual edition for The Annals of PRMare coming to an end
Validation of an Arabic version of the Oswestry index in Saudi Arabia
Use of psychoactive substances in persons with spinal cord injury: A literature review
Teres major tendon tears in a professional boxer
The motor function measure to study limitation of activity in children and adults with Charcot-Marie-Tooth disease
Stay updated, free articles. Join our Telegram channel

Full access? Get Clinical Tree


