Fig. 9.1
Illustration of relevant neuro-urological relationships for the pure motor-to-motor and pure sensory-to-sensory nerve reconstruction procedure
9.2.2.2 Measurement of Internal Bladder Pressure
After a vertical lower abdominal incision was performed and the bladder was exposed, a 1.0-mm incision was made in the bladder wall and a 0.75-mm diameter catheter was inserted. Then, a pressure monitoring probe was put into the bladder to measure the internal vesicular pressure. The pressure monitoring probe was linked to a pressure transducer that sent the pressure signal to a SMUP-E biological signal processing system (BSPS; Department of Physiology and Pathophysiology, School of Medicine, Fudan University, Shanghai, China). The stimulating electrodes were put on the S2 dorsal roots (DRs) bilaterally. The intravesicular pressure curves were recorded before and after the L6-S4 spinal cord segments were transected via the SMUC-E biological signal processing system. The stimulus intensity was 3 mA, with a pulse width of 0. 3 ms, a frequency of 20 Hz and a duration of 5 s.
9.2.2.3 Electrophysiological Studies
The bladder and bladder nerve plexus of each rat were exposed through a vertical incision on the lower abdominal wall. Then, a silver bipolar electrode was hooked onto the bladder nerve plexus, and a further silver bipolar electrode was sutured onto the bladder wall using 6–0 nylon suture material. After that, the rat was placed in the prone position. The VR and DR anastomoses of the L5 and the S2 nerves were carefully dissected from surrounding scar tissue via the original incision and exposed with the assistance of an operating microscope. The stimulating electrodes were placed on the S2 DRs bilaterally. Bladder plexus action potentials were recorded via the bipolar hook electrode that was connected to the bladder plexus. An extra ground electrode was fixed to the abdominal musculature of the rat. The resulting action potentials in the bladder nerve plexus were examined using a stimulation intensity of 3 mA and a stimulation period of 0.3 ms. Compound muscle action potentials of bladder smooth muscle were recorded with a stimulation intensity of 3 mA, a pulse width of 0. 3 ms, a frequency of 20 Hz and a duration of 5 s. The L6-S4 spinal cord segment was then surgically transected, leaving the spinal nerves intact, and repeated recordings were made of the action potentials described above.
All signals were digitalized and analyzed using MFLab software Version 3.01 (Department of Physiology and Pathophysiology, School of Medicine, Fudan University).
9.2.2.4 Histological Examination
All rats were sacrificed after the electrophysiological studies were completed. Specimens that included the proximal and distal stumps of nerve repair sites were harvested and prepared for histological examination. The nerves were fixed overnight in a solution of phosphate-buffered 2.5 % glutaraldehyde, after which samples were serially dehydrated with gradient alcohols and embedded in Spurr’s resin. Two 2-mm long segments were obtained 1 mm proximal and 1 mm distal from the nerve graft repair site and were sectioned. Transverse sections that were 1-μM thick were obtained and stained with 1 % toluidine blue. One section from every three cuts was stained. A total of five sections from the proximal segment and five sections from the distal segment of each nerve were analyzed for the total number of myelinated axons. To determine the total number of axons, each histological section was digitally photographed (Panasonic WV-CP410, Panasonic, Japan) together with an optical microscope (Leica DWLB2, Strasse, Austria). Leica FW4000 Image Analysis Software (Leica Microsystem) was employed to conduct the neuronal morphometric analysis, and the axon counts in all fields were then averaged. An index representing the percentage of axons that crossed the repair site was calculated according to the following formula:


9.2.2.5 Statistical Analysis
Results were interpreted as the mean ± standard deviation. SPSS 13.0 software (SPSS Inc., Chicago, IL) was adopted for the statistical analysis. The analysis of variance (ANOVA) was utilised to compare differences between groups, and results were considered as significant value when p-values were <0.05.
9.2.3 Results
Sixteen animals were excluded from the analysis as they had to be sacrificed during the follow-up period. These animals had developed chronic health problems, which were evidently caused by complications from the procedure such as infected pressure sores or severe and recurrent urinary tract infections. The results presented below are based on the remaining 14 rats that remained well generally during the follow-up period.
9.2.3.1 Action Potentials of the Vesicular Nerve Plexus
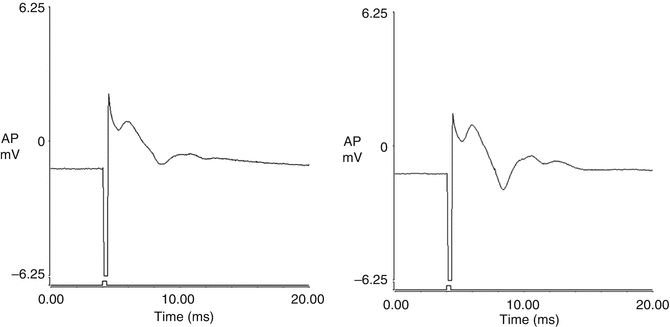
Bladder plexus action potentials were recorded both before and after spinal cord transection using the same electrical stimulus to excite the distal end of the left L5-S2 dorsal root anastomosis distal to the nerve graft. The amplitude of the evoked potentials was 0.11 ± 0.02 mV prior to transection and 0.12 ± 0.04 mV after transection, which was non-significant. The shape of the curve recorded on the left side was similar to that on the control side when the right-sided S2 DR was excited (Fig. 9.2). The amplitude of the evoked potentials on the control side was 0.15 ± 0.03 mV, which was larger than those of the left side (p < 0.01). Action potentials were not detected when the same stimulus was applied to the right-sided S2 DR after spinal cord transection.


Fig. 9.2
Bladder plexus action potentials were recorded both before and after transection of the spinal cord by using the same electrical stimulus to excite the distal end of the left-sided L5-S2 dorsal root anastomosis. The morphology of the tracing recorded on the left side was similar to that from the control side. The amplitude of the evoked potentials on the control side was larger than those of the left side. (a) control side; (b) left side
9.2.3.2 Compound Muscle Action Potentials in Bladder Smooth Muscle
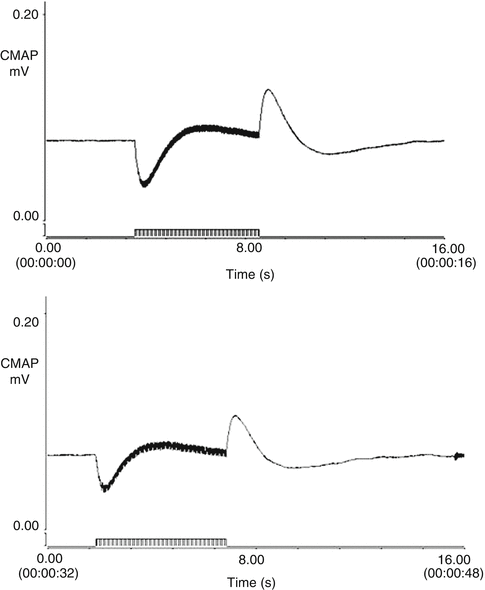
Compound muscle action potentials of bladder smooth muscle were recorded both before and after the onset of paraplegia triggered by L6-S4 transection by stimulating the distal end of the L5-S2 dorsal root anastomosis on the experimental side. The mean maximum amplitudes before and after paraplegia were 0.12 ± 0.03 mV and 0.12 ± 0.02 mV, respectively, which was not a significant difference. The shape of the curve was similar to that of the control side (Fig. 9.3). The amplitude of the right-sided bladder smooth muscle compound muscle action potential was 0.17 ± 0.03 mV, which was significantly larger than those on the left side (p < 0.01). When the same stimulus was applied to the right-sided S2 DR after paraplegia was induced, a compound muscle action potential could not be elicited from the bladder smooth muscle.


Fig. 9.3


Compound muscle action potentials of the bladder smooth muscle were recordable both before and after the onset of paraplegia caused by L6-S4 transection by stimulating the distal end of the L5-S2 dorsal root anastomosis on the experimental side. The morphology of the tracing was similar to that of the control side. The amplitude of the compound muscle action potentials of the right-sided bladder smooth muscle was significantly larger than that of the left side. (a) control side; (b) left side
Stay updated, free articles. Join our Telegram channel

Full access? Get Clinical Tree


