CHAPTER 6 Radiology
INTRODUCTION
Remarkable advances in diagnostic imaging of the spine have occurred over the last several decades. Since magnetic resonance imaging (MRI) was introduced into clinical practice in the mid 1980s it has rapidly assumed the preeminent role in spinal imaging as a result of its abilities to display exquisite anatomic images and to accurately characterize a broad spectrum of diseases encompassing degenerative, inflammatory, infectious, traumatic, neoplastic, and congenital disorders.1–3 Nonetheless, MRI has limitations. Conventional radiographs (plain films), computed tomography (CT), and myelography combined with postmyelography computed tomography (myelo CT) also play important roles in the evaluation of spine pathology.4 In this chapter the roles, advantages, disadvantages, and techniques for each of these imaging modalities will be discussed, followed by considerations of imaging the normal spine and a number of spinal disorders commonly evaluated and treated by the spine interventionist.
IMAGING MODALITIES
Conventional radiographs (plain films, X-rays)
Roles
Diagnostic imaging of the spine usually begins with conventional radiographs. Plain films provide an inexpensive and rapid screening of skeletal anatomy and potential abnormalities to guide further clinical evaluation and imaging. Primary care patients with low back pain who were screened with plain films and rapid MRI had nearly identical clinical outcomes, and plain film screening was less expensive.5 The spinal segments are readily counted and the alignment, size and shape of the vertebral bodies are easily assessed. Plain films screen for degenerative disease that can be demonstrated by disc interspace narrowing, osteophytes, and endplate sclerosis. Grossly destructive neoplastic or infectious/inflammatory processes can be diagnosed by cortical bone destruction or vertebral collapse. Plain films of the lumbar spine readily depict pars defects (spondylolysis) and spondylolisthesis. Conventional radiographs provide rapid and cost effective evaluation of skeletal spine trauma although CT is assuming an increasingly important role.6,7 Flexion and extension plain films evaluate spinal stability in trauma and postsurgical cases. For the interventionist this study is particularly important for patients who experience pain during extension or show evidence of spondylolisthesis with plain films. Conventional radiographs provide intraoperative guidance and postoperative assessment of surgical hardware, bone grafts, alignment, and stability.
Technique
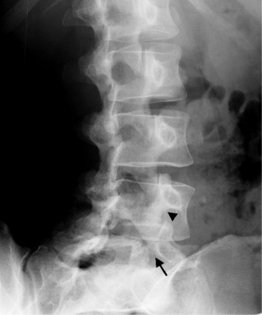
A standard complete cervical spine radiographic examination includes anteroposterior (AP), lateral, bilateral oblique, and open mouth views. A ‘swimmers’ lateral with one shoulder elevated and the other depressed is used for trauma if C6 and C7 are not well visualized on the conventional lateral view. For thoracic spine evaluation AP and lateral views are usually sufficient. Lumbar spine radiographs are tailored to the indication. A full examination consists of AP, both oblique, and lateral views. The oblique view provides the ‘Scotty dog’ image that is most useful to evaluate the pars interarticularis for a defect (spondylolysis) and the facet joints (Fig. 6.1). In some, cases such as for surgical guidance or for a postoperative assessment, one or two views may suffice.
Magnetic resonance imaging
Advantages
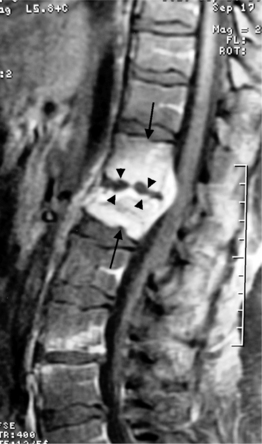
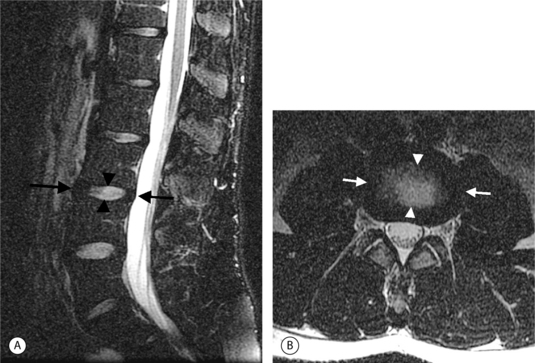
The superior contrast resolution of MRI depicts the soft tissue anatomy of the spine better than plain films and CT. MRI is comparable to CT and bone scans for most pathologic processes causing neurological compromise and is better than CT for the detection of systemic diseases.1 The spinal cord, nerve roots, CSF, vertebrae, discs, and ligaments can be exquisitely resolved and distinctly visualized.6 Multiplanar tomographic imaging optimally displays three-dimensional anatomic relationships. MRI is able to reveal inflammatory, traumatic, and infectious processes using image acquisitions that are sensitive to edema such as fat-suppressed T2-weighted fast spin echo (FSE) and short tau inversion recovery (STIR) pulse sequences.6 Gadolinium-enhanced images display inflammatory processes (with fat-suppression) (Fig. 6.2), tumors, and distinguish scar from disc in postoperative patients. Ionizing radiation is not used. There are no known risks of MRI for patients without a contraindication except for exceedingly rare allergic reactions to gadolinium injections.
Disadvantages
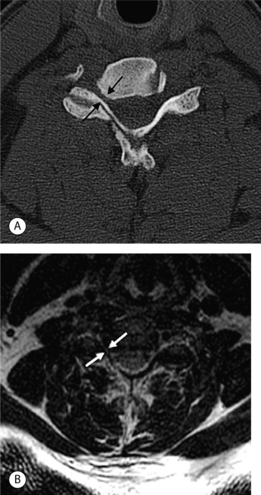
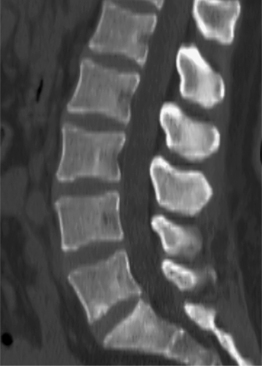
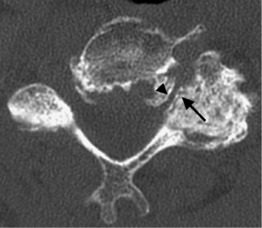
MRI is expensive and the examination time is longer than for plain films and CT scans. MRI may not display bony pathology such as cervical foraminal stenosis as well as CT (Fig. 6.3).6 Access to the patient in the scanner is limited and the introduction of ferromagnetic objects into the strong magnetic field can be hazardous. This makes a MRI examination of unstable and critically ill patients more difficult. Rapid patient access and resuscitation can be compromised. Some individuals experience severe claustrophobia inside the bore of the magnet. It is dangerous to place patients with cardiac pacemakers and ferromagnetic implants into the strong magnetic field of the MRI scanner. Most cochlear implants, ocular implants, and neurostimulators as well as some aneurysm clips are not MRI compatible. Most of the orthopedic hardware, surgical clips, and staples currently in use are safe. Cardiac valve prosthesis, vascular stents, wires, and coils are usually MRI compatible but require different amount of time after placement before the patient can be safely placed in the magnetic field. In general, a published resource such as the ‘Reference Manual for Magnetic Resonance Safety, Implants and Devices’ or the manufacturer should be consulted if the patient reports any implanted medical device or retained metallic foreign body. Knowledge of the exact name and manufacture of a device is necessary to determine its safety; if this information is not available, it is recommended that the patient not undergo MRI scanning.8
Images in the region of surgical hardware may be nondiagnostic.9 There is limited experience with dynamic studies of the spine and studies with physiological spine loading, and these examinations are not readily available at most centers.
Technique
Lumbar spine MRI exams typically include both sagittal and axial acquisitions using T1- and T2-weighted pulse sequences. Sagittal images should be carried from one neural foramen to the other neural foramen with thin slices and a minimal interslice gap. Sagittal and axial T1-weighted spin echo images are useful to evaluate the vertebral body marrow, epidural, and foraminal fat. T2-weighted fast spin echo (FSE) images evaluate the disc space, nerve roots, and facets. CSF is brighter than discs, nerve roots, cartilage, bone, and ligaments on a T2-weighted FSE acquisition. Axial 3–5 mm images are angled parallel to the disc interspace to optimally evaluate disc morphology. The images are carried from the pedicle above the disc interspace to the pedicle below to look for migrated free fragments. Since fat is relatively bright on T2-weighted FSE images, the sagittal T2-weighted FSE images can be obtained with fat-suppression to evaluate the vertebrae for edema associated with trauma, infection, or inflammation. Postgadolinium (contrast enhanced) axial and sagittal T1-weighted images are obtained for specific indications, including postoperative evaluations to distinguish a disc herniation from scar tissue, possible infection/inflammation, and tumors.
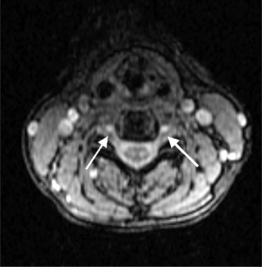
MRI pulse sequences for cervical spine imaging typically include sagittal and axial T1-weighted, axial and sagittal T2-weighted FSE, and axial three-dimensional T2-weighted gradient echo images. T1-weighted sagittal images assess the vertebrae for size, shape, and alignment and for marrow signal intensity. T2-weighted axial and sagittal FSE images evaluate the spinal cord, nerve roots, and facets. Thin section (e.g. 1.5 mm) axial three-dimensional T2-weighted gradient echo images are valuable in the cervical spine. On these images, the disc is variably moderate in intensity, CSF is very bright, and bone is dark. The nerve root sleeves containing CSF in the neural foramina are optimally visualized (Fig. 6.4). This is important since T1-weighted images are not as useful to evaluate the cervical neural foramina as for the lumbar spine because there is less fat. Compression of the nerve roots or spinal cord by osteophytes or disc herniations is demonstrated with high sensitivity. Gradient echo images, however, can artifactually accentuate the apparent degree of bony stenosis due to susceptibility effects. The FSE images are less sensitive to susceptibility effects; therefore, the degree of bony central canal stenosis is best estimated on sagittal T2-weighted FSE images. Sagittal short tau inversion recovery (STIR) images are valuable to evaluate the soft tissues, especially the ligaments, in trauma cases.10
Computed tomography (noncontrast)
Roles
Noncontrast CT may answer important clinical questions not answered by MRI, particularly about bony detail such as the integrity of the posterior vertebral body cortical bone in a patient with a malignant compression fracture being evaluated for vertebroplasty. Bony stenoses of the neural foramina in the cervical spine are depicted more accurately than on MRI.6 Noncontrast CT often depicts subtle fractures and displacements such as facet jumps better than plain films.7 It can also image skeletal anatomy not adequately visualized on plain films in trauma patients, in particular the C1–2 and C6–7 regions. CT can be used to as a less expensive alternative to MRI to screen patients with lumbar radiculopathy. CT is routinely used to characterize bony tumors of the spine due to its exquisite depiction of bony detail and ability to display calcifications, osseous and cartilaginous matrix.
Technique
Spiral CT of the spine is currently performed with 1–3 mm collimation depending on the region being evaluated and the specifications of the CT scanner. In the cervical spine 1–1.5 mm collimation is routinely used on multislice row detectors. Images are reviewed in both soft tissue and bone windows. Sagittal and coronal reconstructions are obtained when indicated. Computed tomography utilizes a highly collimated X-ray beam, which is registered by the detector after passing through the patient. The original CT developed by Godfrey Hounsfield in 1972 had one X-ray source and one detector rotating around the patient. Current CT scanners have many rotating X-ray tubes and detectors that acquire data as the patient is continuously advanced through the bore of the scanner (helical or spiral scanning). X-ray sources and detectors can be aligned in several rows, which allow simultaneous image acquisition at several levels. This configuration can obtain thinner slices in a shorter time. Attenuation values of the X-ray beam passing through the tissue at many various angles are computed using a projection reconstruction technique and a number is assigned to every pixel (picture element); these calculated values of relative attenuation are called Hounsfield units. By one convention, 0 is the Hounsfield number of water and 1000 is the Hounsfield number for air. Materials such as bone and metal that attenuate more of the X-ray beam are assigned higher numbers. Assigning each pixel a grayscale value based on its Hounsfield number creates images. Window level refers to the Hounsfield number at the middle of the grayscale range and window width refers to the number of Hounsfield units that span the grayscale range from black to white. If the window width is large, there is less contrast between tissues with relatively close attenuation values, but many different tissues with a wide range of attenuation parameters will be shown in different grades of gray. A narrow window helps to demonstrate even small differences in tissue attenuation within the chosen window, but all of the tissues with Hounsfield units above or below the window limits will be completely white or black. Specific windowing protocols vary among scanners and manufacturers. A typical soft tissue window level is 50 and window width is 450, while a typical bone window level is 350 and window width is 2000. Different mathematical reconstruction algorithms can be applied to increase contrast between structures. A bone algorithm is particularly helpful to accentuate bony margins and interfaces of bone with air and soft tissues.
Myelography and postmyelography CT
Roles
Myelography and postmyelography CT are used to study patients with surgical hardware that renders MRI images nondiagnostic, and as problem solving tool for patients with equivocal or discordant findings on MRI, and for patients with a contraindication to having a MRI examination. Myelography and postmyelography CT provides additional information to that obtained from a MRI in exam 33% of patients with lumbar degenerative disease.11 It is often the definitive imaging study for cervical myelopathy and radiculopathy since it is the gold standard for detecting osteophytic impingement on cervical nerve roots. Myelography and postmyelography CT can be useful to detect small tumor implants on nerve roots and also arachnoiditis.
Advantages
Postmyelography CT provides the definitive assessment of central stenosis and the degree of cord compression in the cervical spine. Myelography and postmyelography CT can demonstrate herniated discs in the cervical spine neural foramina missed on MRI. Subtle compression of nerve roots in the lumbar lateral recesses is demonstrated better on myelography than postmyelography CT or MRI.12 Myelography and postmyelography CT provide better assessment of the spinal canal and nerve roots than MRI in the region of surgical hardware. Myelographic films can be obtained with the patient standing and during flexion and extension to evaluate dynamic abnormalities during physiologic loading.13
IMAGING OF THE NORMAL SPINE
Spinal cord and nerve roots
The spinal cord extends from the caudal aspect of the medulla oblongata at the upper border of the first cervical vertebra (C1) to its inferior termination as the conus medullaris occurring variably from the twelfth thoracic vertebra (T12) to the second lumbar vertebra (L2). The filum terminale is a fibrous cord that extends caudally from the tip of the conus. It initially travels intradurally and then merges with the dura to insert in the coccyx. The nerve roots extending inferior to the conus are called the cauda equina. The sacral roots are positioned centrally and posteriorly within the thecal sac; the lumbar roots are located anterolaterally.14
There are two regions of normal spinal cord expansion, one in the lower cervical cord extending approximately from C4 to T1 and the other in the lower thoracic cord extending approximately from T9 to T12. These normal regions of cord enlargement supply the brachial and lumbosacral plexuses, and should not be misinterpreted as pathologic.14
The spinal cord gives rise to 31 paired sets of spinal nerves: 8 cervical, 12 thoracic, 5 lumbar, and 5 sacral, and 1 coccygeal. The first cervical spinal nerve is purely sensory and exits the spinal canal above the ring of C1; the second spinal nerve exits into the C1–2 neural foramen above the C2 pedicle, and so on to the seventh cervical spinal nerve exiting into the C6–7 neural foramen. The eighth cervical spinal nerve exits into the C7–T1 neural foramen. In the cervical region the nerve roots occupy the lower portion of the foramen at the same level as the disc interspace. Each thoracic and lumbar spinal nerve exits the canal beneath its like-numbered pedicle so that the first thoracic spinal nerve exits beneath the T1 pedicle into the T1–2 neural foramen, the first lumbar spinal nerve exits beneath the L1 pedicle into the L1–2 neural foramen, and so on. Sensory (dorsal) and motor (ventral) nerve roots arising from the spinal cord join to form the spinal nerves. The dorsal root ganglion contains the sensory nerve cell bodies and lies in the neural foramen near the junction of the dorsal and ventral roots. A conjoined root consists of two nerve roots traveling in the same dural sleeve; it is a normal anatomic variant occurring in approximately 5% of patients. The conjoined roots may exit through the same or different neural foramina.14
In the lumbar spine each nerve exits the thecal sac enclosed in a root sleeve of variable length entering the lateral recess (subarticular space) bounded by the vertebral body anteriorly, the pedicle laterally, and the superior articular process posteriorly (Fig. 6.5).14 The minimum normal diameter of the lateral recess is 3–4 mm. The lateral recesses are best imaged on axial CT and MRI images. The nerve root passes inferiorly and laterally into the upper portion of the neural foramen above the level of the disc interspace surrounded by fat. The neural foramen is keyhole-shaped and widest superiorly (Fig. 6.6).15 The neural foramen is optimally examined on sagittal MRI, reconstructed sagittal CT, and oblique plain films.
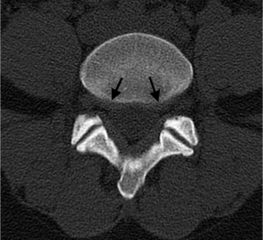
Fig. 6.5 Normal lumbar lateral recesses. Axial CT demonstrates normal L4–5 lateral recesses (arrows).
On T1-weighted MRI the spinal cord and nerve roots have a uniform intermediate signal intensity that is brighter than the surrounding relatively low signal intensity CSF (Fig. 6.7A). On T2-weighted images, the spinal cord and intrathecal nerve roots are extremely well visualized as relatively hypointense structures bathed in bright surrounding CSF (Fig. 6.7B). The nerve roots in the cervical foramina are best seen on high-resolution three-dimensional T2-weighted axial images outlined by surrounding bright CSF in their nerve root sleeves (see Fig. 6.4). In the lumbar foramina the nerve roots are visualized best on axial and especially sagittal T1-weighted images surrounded by the hyperintense fat within the foramen (see Fig. 6.6).16 The spinal cord normally does not enhance; however, enhancement of normal spinal nerve roots has been reported. Extensive nerve root enhancement, thickening, and nodularity are abnormal.
On CT images the spinal cord and nerve roots are difficult to distinguish from surrounding CSF unless intrathecal contrast is used (Fig. 6.8). The spinal cord and nerve roots are silhouetted by intrathecal contrast on myelogram radiographs.
Vertebrae
The spine contains 7 cervical, 12 thoracic, and 5 lumbar vertebrae, the sacrum (consisting of 5 fused elements), and the coccyx. Except for the uniquely shaped first and second cervical vertebrae, the vertebrae have a generic shape that consists of an anterior cylindrically shaped vertebral body and the posterior elements consisting of the pedicles, transverse processes, superior and inferior facets, lamina, and spinous process.14
There are important regional variations in the morphology and size of the vertebrae. The first and second cervical vertebrae have unique shapes. The first cervical vertebra (the atlas) does not have a discrete body; it consists of a ring comprised of anterior and posterior arches connected by lateral masses that articulate with the occipital condyles above and the second cervical vertebra below. The axis, the second cervical vertebra, has a unique superior projection (dens) extending from the C2 vertebral body to articulate with the anterior arch of C1, secured by the transverse and subsidiary ligaments.14 The distance between the posterior border of the anterior arch of C1 and the anterior border of the dens should be 3 mm or less in an adult and 5 mm or less in a child.
The cervical vertebrae from C3 to C7 are conventionally shaped and increase in size progressing caudally. They have unique uncinate processes that extend superiorly from the lateral aspects of the vertebral bodies to articulate with the vertebra above forming the uncovertebral joints (joints of Luschka). Spurs extending from the uncinate processes may compromise the nearby neural foramen. The superior and inferior facets are fused into the articular pillars. The vertebral arteries pass through foramina in the transverse processes of C1 to C6.14 The central canal of the cervical spine is triangular, measuring a minimum AP diameter of 15 mm at C1–2 and 12 mm in the lower cervical region.
The 5 lumbar vertebrae are the largest. The lumbar spinal canal usually is triangular in shape; less frequently it may be oval. The minimal normal AP diameter of the lumbar spinal canal is 11.5 mm and the minimal cross-sectional area is 1.45 mm2 (Fig. 6.9). The interpedicular distance increases slightly from L1 to L5.
The MRI appearance of the vertebrae is age dependent.17 The vertebral marrow is normally red (hematopoietic) during childhood, gradually converting to yellow (nonhematopoietic) by adolescence.17 Normal adult yellow bone marrow is relatively hyperintense on T1-weighted images due to the fat, and should always be brighter than the intervertebral discs. Marrow fat distribution can be heterogeneous, so some mild signal heterogeneity on the T1-weighted images is common. The vertebrae are hypointense on conventional T2-weighted spin echo sequences; the normal intervertebral discs are brighter. On fast spin echo (FSE) T2-weighted sequences the marrow is more hyperintense and lesions causing bone edema may be obscured unless fat suppression is used. The vertebrae display mild homogeneous enhancement after gadolinium administration. Since there are few mobile protons to provide MRI signal in the cortical bone, it appears as a thin, uniform, dark line outlining the bone marrow.
Intervertebral discs, anterior and posterior longitudinal ligaments
The discovertebral complex consists of the cartilaginous endplate, anulus fibrosus, and nucleus pulposus. The well-hydrated nucleus pulposus is a fibrocartilage remnant of the primitive notocord. It is less well structured than the outer anulus fibrosus, occupies a large portion of the disc during childhood, and is bright on T2-weighted images (Fig. 6.10). With progression though adolescence into early adulthood, a horizontal low signal band develops in the center of the nucleus on T2-weighted images that corresponds to the development of higher collagen concentration in the equatorial region. This is called the intranuclear cleft and is a part of normal maturation (Fig. 6.11).
The surrounding anulus fibrosus consists of multilayered (up to 15) dense parallel fibrous bands. The outer ring of the anulus fibrous contains peripheral lamellae that insert into the bony ring apophysis (Sharpey’s fibers) (see Fig. 6.10A). The outer anulus is relatively dark on T1- and T2-weighted images. The inner ring of the anulus is brighter on T2-weighted images and gradually merges with the nucleus. Both the nucleus and anulus have similar signal intensities on T1-weighted images and are difficult to distinguish. The nucleus is eccentrically located toward the posterior aspect of the disc. The posterior anular fibers are thinner and smaller in number. The outer annular fibers merge with the anterior and posterior longitudinal ligaments.
The lumbar intervertebral discs increase in width from L1–2 to L4–5. The L5–S1 disc thickness is variable and may be less. The thoracic discs are uniformly thinner than the lumbar discs. The cervical discs are more wide anteriorly than posteriorly.14 Cervical discs have a less well-defined nucleus and anulus with less of a discrete posterior anulus.
The anterior (ALL) and posterior (PLL) longitudinal ligaments are dense fibrous bands that are low signal intensity on T1- and T2-weighted MRI images. The ALL lies adjacent to the anterior surface of the vertebral bodies and intervertebral discs. It forms a layer that is attached to the outer anulus and provides some fibers that attach to the vertebral body. The PLL merges with the outer anulus at the disc interspace (Fig. 6.12). The PLL is separated from the posterior surface of the vertebral body by the venous plexus in the ventral epidural space and lies just anterior (ventral) to the thecal sac (Fig. 6.12). A midline septum attaches the PLL to the periosteum of the posterior vertebral body and serves to compartmentalize the ventral epidural space.18
IMAGING OF THE ABNORMAL SPINE
Degenerative disease
Nomenclature
The use of ambiguous terminology to describe findings on spine imaging has interfered with clear and precise communication between radiologists and clinicians. To address this significant problem, cooperative multispecialty task forces of the North American Spine Society, American Society of Spine Radiology, and the American Society of Neuroradiology have proposed standardized nomenclature for lumbar disc pathology.19 These recommendations have been endorsed by the parent societies of the task forces, the Joint Section on Disorders of the Spine and Peripheral Nerves of the American Association of Neurological Surgeons, and the Congress of Neurological Surgeons, and the CPT and ICD coding Committee of the American Academy of Orthopedic Surgeons.19
The definitions recommended by the task forces are based on anatomy and pathology and are not intended to imply etiology or clinical significance. Although these definitions were developed specifically for lumbar disc pathology, it seems logical to extrapolate the use of these terms to the thoracic and cervical spine.19
The lumbar disc is classified into the following general diagnostic categories: normal, congenital/developmental variation, degenerative/traumatic, infectious/inflammatory, neoplastic, and morphologic variant of uncertain significance.19
The normal category includes a morphologically normal disc in a young adult and does not include degenerative, developmental, and adaptive changes that may be considered clinically normal, such as the changes typically associated with aging.19
The congenital/developmental variation category includes congenitally abnormal discs and adaptive disc changes in response to abnormal biomechanical forces, for example, morphological disc changes due to scoliosis or spondylolisthesis.19
Within the degenerative/traumatic subcategories, a number of more specific terms are defined.19 Annular tears (annular fissures) are separations between annular fibers, avulsion of fibers from vertebral attachments, or breaks in the fibers that extend radially, transversely, or horizontally through the lamellae.19
Herniation is defined as a localized displacement of disc material (any combination of nucleus, anulus, endplate, cartilage, or bony ring apophysis) beyond the limits of the disc interspace involving less than 50% of the disc circumference. The disc interspace is defined craniocaudally by the edges of the vertebral endplates and laterally by the outer margins of the ring apophyses, without the inclusion of osteophytes. Herniations are further described as focal (involving <25% of the disc circumference) or broad-based (involving 25–50% of the disc circumference). Generalized disc displacements involving >50% of the disc circumference are called bulges.19 Despite the obvious utility of standardized nomenclature, experienced interpreters demonstrate significant interobserver variability describing lumbar spine disc disease.20
A herniation can be subcategorized as a protrusion or extrusion on the basis of its shape. A herniation is defined as a protrusion if the distance between the edges of disc material beyond the interspace is always less than the distance between the edges of the base of the herniation in the same plane. A herniation is called an extrusion if any distance between the edges of the disc material beyond the interspace is greater than the distance between the edges of the base of the herniation in the same plane. Protrusion and extrusion are defined solely on a morphological basis; the terms do not refer to whether or not the anulus is intact.19
A sequestration (free fragment) is a subtype of an extrusion where the displaced disc material has lost continuity with the parent disc. Migration refers to displacement of the disc material away from the site of the extrusion, whether or not it is sequestrated. Craniocaudal disc herniations through the vertebral body endplate are called intervertebral herniations (Schmorl’s nodes). Disc herniations are contained if covered by an intact anulus and uncontained if not covered. MRI frequently cannot distinguish contained from uncontained herniations. Discography can demonstrate an uncontained herniation.19
The volume of the herniation can be categorized on the axial image showing the most significant impact on the canal. Compromise of less than one-third of the canal is defined as mild, compromise of one-third to two-thirds of the canal is moderate, and compromise of more than two-thirds of the canal is severe.19
The description of a disc herniation can include the following: morphology (protrusion, extrusion, broad-based, focal), status of containment (by the outer anulus), continuity (sequestered or free), relationship with the PLL (subligamentous), volume (spinal canal or foraminal compromise), composition (disc, cartilage, bone, and ligament), and location.19 Some consider a recurrent disc contained if it is limited by scar tissue.
The term degeneration includes the findings of disc desiccation, fibrosis, and narrowing, numerous annular tears, mucinous annular degeneration, endplate sclerosis, and osteophytes. Two distinct degenerative patterns have been described. The first pattern, spondylosis deformans, affects the anulus fibrosus and adjacent ring apophysis. It is believed to be a consequence of normal aging with findings that include anterior and lateral osteophytes, disc dehydration without disc interspace narrowing, small transverse and concentric annular tears, and small amounts of gas in the annular entheses. Posterior osteophytes are not considered to be an element of spondylosis deformans. The second pattern, intervertebral osteochondrosis, affects the nucleus pulposus and the endplates. It is considered pathologic, not due to normal aging. Intervertebral osteochondrosis may or may not be symptomatic. It includes desiccation and narrowing of the disc, extensive gas in the disc, disc bulging, posterior osteophytes that can narrow the spinal canal and neural foramina, endplate sclerosis and erosions, and chronic bone marrow changes adjacent to the disc interspaces.19
The other categories are inflammatory/infection, neoplasia, and morphologic variant of unknown significance. The inflammation/infection category includes infection, inflammatory discitis, and inflammatory spondylitis. Modic type 1 changes are included in this category. The neoplasia category includes morphologic disc changes due to primary or metastatic tumor. Structural abnormalities of the disc without sufficient data to define are placed in the category of morphologic variant of unknown significance.19
Spondylosis deformans
Spondylosis deformans refers to degenerative changes that are associated with the normal aging process, including small concentric and transverse annular tears, decreased hydration of the disc, anterior and lateral osteophytes, and small amounts of gas in the annular entheses. Concentric tears have fluid or mucoid material that is bright on T2-weighted images between lamellar layers. Transverse tears occur at the insertion of the anulus into the ring apophysis, and may contain fluid that is bright on T2-weighted images or gas that is visible on plain films or CT. The discs have decreased water content due content to a decreased glycosaminoglycan/collagen ratio and are moderately less bright on T2-weighted images without a loss in height of the disc interspace. Osteophytes are dark on both T1- and T2-weighted images.19
Intervertebral osteochondrosis
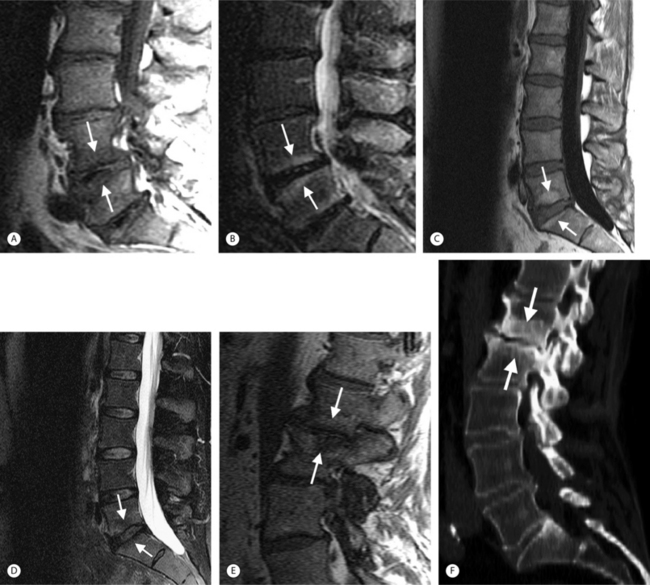
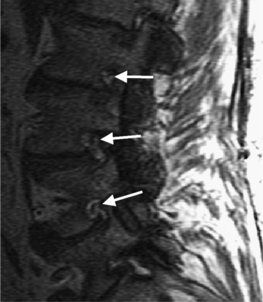
Intervertebral osteochondrosis refers to degenerative changes that are considered pathologic and not due to normal aging, including desiccation and narrowing of the disc, extensive gas in the disc, disc bulging, radial annular tears, posterior osteophytes, endplate sclerosis and erosions, and chronic bone marrow changes adjacent to the disc interspaces. Radial annular tears are failures of multiple annular layers. They are bright on T2-weighted images and may enhance (Fig. 6.13). Such high-intensity zones on MRI have a high specificity for painful annular tears on discography; however, the sensitivity is low.21 Disc desiccation and loss of water content causes decreased disc height and decreased signal intensity on T2-weighted images. Juxta-endplate changes (Modic types 1–3) may be present (Fig. 6.14). Modic type 1 corresponds to increased vascularity in the juxta-endplate vertebra. Its MRI appearance reflects increased water content: dark on T1-weighted images and bright on T2-weighted images (Fig. 6.14A, B). Modic type 2 represents increased fatty marrow: bright on T1-weighted and dark on fat-suppressed T2-weighted FSE images (Fig. 6.14C, D). Modic type 3 denotes sclerotic changes: dark on both T1- and T2-weighted images (Fig. 6.14E, F).22 Posterior osteophytes are also dark on both T1- and T2-weighted images and can narrow the spinal canal and neural foramina. Extensive gas in the disc (vacuum disc) can be seen on plain films and CT, and sometimes seen on MRI.19
Disc herniations
On CT, disc herniations are similar to the density of the parent disc and are higher density than the CSF. On myelogram radiographs, disc herniations are diagnosed by effacement of a nerve root sleeve or by compression of the thecal sac (extradural defect). Myelography is relatively insensitive to lateral (foraminal) disc herniations and also central herniations at L5–S1 since the thecal sac is farther from the disc interspace. Postmyelography CT detects small disc herniations and herniations at L5–S1 missed on myelography.23
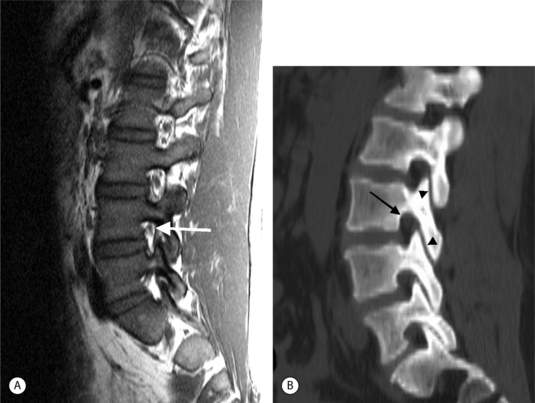
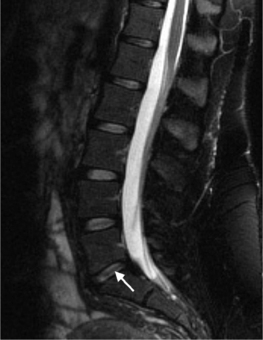
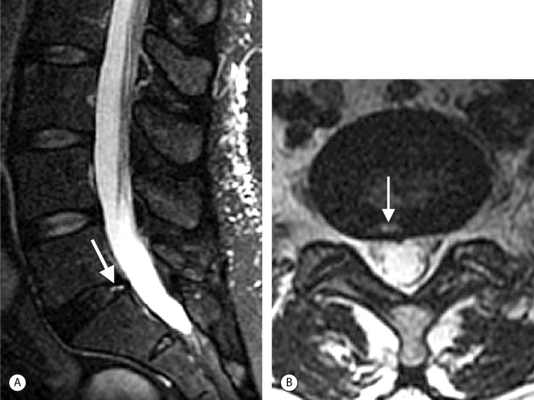
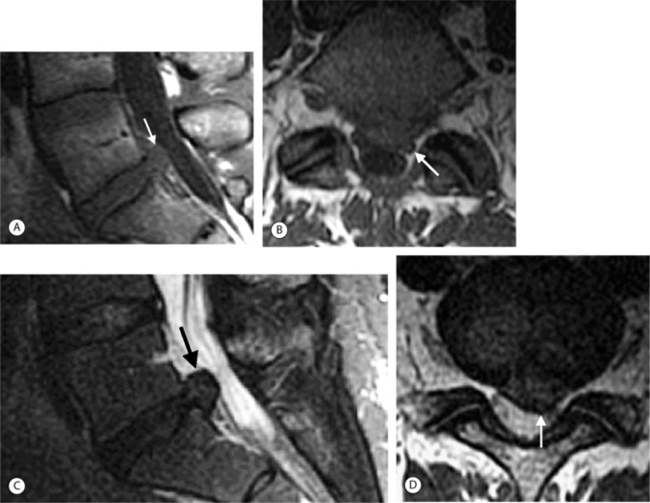
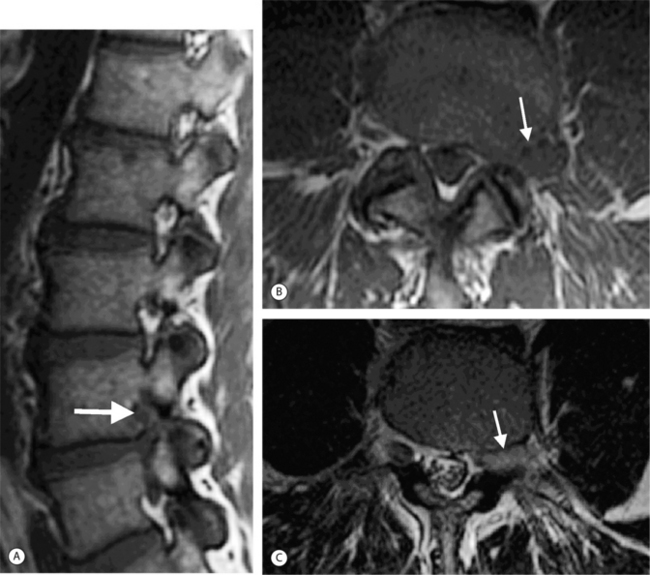
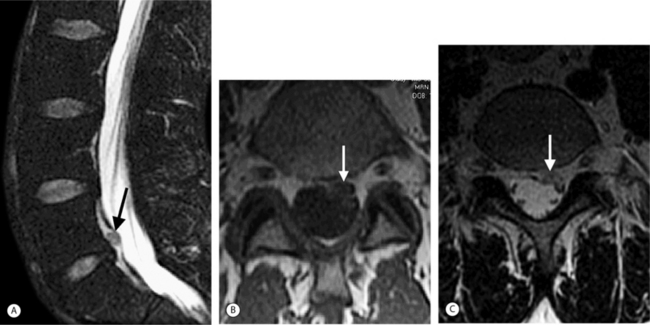
On T1-weighted MRI images, lumbar spine disc herniations are usually iso- to slightly hyperintense relative to the parent disc (Fig. 6.15A, B). Disc herniation signal intensity on T2-weighted FSE images is variable; the herniation is often iso- to hypointense to the parent disc (Fig. 6.15C, D). Posterior disc herniations are often contiguous with a radial tear. Anterior disc herniations are less common and more frequently asymptomatic. Posterior and posterolateral disc herniations usually affect the descending nerve root in the lateral recess, e.g. the L4 nerve root is affected by a L3–4 disc herniation (Fig. 6.15) whereas lateral (foraminal) herniations affect the exiting nerve root, e.g. the L3 nerve root is affected at L3–4 (Fig. 6.16). A prominent localized venous plexus of epidural veins can look similar to a disc herniation on MRI and can cause radicular symptoms.24 MRI anatomically characterizes foraminal and extraforaminal herniations best.25 Effacement of foraminal fat on the sagittal T1-weighted images is an important sign (Fig. 6.16). Sagittal T2-weighted images demonstrate loss of continuity of a sequestered lumbar disc herniation with its parent disc (Fig. 6.17).26 MRI cannot reliably distinguish supraligamentous from subligamentous lumbar disc herniations.27
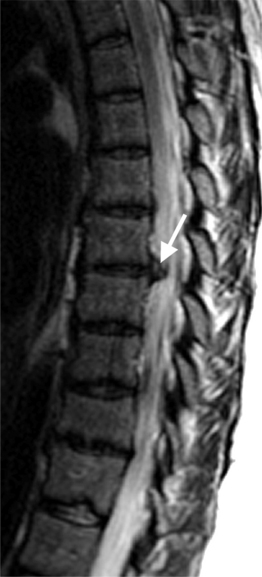
Thoracic disc herniations are quite rare, representing less than 1% of all disc herniations (Fig. 6.18). They present insidiously with myelopathy, back pain, or radiculopathy.28 Myelopathy occurs more commonly than radiculopathy because of the lordotic curve in the thoracic spine. Calcified thoracic disc herniations may be difficult to diagnose on MRI. Myelo-CT may be more definitive in this setting.
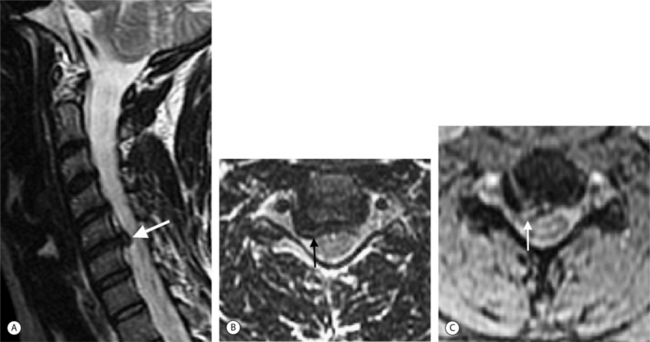
Cervical disc herniations occur most frequently at C5–6 and at C6–7 (Fig. 6.19).29,30 Lateral cervical disc herniations are rare because the uncovertebral joints (joints of Luschka) block the herniation from extending in this direction. The nomenclature designed for lumbar disc pathology also can be used to describe cervical disc disease.
The natural history of disc herniations is varied. Disc herniations clearly can decrease over time with conservative management and clinical improvement can be seen. The mechanisms for this are unknown. Possible factors include disc fragmentation, shrinkage, and phagocytosis. Inflammation and neovascularity around the disc margin may promote resorption.31,32
Spinal stenosis
Spinal stenosis is the term for clinically symptomatic narrowing of the spinal canal or neural foramen. These symptoms include radiculopathy, myelopathy, and neurogenic claudication due to nerve root compression.33–35
In the lumbar spine, there are three zones to consider: the central spinal canal, the lateral recesses, and the neural foramina.34,35 Suggested values in the literature for the normal measurements of these regions vary; the subjective evaluation of the images by an experienced interpreter may provide the most useful correlation with the clinical presentation. As general guidelines, lumbar central canal is considered abnormal if the area is less than 1.5 cm2 or the AP diameter is less than 11.5 mm. The narrowed lower lumbar canal often has a trefoil or ‘T’ shape from posterior spurs, disc bulges, facet hypertrophy, and thickened ligamentum flavum. The trefoil shape is accentuated by congenitally short pedicles. The lateral recess is narrowed if it is less than 4 mm in AP diameter. Hypertrophy of the superior articular facet frequently narrows the lateral recess. Lateral recess narrowing may compress the exiting nerve root. The normal ligamentum flavum is 2–4 mm in thickness. Thicker than 5 mm it is considered hypertrophied.
Lumbar spinal stenosis is frequently evaluated with MRI. Both sagittal and axial planes, and both T1- and T2-weighted pulse sequences provide valuable information. Axial-loaded MRI can reveal more severe central canal stenosis and modify the treatment plan.36 The lumbar neural foramen is best evaluated on sagittal T1-weighted images.37 Sagittal images display the foramen in optimal profile. The lumbar foramen is predominately filled with bright fat that contrasts well with surrounding disc, ligament, and bone. The normal foramen has a ‘key-hole’ shape; the superior aspect of the foramen is larger than the inferior aspect. The inferior aspect of the foramen usually narrows first (Fig. 6.20). The superior portion of the foramen containing the nerve root usually narrows later. Positional MRI of the lumbar spine with patients seated and imaged in flexion and extension demonstrates minor neural foraminal compromise better than conventional supine MRI and correlates with positional pain differences.38
There is still an important role for conventional myelography in the evaluation of patients with lumbar radiculopathy. Lumbar root compression in the lateral recess caused by degenerative changes is demonstrated by myelography with greater sensitivity than postmyelography CT or MRI. Surgically confirmed nerve root compression in the lumbar lateral recess was missed on MRI in 28%, missed on postmyelography CT in 38%, but only missed on conventional myelography in 6%.12
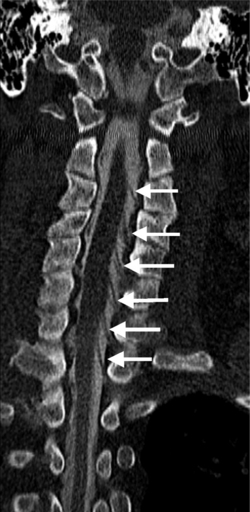
Causes of cervical spinal canal narrowing include osteophytes, ligamentous thickening (posterior longitudinal ligament and ligamentum flavum), disc herniations, and bulges. The cervical spine canal is considered narrow if the anteroposterior diameter measures less than 11 mm. On MRI, this is most accurately determined on sagittal T2-weighted images. MRI can overestimate the degree of stenosis compared to postmyelography CT.39 Kinematic MRI demonstrates that spinal stenosis and cervical cord impingement increases in flexion and extension as degenerative disease progresses.40 Bony stenosis of the cervical neural foramina is displayed best by CT (Fig. 6.21).
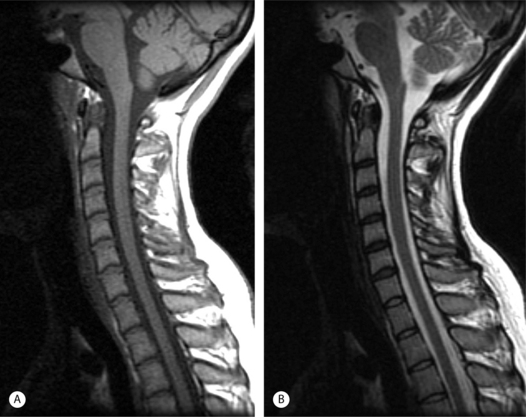
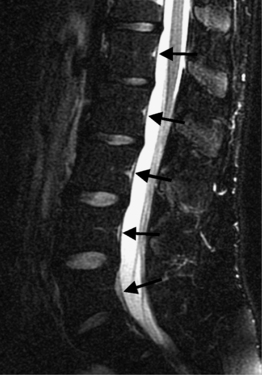
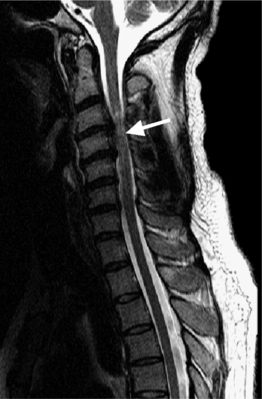
Spinal cord myelopathy caused by spinal stenosis is bright on T2-weighted images (Fig. 6.22). Different patterns have been described and correlated with surgical outcomes. Well-defined and intense intramedullary high signal on T2-weighted images is associated with a poor surgical prognosis.41

Stay updated, free articles. Join our Telegram channel

Full access? Get Clinical Tree


