Osteopenic Bone Diseases and Osteonecrosis
Kenneth G. Saag
Gregory A. Clines
Sarah L. Morgan
 |
A 75-year-old male seen for compression fractures. He relates a strong family history of metabolic bone disease or fractures; his mother had severe osteoporosis, two sisters have osteoporosis, and his father had compression fractures, which complicated his emphysema. He presents with records documenting compressions fractures at thoracic vertebra 11 (T11), T12 and lumbar vertebra 4 (L4) and L5. He has undergone a kyphoplasty at L5. All compression fractures occurred without known trauma. He was initially treated with injectable calcitonin and has been on alendronate for approximately 10 years. He is referred because of concern for future fractures and worsening restrictive long disease in the setting of glucocorticoid-dependent obstructive lung disease.
He indicates that he has a history of infertility and problems with impotence. He has a long history of inhaled glucocorticoid use. There is no history of anabolic steroid use and no history of thyroid disease.
He grew up drinking milk, but currently drinks no milk and eats 2 oz of cheese per week. He consumes no calcium-fortified foods. He generally does not get any significant sun exposure. He consumes 15 glasses of wine per week and 2 oz of hard liquor per week.
His past medical history is remarkable for atherosclerotic heart disease, emphysema, hyperlipidemia, and osteoarthritis. His current medications include alendronate 70 mg/week, calcium carbonate plus vitamin D twice a day, ibuprofen two tablets daily for back pain, montelukast 10 mg orally daily, ipratropium bromide and albuterol sulfate inhaler two puffs four times a day, inhaled.
On physical examination, he is 68 in. tall (driver’s license height is 74 in.), his weight is 238 lb, vital signs are normal. MP’s posture is notable, head bowed forward with a slightly protuberant abdomen. He is wearing an extension brace. Eyes, no blue sclera. Mouth, no exposed bone. The thyroid is palpable without masses.
Lower thoracic kyphosis, no point pain to palpation. Chest, clear and cardiac examination murmur. Abdomen, no organomegaly or pain. Neurologic, nonfocal.
Laboratory data. Chemistry profile normal, calcium = 8.7, alkaline phosphatase = 99, PTH = 67 (nl 12 to 90). CBC, IFE, PSA all normal. Anti tissue transglutaminase (TTG), 5. 25-OH vitamin D total = 43. Calcium/creatinine ratio on a spot urine = 0.10.
The patient is started on teriparatide as an anabolic agent for his bone. There was no history of bone tumors, radiation therapy, and implantable radiation to pose an absolute contraindication. The baseline alkaline phosphates and baseline bone-specific alkaline phosphatase were normal.
Table 21.1 World Health Organization (WHO) Criteria for the Diagnosis of Osteopenic Bone Disease Based on T-score | ||||||||||||
|---|---|---|---|---|---|---|---|---|---|---|---|---|
| ||||||||||||
Introduction
Osteoporosis is a systemic skeletal disease characterized by low bone mass and microarchitectural deterioration of bone tissue with a consequent increase in bone fragility and susceptibility to fracture. The World Health Organization (WHO) definitions of osteoporosis are based on epidemiologic data that relate fracture incidence to bone mineral density (BMD) in Caucasian women (Table 21.1).
By age 60 to 70 years, one of three non-Hispanic Caucasian women will have osteoporosis and the remainder, osteopenia (a state of low bone mass in between normal and osteoporotic BMD); by age 80 years, 70% will have osteoporosis. Figure 21.1 shows the prevalence of osteoporosis and osteopenia in American women both now and into the future.
The estimated number of fractures among North American women was >200,000 in 1990 and is estimated to increase to nearly 500,000 in 2025. The proportion of fractures attributable to osteoporosis is less for nonwhites than whites and less for men than women. The incidence rate for hip fractures is approximately 2 per 1,000 patient-years at age 65 to 69 in Caucasian and non-Caucasian women, and increases to about 26 per 1,000 patient-years at age 80 to 84. The incidence and prevalence of vertebral fractures is low prior to age 50 years and rises almost exponentially thereafter (Table 21.2). Among American women, the incidence of wrist fractures increases rapidly at the time of menopause and plateaus at about 700 per 100,000 person-years after age 60.
The lifetime risk of any fracture in the hip, spine, or distal forearm is about 50% in Caucasian women of age 50 and 20% in Caucasian men of similar age. There are special populations, such as a population of individuals with human
immunodeficiency virus (HIV) where a high prevalence and progression of osteoporosis or osteopenia has been documented. It is anticipated that the prevalence of osteoporosis and likely fractures will grow in this population.
immunodeficiency virus (HIV) where a high prevalence and progression of osteoporosis or osteopenia has been documented. It is anticipated that the prevalence of osteoporosis and likely fractures will grow in this population.
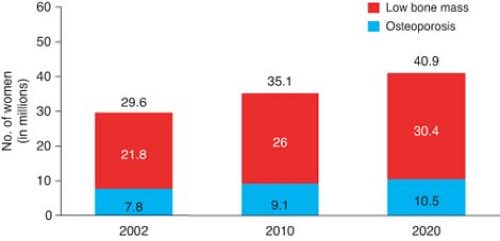 Figure 21.1 Prevalence of low bone mass and osteoporosis in women aged 50 years and older. (National Osteoporosis Foundation, available at: http://www.nof.org/advocacy/prevalence.) |
Clinical Points
Lifetime risk of osteoporotic fracture in Caucasian males is 20%.
Obtain information of height loss over time from a driver’s license.
Unusual z-scores on DEXA scan can represent bone mineral disorder other than osteoporosis.
Osteonecrosis of the jaw is a devastating complication from use of bisphosphonates and is associated with dental procedures.
Diffuse bone pain can be a manifestation of osteomalacia.
Osteonecrosis can be associated with alcohol abuse, prolonged use of corticosteroids, and many medical conditions including sickle cell disease and systemic lupus erythematosis (SLE).
Table 21.2 Estimated Lifetime Fracture Risk in 50-Year-Old White Women and Mena | |||||||||||||||||||||
|---|---|---|---|---|---|---|---|---|---|---|---|---|---|---|---|---|---|---|---|---|---|
| |||||||||||||||||||||
Osteoporosis and consequent fractures are major public health concerns in the United States. The economic costs of osteoporotic fractures are large and somewhat difficult to assess because the total includes expenses for surgery and hospitalization, rehabilitation, long-term care costs, loss of productivity, and medications. Other burdens associated with fracture include poor resultant functional status, pain, a diminished quality of life, loss of independence, fear, and depression.
Hip fractures result in more than 7 million days of restricted activity and 6,000 admissions to nursing homes annually in the United States; nearly three quarters of all nursing home admissions are related to osteoporosis. For hip fractures, about half of the health care costs reflect nursing home expenses. There is an approximately 20% mortality within 1 year of hip fracture, and 50% of survivors never fully recover. The mortality associated with vertebral fractures is also greater than expected in the general population, whereas the mortality of patients with wrist fractures is similar.
Figure 21.2 shows the lifetime accrual and loss of BMD in men and women. Peak BMD is the maximum possible with normal growth and represents a genetically and environmentally determined apex from which future losses occur. Most skeletal density (both trabecular and cortical) is accumulated by age 18. In cortical bone, a slow phase of loss begins at age 40, ranging from 0.3 to 0.5% per year in men and women. At menopause in women not taking hormone replacement therapy, losses average about 1% per year, but may approach 3% to 5% per year. After this accelerated loss for about 8 to 10 years, the rate decreases in another slow phase. The cumulative lifetime losses of bone may be as much as 30% to 40% of peak BMD in women and 20% to 30% in men.
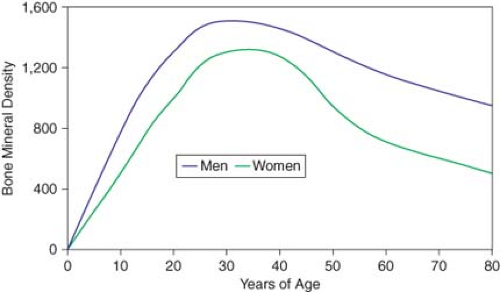 Figure 21.2 Age-related bone mineral density for men and women. From Christenson RH. Biochemical markers of bone metabolism: An overview. Clin Biochem 1997;30:573–593, with permission. (Reprinted in Saag KG, Morgan SL, Cao X, et al. Bone in health and disease. In: Koopman WJ, ed. Arthritis and Allied Condition: A Textbook of Rheumatology. 15th ed. Philadelphia: Lippincott Williams & Wilkins; 2005:2449–2541.) |
Clinical Presentation
The clinical evaluation of osteoporosis should identify lifestyle risk factors and pertinent physical findings, and assess secondary causes of osteopenia. Table 21.3 provides conditions associated with osteopenia or osteoporosis.
Table 21.3 Diseases and Drug Therapies Associated with Osteopenia and Fracture | ||
|---|---|---|
|
A careful evaluation of osteoporosis includes identification of a family history of metabolic bone disease, lifestyle risk factors, history of change in height and weight, history of previous fractures, reproductive history (evidence of hypogonadism), endocrine history, dietary factors (including lifetime and current consumption of calcium, vitamin D, sodium, and caffeine), a smoking history, alcohol intake, exercise, history of renal or hepatic failure, and past and current medications and supplements. In addition, factors that increase the risk of falls, such as neuromuscular disease and unsafe living conditions, should also be sought. A history of bone pain is useful; however, osteoporosis is not painful unless fractures develop. Further, a large proportion of vertebral fractures may occur without overt symptoms.
Family history of metabolic bone disease.
Lifestyle risk factors (exercise, smoking, alcohol use, fall risk, etc.) for osteoporosis.
Loss in height.
History of fractures of all causes.
Lifetime and current consumption of calcium, vitamin D, sodium, and caffeine.
Medication use.
Examination
Height measurement is a vital part of the physical examination at each visit. Comparison of current height with that on a driver’s license is helpful in uncovering height loss. Loss of 2 in. or more is a fairly sensitive indicator of vertebral compression. The spine should be examined for conformation and spinal and paraspinous tenderness. If kyphosis is present, the possibility of pulmonary compromise should be considered. A “buffalo hump,” easy bruisability, and striae suggest Cushing’s syndrome. Blue sclerae may indicate osteogenesis imperfecta. The number of missing teeth has been correlated to the severity of loss in BMD. A joint assessment may suggest rheumatologic causes of low BMD. The neurologic examination is important because muscular weakness predisposes to falls and an underlying neurologic problem may be discovered.
Studies
Laboratory Evaluation
Routine Laboratory Testing
The laboratory assessment seeks possible secondary causes of loss of BMD. Table 21.4 provides tests that may be appropriate. Many are not cost-effective if obtained for every patient. Intact PTH concentration, for example, should be
measured if the calcium concentration is elevated and the phosphorus concentration is low or if clinical suspicion is high for hyperparathyroidism.
measured if the calcium concentration is elevated and the phosphorus concentration is low or if clinical suspicion is high for hyperparathyroidism.
Table 21.4 Laboratory Evaluation of Decreased Bone Mass | ||||||||||||||||||||||||
|---|---|---|---|---|---|---|---|---|---|---|---|---|---|---|---|---|---|---|---|---|---|---|---|---|
|
Table 21.5 Biochemical Markers of Bone Turnover | ||||||||||||||||||||||||
|---|---|---|---|---|---|---|---|---|---|---|---|---|---|---|---|---|---|---|---|---|---|---|---|---|
| ||||||||||||||||||||||||
Specific Bone Turnover Markers
Biochemical markers of bone turnover are sometimes used in the management of osteoporosis. While bone formation and resorption are usually “coupled,” net imbalances can be evaluated with these assays. Table 21.5 provides bone turnover markers that can be classified as indices of bone formation or resorption. “Bone balance” is the net difference between formation and resorption.
Imaging
Dual-energy x-ray absorptiometry (DXA) is currently the “gold standard” for patient care and clinical investigation for osteoporosis. On DXA, bone mass is reported as an absolute value in g/cm2, a comparison to age- and sex-matched reference range (the Z-score), and a comparison to mean bone mass of young adult normal individuals (the T-score or young-adult Z-score; see Fig. 21.3). T-scores are used to predict fracture risk and classify disease status. A change of one standard deviation in the T- or Z-score correlates to a change of approximately 0.06 g/cm2, or about 10% of BMD. Although the Z-score is of less clinical value than the T-score, Z-scores significantly deviating from normal may indicate alternative causes of metabolic bone disease. Dual-energy x-ray absorptiometry scans also produce a density-based image useful in interpreting scan quality (see Fig. 21.3 and below). These readings are compared to the National Health and Nutrition Examination Survey (NHANES) III database.
Dual-energy x-ray absorptiometry measures BMD at central and peripheral sites. The choice of site(s) scanned should depend on the anticipated rates of change in bone mass within these skeletal locations and precision of the testing device at these sites. The central DXA sites of the hip and spine, followed by peripheral sites of the wrist and heel, are the most desired imaging locations. Central DXA of the spine and hip has excellent precision and good accuracy. Central DXA is generally preferred because the quantity of cancellous bone of central sites is highly indicative of the osteoporosis burden and fracture risk. In osteoporosis, the earliest bone loss begins in cancellous bone. A higher proportion of early postmenopausal women have lower cancellous BMD
than cortical BMD. Approximately a third of the spongy trabecular bone of the hip and spine remodels each year as opposed to only 3% turnover of compact cortical bone comprising a greater proportion of peripheral skeleton. At the spine, DXA reports measurements of an individual vertebra as well as average BMD of the L1 to L4 (see Fig. 21.3). At the hip, femoral neck, and the total hip are the three measurement sites of greatest clinical interest. Central measurements are used to diagnose osteoporosis, assess fracture risk, and follow up the response to antiosteoporotic therapies.
than cortical BMD. Approximately a third of the spongy trabecular bone of the hip and spine remodels each year as opposed to only 3% turnover of compact cortical bone comprising a greater proportion of peripheral skeleton. At the spine, DXA reports measurements of an individual vertebra as well as average BMD of the L1 to L4 (see Fig. 21.3). At the hip, femoral neck, and the total hip are the three measurement sites of greatest clinical interest. Central measurements are used to diagnose osteoporosis, assess fracture risk, and follow up the response to antiosteoporotic therapies.
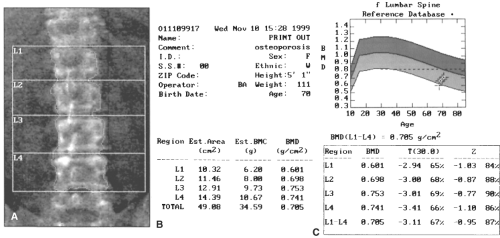 Figure 21.3 Dual-energy x-ray absorptiometry (DXA) printout. For a 70-year-old white woman. A: DXA of this patient’s lumbar spine showing imaging windows for vertebrae L1 to L4. Estimated vertebral areas, bone mineral content (BMC), and bone mineral density (BMD) are shown (middle). Bone mineral density is plotted against a lumbar spine reference database showing the patient’s current value as well as previous readings indicated by crosses (right, top). The dark (top) bar of the graph indicated 2 standard deviations above normal and the lighter (bottom) bar 2 standard deviations below peak bone mass. T-scores (peak bone mass matched) show that the patient is well below the World Health Organization’s definition of osteoporosis (T-score, -2.5) at each vertebral level and for the lumbar spine overall. The Z-score is an age-matched measurement. B: Similar parameters are shown for the left hip, and based on T-scores, there is osteoporosis at both the femoral neck and the total hip. C: At both the hip and lumbar spine, there has been significant 3-year improvement in BMD. The serial plot (left) and table show a nearly 12% increase at the left hip. The asterisk signifies a significant increase of decline between two values. An 18.4% increase in BMD was also seen at the lumbar spine (data not shown). (From Saag KG, Morgan SL, Cao X, et al. Bone in health and disease. In: Koopman WJ, ed. Arthritis and Allied Condition: A Textbook of Rheumatology. 15th ed. Philadelphia: Lippincott Williams & Wilkins; 2005:2449–2541.) |
Peripheral DXA of the forearm is moderately correlated with central DXA results and can, thus, be used as an alternative to predict fracture risk. Heel DXA correlates well with other heel imaging technologies and adequately discriminates osteoporotic from normal young subjects. However, the much slower rate of bone remodeling at sites such as the heel limits this technology for monitoring the response to therapy. The enhanced portability of dedicated peripheral bone mass measurement instruments and their lower cost renders them increasingly attractive for community osteoporosis screening.
Vertebral fracture analysis (VFA) is a point of service examination that can be performed on many DXA scanners. Vertebral fracture analysis concentrates on the morphometry of individual vertebral bodies for the purpose of identifying vertebral compression fractures.
Bone mineral density measured by DXA is a good predictor of the risk of hip and spinal fractures. Spinal fracture is inversely proportional to bone mineral content. For each decline of about 1 standard deviation of bone mass, there is a 1.3- to 2.5-fold increase in fracture risk of any site. Although fracture risk at any site can be accurately assessed using a variety of noninvasive bone mass measurements done at any site, BMD at
the femoral neck is better than BMD at the spine, radius, and calcaneus to predict hip fracture. Decreases of 2 standard deviations in radial and calcaneal bone mass are associated with 4- to 6-fold increases in risk for vertebral fracture. Increasing age and decreasing BMD of the radius predict subsequent nonspinal fractures. It is estimated that a 50-year-old woman has a 19% lifetime risk of fracture if radial bone mass is in the 10th percentile compared with an 11% lifetime risk if the measurement is in the 90th percentile. Absolute fracture risk for the next 10 years can be calculated by incorporating clinical information on fracture risk with BMD and using the FRAX tool available on the Web (http://www.sheffield.ac.uk/FRAX/; see Fig. 21.4).
the femoral neck is better than BMD at the spine, radius, and calcaneus to predict hip fracture. Decreases of 2 standard deviations in radial and calcaneal bone mass are associated with 4- to 6-fold increases in risk for vertebral fracture. Increasing age and decreasing BMD of the radius predict subsequent nonspinal fractures. It is estimated that a 50-year-old woman has a 19% lifetime risk of fracture if radial bone mass is in the 10th percentile compared with an 11% lifetime risk if the measurement is in the 90th percentile. Absolute fracture risk for the next 10 years can be calculated by incorporating clinical information on fracture risk with BMD and using the FRAX tool available on the Web (http://www.sheffield.ac.uk/FRAX/; see Fig. 21.4).
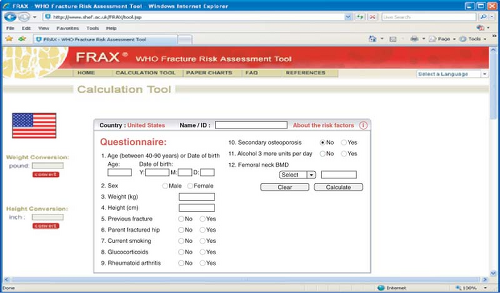 Figure 21.4 The FRAX WHO Fracture Risk Assessment Tool. Calculates the 10-year probability of hip and major osteoporotic* fracture in previously untreated patients. Major osteoporotic fracture is defined as vertebral, hip, forearm, or humerus fracture. (National Osteoporosis Foundation. Clinician’s Guide to Prevention and Treatment of Osteoporosis. Washington, DC: National Osteoporosis Foundation; 2008. FRAX® WHO Fracture Risk Assessment Tool. Available at: www.shef.ac.uk/FRAX/tool.jsp.) |
Prevention and Therapy
Related posts:

Stay updated, free articles. Join our Telegram channel

Full access? Get Clinical Tree


