Chapter 192 Obesity
 Diagnostic Summary
 General Considerations
Obesity is a major contributor to mortality and morbidity, having surpassed smoking as the number one cause of premature death in the United States.1,2 The simplest definition of obesity is an excessive amount of body fat. It must be distinguished from overweight, which refers to an excess of body weight relative to height. A muscular athlete may be overweight yet have a low percentage of body fat. With this in mind, it is obvious that using body weight alone as an index of obesity is not entirely accurate. Nonetheless, a simple measure known as the body-mass index (BMI) is now the accepted standard for classifying individuals with regard to their body composition (Table 192-1). BMI generally correlates well with a person’s total body fat. The BMI is calculated as follows:
TABLE 192-1 Classification of Body-Mass Index
| Underweight | <18.5 |
| Normal | 18.5-24.9 |
| Overweight | 25-29.9 |
| Obesity | 30-39.9 |
| Extreme obesity | >40 |


• The stated weight ranges merely reflect the weights of those with the lowest mortality of insured persons, which may not reflect the U.S. population.
• Weight ranges for lowest mortality do not necessarily reflect optimal healthy weight for height.
• The standard values make it difficult to assess the degree of obesity (e.g., a person within the proper weight range may have excess body fat and lower-than-optimal lean body mass, or an individual with increased muscular development may be “overweight” despite having a low percentage of body fat). Again, it is important to recognize that weight alone is a poor reflector of body-fat composition.
 Prevalence
The prevalence of obesity has reached epidemic proportions and has steadily increased over the years among both genders, all ages, all racial/ethnic groups, and all educational levels. From 1960 to 2008, the prevalence of overweight (BMI between 25 and 30) increased from 31.5% to 34% among U.S. adults ages 20 to 74. The prevalence of obesity (BMI >30) during this same time period more than doubled, from 13.3% to 34%, with most of this rise occurring in the past 20 years. From 1960 to 2008, the prevalence of extreme obesity (BMI > 40) increased from 0.8% to 5.7%. Childhood and adolescent obesity has also increased dramatically. Results from the 2007-2008 NHANES, using measured heights and weights, indicate that an estimated 16.9% of children and adolescents ages 2 to 19 years are obese. Given the health challenges associated with obesity, as shown in Box 192-1, the significance of these increases is staggering.3–5
BOX 192-1 Morbidity Associated with an Increased Risk Due to Obesity
Obese individuals have an average of a 5- to 7-year shorter life expectancy compared with normal-weight individuals (BMI 20 to 25), with a greater relative risk for mortality associated with a greater degree of obesity.1,6 Most of the increased risk for mortality is due to cardiovascular causes, as obesity carries with it a tremendous risk for type II diabetes, elevated cholesterol levels, high blood pressure, and other risk factors for atherosclerosis. In 2009 the estimated annual medical spending due to overweight and obesity was estimated to be $147 billion.7
 Determination of Body Composition
The importance of determining body-fat composition and classifying obesity accurately cannot be overstated, since it offers valuable monitoring, prognostic, and therapeutic information. In terms of body-fat percentage, obesity is defined as greater than 30% body fat for women and 25% body fat for men. Because direct analysis of body composition cannot at this time be performed on live subjects, indirect methods must be employed, such as those listed in Box 192-2.
BOX 192-2 Indirect Methods of Analyzing Body Fat Composition
Visual Observation
• The endomorph has a relatively large body and short arms and legs.
• The mesomorph has a large, muscular chest that dominates the abdomen and has prominent bony joints.
• The ectomorph has a relatively small frame (a slender, delicate bone structure) and long arms and legs.
Skinfold Thickness
However, for most clinical purposes, skinfold measurements provide the easiest and least expensive method for estimating body fat percentage. For more precise estimations, other methods (e.g., bioelectrical impedance, ultrasound, total body electrical conductivity, and hydrostatic weighing) offer significant advantages.
Bioelectric Impedance
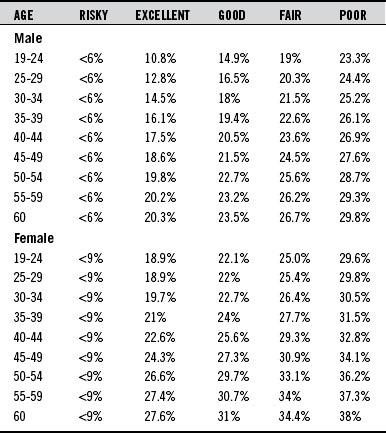
Because fat-free mass has a much greater conductivity than does fat, there is a strong relationship between conductance and lean body mass. Body composition analysis, as determined by bioelectrical impedance, is a safe, noninvasive procedure that provides rapid measurements. Home scales equipped with bioelectrical impedance units to assess body fat percentage as well as weight are now available. These scales typically cost between $50 and $200 (Table 192-2).
 Types of Obesity
Hypertrophic obesity is characterized by an increase in the size of each fat cell and is linked to diabetes, heart disease, high blood pressure, and other serious disturbances of metabolism.5 With hypertrophic obesity, the fat distribution is usually around the waist. This type of distribution is referred to as male-patterned or “android” because it is typically seen in the obese male. If the waist is larger than the hips, a person is said to have android obesity. If the hips are larger, then a person has female-patterned or “gynecoid” obesity.
 Causes of Obesity
Although there may or may not be a specific “obesity gene,” the tendency to be overweight is definitely inherited. Nonetheless, even high-risk individuals can avoid obesity, indicating that dietary and lifestyle factors (primarily little or no physical activity) are chiefly responsible for obesity. In looking at possible causes beyond diet and lifestyle, researchers have focused on both psychological and physiologic factors.
Psychological Factors
Watching television has been demonstrated to be linked to the onset of obesity, and there is a dose-related effect. Increased television viewing and decreased physical activity are thought to be primary causes of the growing prevalence of obesity among children in the United States. Television viewing in childhood and adolescence is associated not only with being overweight but also with poor fitness and the presence of obesity, smoking, and elevated cholesterol levels in adulthood, indicating that excessive television viewing has long-lasting adverse effects on health.8
In addition to leading to childhood obesity, television viewing also contributes to overweight in adults. In one study, 50,277 women with BMIs below 30 completed questions on physical activity and sedentary behaviors at baseline. During 6 years of follow-up, 3757 (7.5%) of these women became obese (their BMIs were at or above 30), and 1515 new cases of type II diabetes occurred. Time spent watching television was positively associated with the risk of obesity and type II diabetes. Each 2-hour-per-day increment in television watching was associated with a 23% increase in obesity and a 14% increase in risk of diabetes. In contrast, each 2-hour-per-day increment in sitting at work was associated with a 5% increase in obesity and a 7% increase in diabetes.9
Physiologic Factors
Although the psychological theories primarily propose that obese individuals have a decreased sensitivity to internal cues of hunger and satisfaction, an emerging theory of obesity states almost the opposite—that obese individuals appear to be extremely sensitive to specific internal cues.4 Unfortunately, these cues relate to dysfunctional appetite control due to a combination of genetic, dietary, and lifestyle factors. At the center of this dysfunction in many cases is resistance to the hormone insulin as a result of a conditioned reaction to a high glycemic diet. The development, progression, and maintenance of obesity is a vicious positive feedback cycle consisting of insulin resistance, central adiposity, alterations in adipokine secretion by adipocytes and gut-derived hormones, impaired diet-induced thermogenesis, and low brain serotonin levels. All of these factors are interrelated and support the theory that obesity is primarily an adaptive physiologic response that is out of control. Failure to address these underlying areas and provide proper psychological support results in only temporary weight loss at best.
The “Set Point”
When fat cells, particularly those around the abdomen, become full of fat, they secrete a number of biological products (e.g., resistin, leptin, tumor necrosis factor, free fatty acids) that dampen the effect of insulin, impair glucose utilization in skeletal muscle, and promote glucose production by the liver. Also important is that as the number and size of fat cells increase, they lead to a reduction in the secretion of compounds that promote insulin action, including a novel protein produced by fat cells known as adiponectin. Adiponectin is not only associated with improved insulin sensitivity but also has antiinflammatory activity, lowers triglycerides, and blocks the development of atherosclerosis. The net effect of all of these actions by fat cells is that they severely stress the mechanisms governing blood sugar control and also lead to the development of the major complication of diabetes—atherosclerosis. Because of all of these newly discovered hormones secreted by fat cells, many experts now consider the adipose tissue a member of the endocrine system.10,11
Adipokines and Gut-Derived Hormonal Alterations
To combat the tendency to eat more than is required, it is important to accentuate the normal physiologic processes that curb the appetite. An elaborate system exists that is supposed to tell the hypothalamus when the body requires more food as well as when enough food has been consumed. In addition, adipokines like leptin, a strong signal of appetite control, actually originate from the gastrointestinal tract. In addition to nerve signals feeding back to the central nervous system is a growing list of gut-derived hormones and peptides, such as neuropeptide Y and the analogs ghrelin and cholecystokinin.12 For example, peptide YY 3-36 (or PYY for short) dramatically reduced appetite in both obese and normal-weight individuals.13 The subjects consumed about 30% less at an “all-you-can-eat” buffet after receiving an infusion of this hormone than they did when they were given only saline solution. The subjects also ate significantly less over the next 24 hours.
Unlike PYY, the stomach-derived hormone ghrelin increases appetite. Ghrelin levels are highest when the stomach is empty and during calorie restriction. Obese individuals tend to have elevated ghrelin levels to begin with, and when they try to lose weight, their ghrelin levels increase. Part of the success of gastroplasty in producing permanent weight loss is thought to be due to significantly reduced ghrelin levels. For example, a diet-induced weight loss of 17% of initial body weight was associated with a 24% increase in the area under the curve (AUC) for the 24-hour ghrelin profile. However, despite a 36% weight loss after gastric bypass, the AUC for the ghrelin profile in the gastric-bypass group was 77% lower than in normal-weight controls and 72% lower than in matched obese controls.14
Gut-Derived Appetite Regulators
The main hormones inhibiting food intake are cholecystokinin (CCK), glucagon-like peptide-1 (GLP-1), oxyntomodulin, and PYY, while hormonal stimulators of appetite include ghrelin and orexin A.12 It could be strongly argued that secretion of these regulators, as well as overall enteroendocrine cell function, is regulated by the presence or absence of highly viscous dietary fiber, especially since the main targets for these neurotransmitters are vagal afferent neurons and the appetite-inhibiting effects of CCK are enhanced by the mechanical effects of dietary fiber (gastric distention). Brief descriptions of these gut-derived appetite regulators follow.
Cholecystokinin
The role of CCK as a regulator of protein and fat digestion in the upper small intestine has been recognized for several decades. CCK determines the capacity for digestion by controlling gastric emptying as well as the delivery of enzymes from the pancreas. The inhibition of appetite by CCK has been demonstrated in human studies.12,15 The reduction of food intake by low-dose exogenous CCK is enhanced with moderate gastric distention, implying synergistic interactions between CCK and the stimulation of gastric mechanoreceptors. Not surprisingly, viscous dietary fiber has been shown to increase the secretion of CCK.16,17
Glucagon-like Peptide-1
The distal intestinal glucagon-like peptide-1 (GLP-1) is derived from different regions of the glucagon precursor. Infusion of GLP-1 inhibits food intake, decreases sensations of hunger, and inhibits plasma ghrelin (discussed further below). The secretion of GLP-1 is clearly influenced by food intake, but the specific food components, as well as the role of dietary fiber, have not yet been determined.18

Stay updated, free articles. Join our Telegram channel

Full access? Get Clinical Tree


