Chapter 37 Nutrition and Family Medicine
Overview
The goal of improving the health of the U.S. population through approaches such as physical activity and nutrition has come to the forefront of medical concerns. The efforts of public service and health care professionals in promoting nutrition’s potential to improve health is beginning to result in constructive action. The public health approach to improving diet through education is part of the focus on preventing chronic diseases in an aging population. The clinical medicine approach to nutrition is using nutritional therapies as part of disease management. This chapter discusses both approaches.
Current Dietary Guidance
The latest version of the public health dietary guidance program was introduced in 2010. This is in connection with the MyPyramid food guidance system (www.MyPyramid.gov). The MyPyramid recommendations are based on the following:
The new food pyramid has an interactive interface, allowing for customization of the food plan as well as key concepts into a visual image (see Web Resources). Although there is general agreement, many argue that the recommendations are vague and that food amounts and groupings are inappropriate. The major addition in this version of the food guidance system has been physical activity, which seems to be critical in the considerations of diet and the balancing of energy needs with intake. The overarching concepts of the 2010 Dietary Guidelines (www.dietaryguidelines.gov) explain the educational framework for the MyPyramid, as follows:
There are more than 23 key recommendations in the latest Dietary Guidelines for the general population and six additional key recommendations for specific populations. The Key Recommendations of the latest version of the Dietary Guidelines are as follows:


There are additional recommendations for women capable of becoming pregnant, women who are pregnant or breastfeeding, and individuals ages 50 years and older.
The specifics are many, and the latest dietary guidelines might be as confusing as previous guidelines. They are a combination of food- and nutrient-based recommendations, the latter of which is often difficult to explain. Both the professional community and general public recognize the important role of proper nutrition in maintaining health, but neither always heeds current evidence. This chapter highlights the current evidence for supporting nutritional approaches to common medical and health concerns. The recent changes in recommendations recognize that the whole diet seems to be more of a concern than specific nutrients.
Nutrition Assessment
A nutrition assessment is the process of determining an individual’s nutritional status or whether adequate amounts of required nutrients are available to and absorbed by the body. Every patient in a family medicine practice deserves some level of nutrition assessment. This assessment can be a brief screen, when the patient is relatively healthy, or more in-depth, if the patient appears to have nutritional inadequacy or risk factors for malnutrition. The depth of the assessment is based on the patient and the presenting situation. Those who may require a more in-depth evaluation include patients who are grossly overweight or underweight, patients with a chronic or severe acute illness, growing infants and children, patients in poverty or otherwise unable to obtain a variety of foods, most frail older adults, and patients who maintain nontraditional diets, such as recent immigrants or fad dieters.
History
As with any other health assessment, the patient history is the first step in determining nutritional status. In a reasonably healthy adult or child, this history may be a brief screen, including determining changes in weight and appetite, eating habits such as the number of meals daily and the variety of foods consumed, and symptoms of underlying chronic or debilitating illness. Information about the ability to perform activities of daily living (ADLs), including shopping and cooking, is important when interviewing older adults or the infirm population.
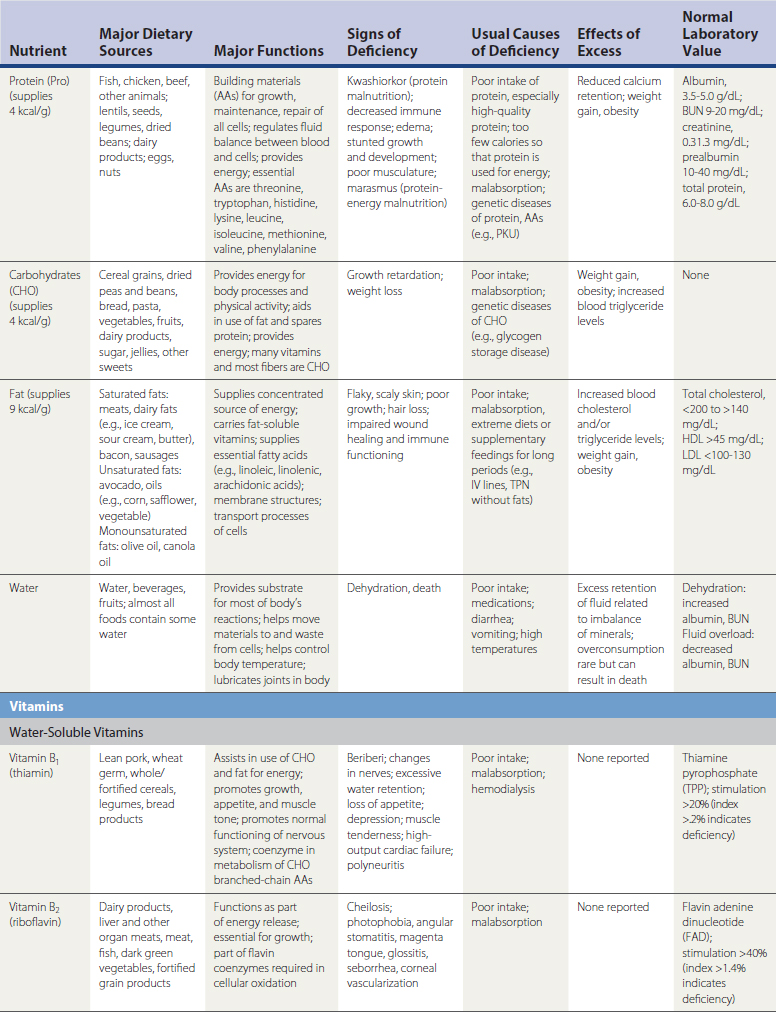
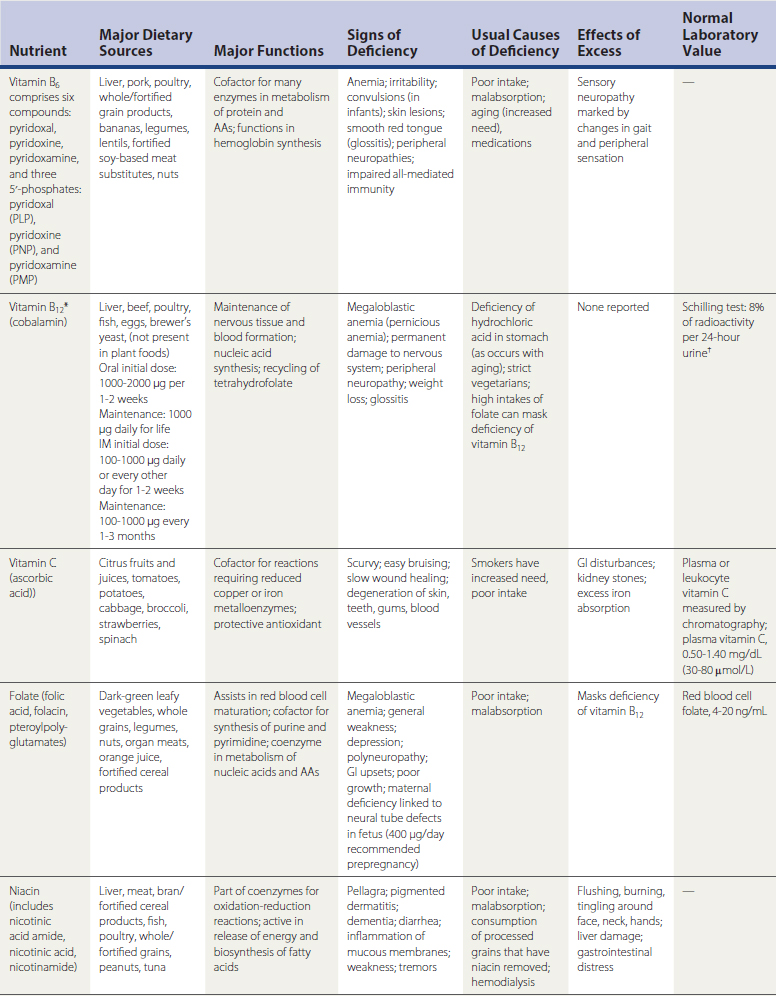
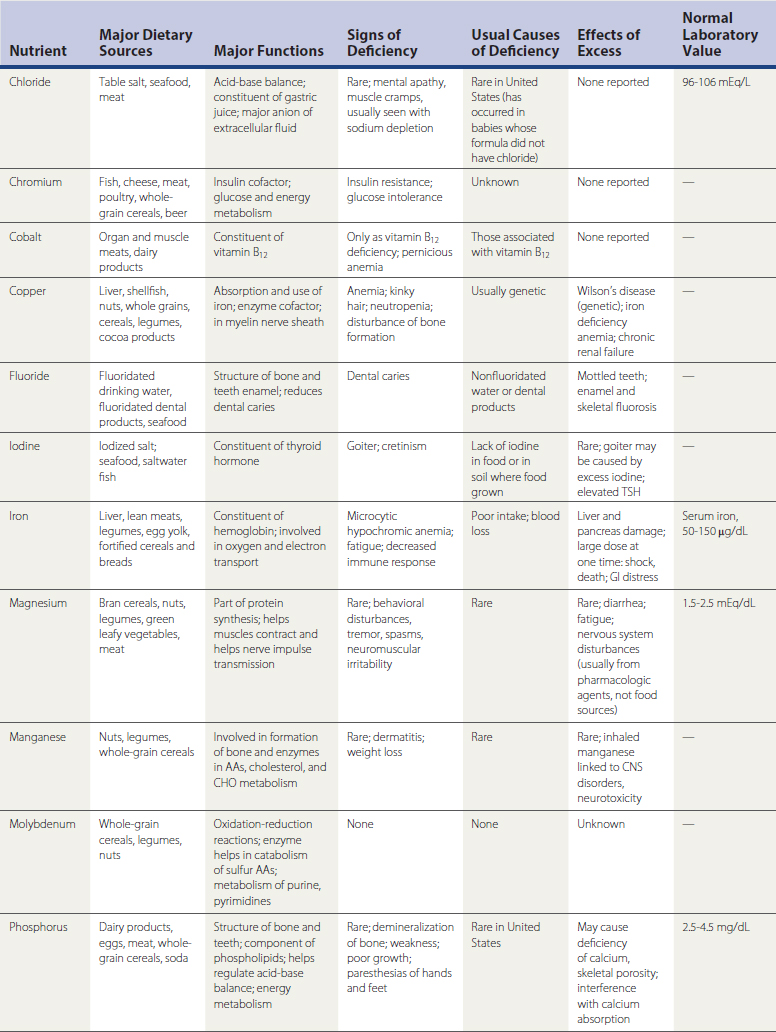
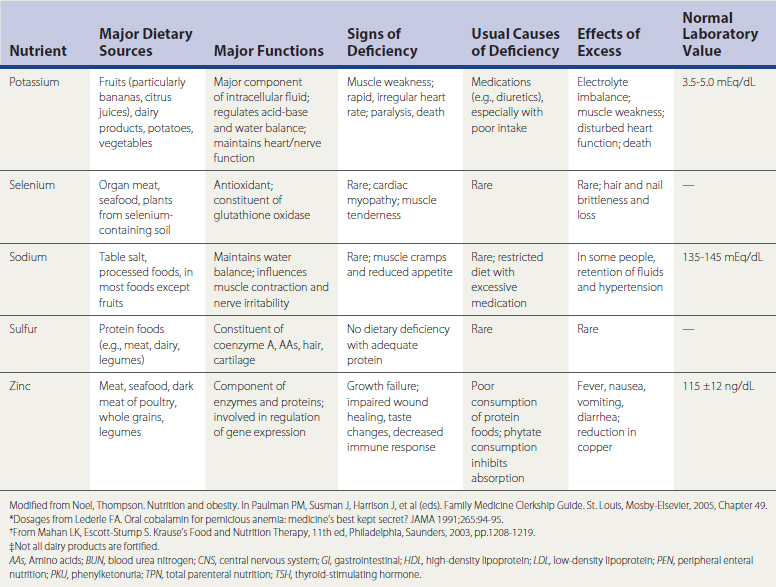
Patients with chronic illness deserve a more thorough history assessment, as do patients with symptoms or signs potentially related to poor nutrition (Table 37-1). Physicians should review gastrointestinal (GI) symptoms and elicit information about supplemental vitamins or other nutritional products, alcohol and illicit drugs, appetite suppressants or stimulants, glucocorticoids, and laxatives. In at-risk patients or those with clinical evidence of poor nutrition, clinicians should consider the presence of conditions that may increase nutritional requirements. Physicians should also investigate the patient’s ability to obtain, ingest, digest, metabolize, and absorb nutrients; consider whether a treatment or medication will require modification of the diet; and use information obtained in the history to plan for that change.
Conditions that May Increase Nutritional Requirements
Any condition that increases the metabolic rate of the patient is likely to increase nutritional requirements (Box 37-1).
Ability to Obtain Food
Patients in poverty and who cannot or do not receive financial assistance are at risk for poor nutrition because of an inability to obtain enough food or a variety of foods. Those who lack transportation or have other shopping access issues, such as language barriers or distance from a store, may also not be able to acquire sufficient food. Patients who rely on others to provide or prepare foods, or both, may have inadequate dietary intake. Many patients, because of poor mobility and declining health, gradually lose the ability to perform ADLs, such as shopping, cooking, and cleaning, so the history should contain specific questions directed at these activities. Individuals with substance abuse problems or poor mental health may lack the initiative or ability to acquire healthy foods.
Ability to Ingest Nutrients
Various conditions may contribute to a patient’s inability or lack of desire to eat (see Box 37-1).
Digestion
A number of processes can affect the normal digestive process. Any factor that interferes with the secretion of acid or enzymes into the stomach or small intestine may impair digestion. For example, patients with partial gastrectomy or even vagotomy for peptic ulcer disease may have maldigestion and nutritional deficiencies. Similarly, patients with chronic pancreatitis may lack certain digestive enzymes and thus cannot absorb all nutrients.
Absorption
Patients may demonstrate poor absorption of nutrients for a variety of reasons, including loss of absorptive surface area in the intestinal tract from surgery, Crohn’s disease, infectious processes, or other inflammatory conditions, such as celiac disease (National Digestive Diseases Information Clearinghouse [NDDIC], 2005) (Table 37-2). Incomplete digestion and processing of fats, carbohydrates, proteins, and vitamins can also lead to decreased absorption of those nutrients. Table 37-3 lists various nutrients and their sites of metabolism and absorption.
Table 37-2 Celiac Disease: Grains with and without Gluten
Grains or Flours Allowed | Grains or Flours with Gluten: Not Allowed | |
---|---|---|
Table 37-3 Nutrients and Sites of Metabolism/Absorption
Nutrient | Site of Absorption |
---|---|
Macronutrients | |
Amino acids | Throughout small intestine (more rapid proximally) |
Sugars | Throughout small intestine |
Fats | |
Fatty acids | Throughout small intestine (mostly proximal) |
Bile acids | Ileum |
Short-chain fatty acids | Colon |
Minerals | |
Calcium | Duodenum, jejunum |
Iron | Duodenum |
Magnesium | Small intestine |
Vitamins | |
Folic acid | Proximal small intestine |
Vitamin B12 | Ileum |
Fat-soluble (A, D, E, K) | Small intestine |
Metabolism and Excretion
Many chronic diseases result in poor metabolism of foods, which leads to poor availability of calories and other nutrients. Additionally, any condition that results in excessive losses of nutrients through the intestinal tract or kidneys may also result in malnutrition. Certain foods, such as nonabsorbable fat substitutes, cause excessive loss of fat-soluble vitamins, with steatorrhea caused by the fat not being absorbed (Table 37-4).
Table 37-4 Conditions Affecting Metabolism and Excretion
Type of Impairment | Possible Contributing Condition |
---|---|
Impaired dietary intake | |
Maldigestion | |
Malabsorption | |
Impaired metabolism | |
Increased excretion of nutrients | |
Increased requirements |
AIDS, Acquired immunodeficiency syndrome.
Modified from Newton JM, Halsted CH. Clinical and functional assessment of adults. In Shils ME, Olson JA, Shike M, Ross AC (eds). Modern Nutrition in Health and Disease, 9th ed. Lippincott–Williams & Wilkins, 1999, Chapter 55.
Dietary History
It is important to obtain information about the patient’s usual and recent diet as part of the history. The dietary history refers to a patient’s usual pattern of food intake and any factors that may influence food choices and availability. Screening questions include number of daily meals and examples of food consumed. A more thorough evaluation delves into cultural or religious food practices, personal preferences, and use of the food pyramid as a tool to help patients identify food groups from which they may be consuming too few or too many servings.
A specific part of the dietary history is a nutrient intake analysis. This history relies on a food diary kept by the patient for a specific period, usually 3 to 7 days, including times, food and beverages consumed, and activity. Clinicians also use dietary recall as a method to assess nutrient intake. With this tool, patients report foods and beverages consumed over the past 24 to 48 hours. This retrospective analysis has less validity than the prospective food diary because people typically are unable to remember the details of their past eating habits accurately (Hammond, 2004).
Physical Examination
A systematic physical examination is important in evaluating nutritional status. General inspection may immediately reveal obvious overweight or underweight. Anthropometry, or physical measurements of an individual that are compared with reference standards, plays a role as well. These parameters include height, weight, skin fold thickness, head circumference (especially in infants and children), and waist and hip circumferences. These measurements are most helpful when taken at several intervals over time.
Height and Weight
It is useful to measure height and weight to assess nutrition. Patients tend to overestimate their height and underestimate their weight. In considering weight alone in adults, the usual body weight is a more useful parameter than ideal body weight obtained from published tables. In children, body weight is more useful than height in estimating body fat and also provides information about recent nutrient intake (Hammond, 2004). Changes in weight over time from the usual body weight may reflect a change in nutritional status. However, it is important to remember that acutely, weight loss or gain may signify a change in fluid status rather than in nutritional well-being. In an obese individual or older adult, loss of lean body mass indicating malnutrition may be masked by the presence of excess body fat.
Significant weight loss is defined as a 5% loss in 1 month, a 7.5% loss in 3 months, or a 10% loss in 6 months. A severe weight loss is defined as any loss higher than those percentages in the same interval. The following method is also used to assess nutritional status as a function of weight loss (Hammond, 2004):
Both height and weight are needed to calculate the body mass index (BMI), which is highly correlated with independent measures of body fat in adults (Balcombe et al., 2001; Keys et al., 1972). The formula for calculating BMI is weight (kg)/[height (m)]2. Table 37-5 lists parameters for overweight, obesity, and underweight according to the BMI (see Web Resources for BMI calculator).
Table 37-5 Weight Categories according to Body Mass Index (BMI)
Category | BMI (kg/m2) |
---|---|
Underweight | <18.5 |
Normal | 18.5-24.9 |
Overweight | 25-29.9 |
Obese | ≥30 |
From National Heart, Lung, and Blood Institute (NHLBI). Clinical guidelines on the identification, evaluation, and treatment of overweight and obesity in adults, BMI calculator. http://www.nhlbisupport.com/bmi/bmicalc.htm.
Body Composition
Assessment of body composition reveals the relative amount of body fat and lean body mass. One common method for assessing subcutaneous fat is the measurement of skin fold thickness. Several areas of the body have demonstrated good correlation with body fat, including the triceps, biceps, subscapular tissue, and tissue above the iliac crest. Measurements are taken with calipers and compared with standardized tables to determine the percentage of body fat. This type of assessment can be limited by the accuracy of the measuring technique. Changes in skin fold thickness take place over 3 to 4 weeks, so this measurement is not a useful gauge for determining acute changes in nutritional status.
Circumference measurements are useful in assessing nutritional status. The waist circumference correlates with abdominal fat content. Increased waist circumference has been associated with cardiovascular disease risk factors (Dalton et al., 2003). The correct method for waist circumference is to measure the distance around the smallest area below the rib cage and above the umbilicus. Waist measurements of more than 40 inches in men and 35 inches in women are independent risk factors for disease (NHLBI, 2005). The waist circumference has less predictive value in patients shorter than 5 feet tall and in those with BMI greater than 35.
General Physical Examination
Certain findings on physical examination may alert the physician to the potential for malnutrition. These include temporal wasting, decreased muscle mass in general, proximal muscle weakness, and certain skin changes, such as scaling, poor wound healing, and bruising. Tissues in the body that undergo rapid cell turnover, such as mucous membranes, skin, and hair, may be the first to show signs of nutritional insufficiency (see Table 37-1).
Laboratory Evaluation
Physiologic changes related to adequacy of nutrition occur slowly; the first signs of a change in nutritional status usually appear at the cellular level. These changes may be detected by a variety of laboratory tests. Single laboratory tests may have value in screening for nutritional problems, whereas a series of values is important for assessing ongoing nutritional problems and treatment.
Assessment of Protein Status
One traditional method of determining nutritional status is to measure the nitrogen balance, calculated by comparing protein gain with protein loss. In healthy adults the nitrogen balance is zero; that is, the amount of nitrogen consumed should equal the amount of nitrogen excreted. Calculation of the nitrogen balance gives an indication of short-term changes in protein status. Approximately 16% of protein mass in the body is made up of nitrogen. In calculating nitrogen balance, the clinician can determine protein intake in the diet and then measure nitrogen output in urine and feces. The nitrogen balance is negative when protein-calorie intake is insufficient; it is positive in growing children and pregnant women. The following formula is used for calculating nitrogen balance:
where the 2 g/24 hr accounts for nitrogen losses from GI epithelium, skin, hair loss, and sweat. The total urine nitrogen can be determined by dividing the 24-hour urinary urea nitrogen by 0.85. In patients with extensive diarrhea or other losses of nitrogen (e.g., through pancreatic fistula), other methods must be used to calculate nitrogen losses, such as by the use of pyrochemiluminescence.
There are limitations in calculating nitrogen balance. It is difficult to assess the amount of protein intake in a person eating by mouth because of the need to measure portions and amounts consumed accurately. Determination of the nitrogen balance is more accurate for patients receiving defined formulas of enteral or parenteral nutrition.
Measuring Visceral Protein: Albumin
The protein contained in visceral organs constitutes about 10% of total body protein, whereas the protein in plasma and extravascular body fluids makes up about 3% of total protein. Albumin is a plasma protein produced by the liver that can be used as an indicator of visceral protein balance. The measurement of serum albumin reflects changes in the protein status over a longer time than the nitrogen balance, in part because albumin has a serum half-life of 2 to 3 weeks.
Using serum albumin as a marker for protein nutrition status also has limitations. Albumin is a negative acute-phase reactant and tends to decrease in concentration under conditions of inflammation. Because of its long half-life, this change may be misleading. In protein-calorie starvation, albumin levels tend to decrease, but in total-calorie deprivation, albumin levels may remain more stable (Hammond, 2004). Finally, there is a large extravascular albumin pool, which tends to equilibrate by entering the vascular system when plasma concentration of albumin decreases.
Transferrin
Transferrin is another plasma protein that reflects overall protein balance. Like albumin, transferrin is a negative acute-phase reactant, but because of its shorter half-life (8 days), it may be somewhat more accurate than albumin as a tool for assessing nutritional status. Transferrin has limitations, however, in that its concentration is related to the patient’s overall iron status. Also, as with albumin, serum concentration of transferrin does not change rapidly with changes in protein-calorie intake.
Other Plasma Proteins
Several other plasma proteins have been proposed as good markers for protein energy status. The level of transthyretin (TTY), also known as prealbumin, has been shown to correlate with visceral protein status, but it is an acute-phase reactant and is also affected by zinc concentrations. Retinol-binding protein (RBP) has a short serum half-life (12 hours) and correlates with protein energy status in some patients with malnutrition, but it also is a negative acute-phase reactant and has limitations for the assessment of nutritional status.
It is possible to circumvent the problems raised by inflammation in interpreting the plasma levels of the proteins mentioned. C-reactive protein (CRP) level provides an indication of the amount of inflammation present at a given time. Some clinicians may ascribe more usefulness to levels of albumin, transferrin, transthyretin, and RBP when the CRP level is low.
Urinary Creatinine and Creatinine/Height Ratio
The urinary creatinine level reflects the amount of ongoing muscle metabolism. The amount of creatinine excreted in the urine is proportional to the muscle mass of an individual. Using a mathematical formula, it is possible to derive an expected amount of creatinine excretion over 24 hours based on a person’s height. This formula is limited in the case of a tall, thin, or short muscular subject. The amount of urinary creatinine also varies depending on the diet; diets high in meat will result in increased urinary creatinine excretion.
Vitamin and Mineral Assays
In general, protein-calorie malnutrition is associated with low levels of vitamin A, zinc, and magnesium. Fat-soluble vitamins may be deficient in conditions of malabsorption of fat. Folic acid and iron are not well absorbed in celiac disease.
Hematologic Tests
Changes in red blood cell production may result from insufficient levels of iron, vitamin B1, folic acid, and other vitamins. It is important to note that determining the complete blood count (CBC) is important in assessing nutritional status. Patients with poor nutritional status may also demonstrate weak immune status. T-cell–mediated responses are more severely affected by nutritional inadequacy than B-cell functions, such as immunoglobulin function. Evaluating the total lymphocyte count can be helpful in assessing T cells. Using skin testing for energy is one method of testing T-cell immune competence.
Nutrition in the Life Cycle
Pregnancy and Lactation
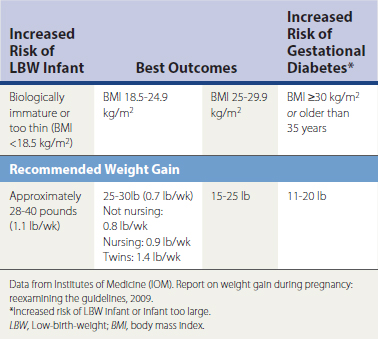
Pregnancy has long been recognized as a time of increased nutritional needs. Recommendations vary but one constant remains: with adequate caloric intake comes a greater likelihood of ingesting adequate nutrients. Weight checks are a standard part of all prenatal visits. In recent years, concern has focused on the woman’s health status after the pregnancy. As Table 37-6 demonstrates, in older pregnant women or biologically immature women (those who become pregnant within 5 years of starting to menstruate), the caloric intake and weight gain are specific to the particular health needs of the woman during as well as after the pregnancy. The usual weight retained with each pregnancy by women in the United States is 10 pounds (McGanity et al., 1999). This retained weight may have a significant influence on future chronic disease development for women.
It is now known that the nutritional needs for pregnancy begin before conception. The state of nutrition 60 to 90 days before conception influences pregnancy outcomes. The major nutrient changes from conception through the first trimester are increases in folic acid, iron, and calories. The overall nutritional needs throughout the pregnancy are as follows:
Community-based programs such as Women, Infants, and Children (WIC) can be a resource for helping women in need. It has been demonstrated that infants of women who participate in these programs have higher birth weights than those who were not in the programs and who are in the same social, economic, or other problematic circumstances.
Many of the nutritional issues in lactation are influenced by the nutritional status of the pregnant woman. The nutritional stores of the newly delivered woman are an important source of supplies for her and the infant. Certain nutrients are stable regardless of the maternal diet (Table 37-7). Studies of lactation have found that after about 6 months of breastfeeding, maternal weight decreases by about 10 pounds without any changes in the composition or production of breast milk (Barbosa et al., 1997). This may be important when considering that the average weight retained with each pregnancy is about 10 pounds.
Table 37-7 Intake of Nutrients in Maternal Diet and Effect on Amount of Breast Milk
Intake Causes No Increase in Amount of Breast Milk | Intake Causes Some Increase | Intake Causes Significant Increase |
---|---|---|
∗ Although supplementation is needed because of increased needs of infant (IOM. Nutrition during Lactation, 1991.)
Infancy and Childhood
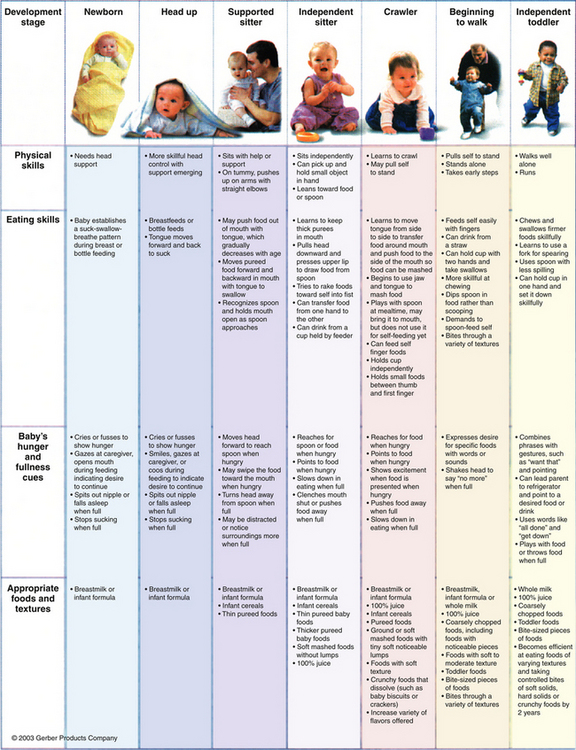
An excellent summary of the nutrients and development needs for food in this age group has been recently published (Fig. 37-1). This figure provides guidance about major nutrient needs and how the infant and child can meet these needs. These evidence-based guidelines were developed by a panel of pediatricians, nutritionists, and the U.S Department of Agriculture (USDA) after comprehensive review of the literature.

Figure 37-1 Summary of physical and eating skills, hunger and fullness cues, and appropriate food textures for infants and children.
(From Butte N, Cobb K, Dwyer J, et al. The Start Healthy feeding guidelines for infants and toddlers. J Am Diet Assoc 2004;104:455-467.)
It is important to help parents understand that the introduction of new foods takes time. Researchers found that it takes at least eight different attempts of introducing a new food before a child will show true acceptance or rejection (Birch et al., 1991; Satter, 2000). Parents must understand that their role is to provide a healthy range and variety of foods in a pleasant eating environment, whereas the child’s role is to consume the food in the amounts that he or she needs and wants. This foundation of good food habits will carry through to the adolescent stage, in which independence and finding ways of expressing this independence are achieved not only in social functioning but also in food and health habits.
Adolescence
Adolescents gain independence by taking a greater role in food choices and amounts eaten. It is frustrating for parents who worked to establish standards to see the young person seek independence, even with foods consumed. This is a stage in life that demands high caloric intake, because growth needs are second only to those in infancy—more kilocalories per kilogram are needed than in any other life stage. This high caloric consumption is favorable to nutritional status because with high calories comes the increased likelihood of taking in more nutrients. Parents must remain hopeful that good health habits will guide the teenager. There may be concern over peer pressure leading to “strange” or different food habits, such as disordered eating, sports nutrition, and vegetarian diets, which many teens attempt. Such exploration is often a natural part of expressing independence. These food patterns can be healthy, such as improving food habits with vegetarianism or sports nutrition. The family physician needs to determine when the teen’s exploration could become harmful. Nutrition assessment is appropriate in this life stage in regard to determining whether a nutritional problem is present.
Adulthood
The study of adult nutrition tends to focus on prevention and treatment of chronic diseases. There is new interest in optimizing nutrition during this stage to enhance the older adult’s quality of life. The public has demonstrated a strong interest in this process with the use of nutrition and nutritional products as an alternative medicine source. Some of these developments, such as antioxidant vitamins, plant-based estrogens, and other functional foods, have not had the desired outcomes (i.e., longer life, enhanced functional status). The Dietary Reference Intakes (National Academy of Sciences, 2005) has addressed this concept of enhanced nutrient intakes through supplements and other products by introducing a new category called tolerable upper intake levels (see Terminology). Many values in this category of nutrient levels are still being researched.
The research on caloric restriction as a means for decreasing the problems of aging is still at an animal model level. Studies concerning the risks of obesity and the positive effects of physical activity have the most promise to helping to understand the effects of overnutrition and caloric restriction on human longevity.
Osteoporosis
With the possibility of a 20% bone mass loss in the 5 to 7 years following menopause, the best treatment for osteoporosis (reduction in amount of bone mass) is the prevention of bone loss. The following three steps are recognized as most helpful for women (80% of osteoporosis population):

Stay updated, free articles. Join our Telegram channel

Full access? Get Clinical Tree