Reconstruction group
Residual volume (mL)
Injury group
Residual volume (mL)
Normal
3.31 ± 0.18
Normal
3.28 ± 0.20
T1
5.09 ± 0.19
t1
5.06 ± 0.16
T2
7.54 ± 0.18
t2
7.78 ± 0.12
T3
9.85 ± 0.29
t3
12.03 ± 0.18
T4
6.35 ± 0.23
t4
15.11 ± 0.30
T5
4.11 ± 0.16
t5
18.22 ± 0.37
T6
2.31 ± 0.22
t6
20.15 ± 0.53
5.3.2 Histological Observation of the Detrusor Muscle
In the normal groups, the smooth muscle cells (SMCs) were in a long “shuttle” shape and funicular in arrangement. The nucleus was arranged in an orderly manner and parallel to muscle cells. Infiltration into connective tissue among the muscle bundles was not observed.
In t1–t6 and T1–T3, muscle cells were arranged in an irregular manner and the nucleus was deformed. The detrusor muscle was smaller, and increased infiltration into connective tissue was observed with time.
In T4–T6, deformed muscle cells were seen, but the area of detrusor muscle increased and increased infiltration into connective tissue was not observed (Fig. 5.1).
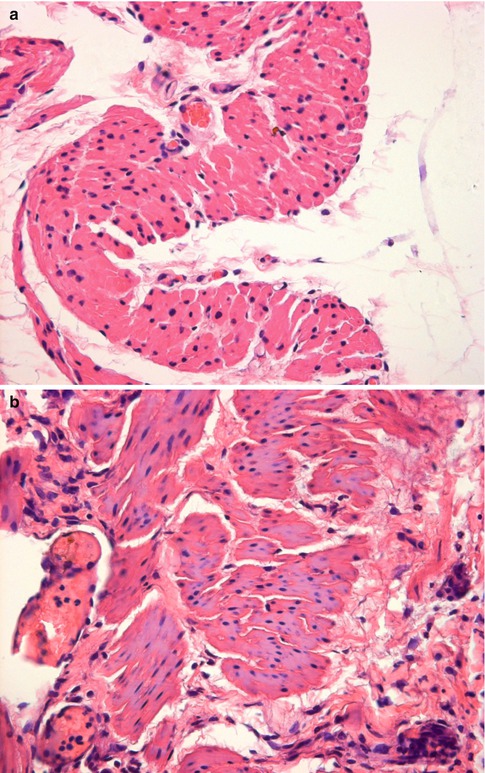
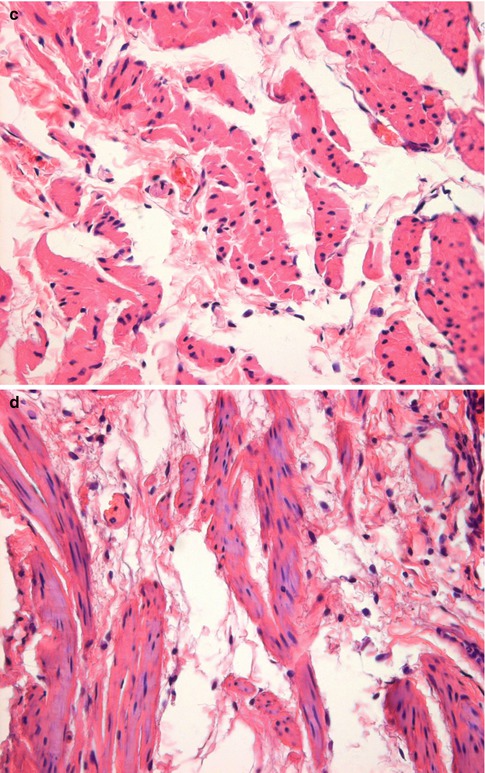
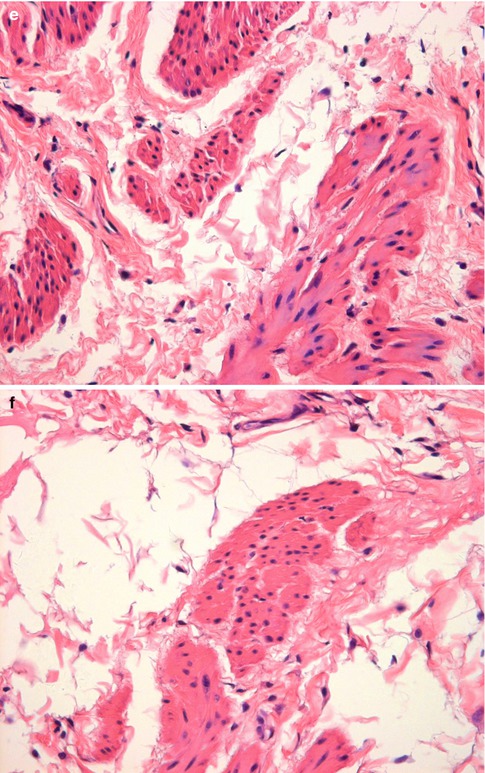
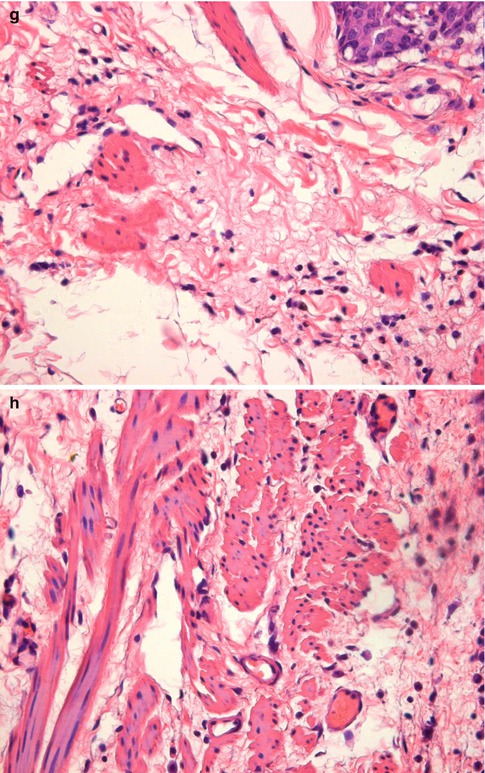
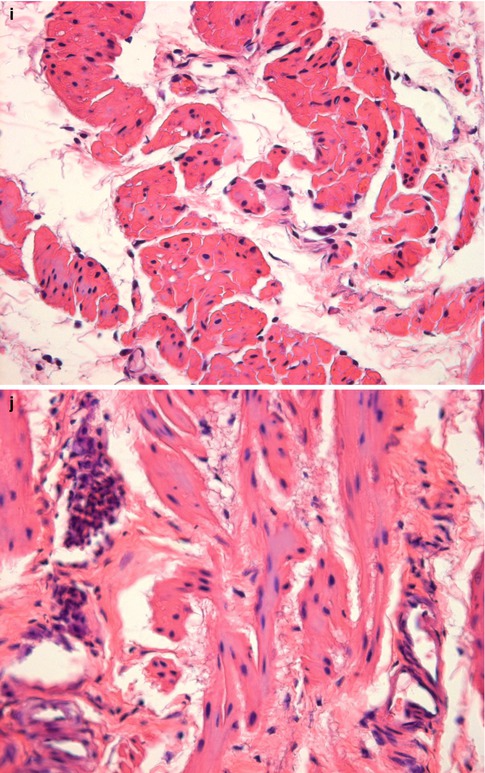
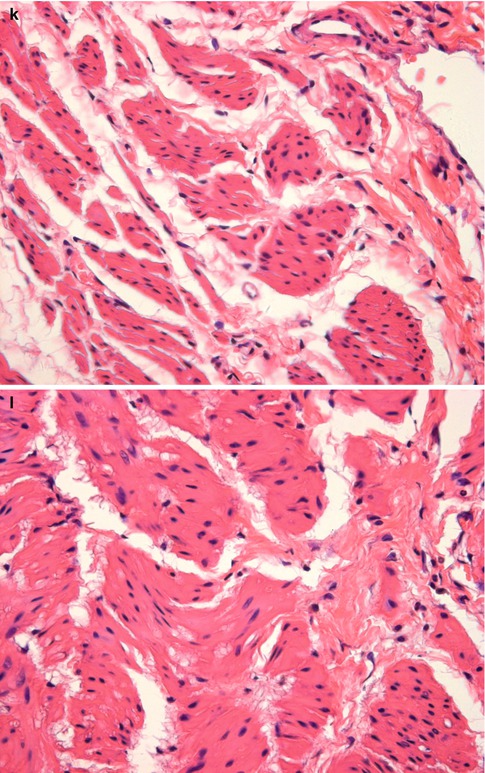
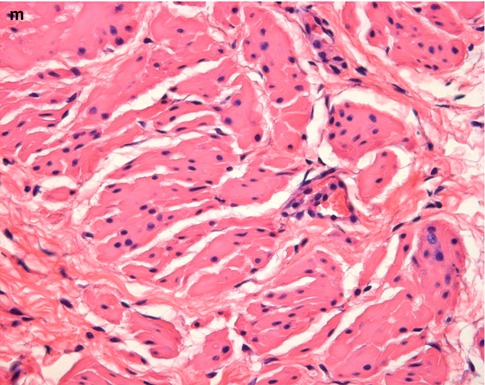


Fig. 5.1
Transverse sections of the detrusor muscle in Sprague–Dawley rats of normal (a) medullary-cone injury (b–g) and reconstruction (h–m) groups stained by hematoxylin and eosin for analyses of the cross-sectional areas of muscle fibers (×400 magnification)
Study of the mean-cross sectional area of the detrusor muscle suggested that it decreased significantly in t1–t6 with time and there were significant differences among the groups of MCI. However, in the reconstruction groups, the mean-cross sectional area of the detrusor muscle decreased in T1–T3 but increased in T4–T6 (Table 5.2).
Table 5.2
Cross-sectional area of the detrusor muscle (n = 8, x ±s)
Reconstruction group | Mean cross-sectional area (μm2) | Injury group | Mean cross-sectional area (μm2) |
|---|---|---|---|
Normal | 6,163.13 ± 583.50 | Normal | 6,163.13 ± 583.50 |
T1 | 4,964.04 ± 242.09 | t1 | 4,994.7 ± 183.11 |
T2 | 3,800.47 ± 283.54 | t2 | 3,748.8 ± 208.91 |
T3 | 3,341.43 ± 285.66 | t3 | 2,964.8 ± 182.89 |
T4 | 4,432.19 ± 401.26 | t4 | 2,047.22 ± 219.30 |
T5 | 4,680.22 ± 248.00 | t5 | 1,483.98 ± 133.93 |
T6 | 5,246.43 ± 343.71 | t6 | 962.01 ± 110.09 |
5.3.3 Ultrastructure of the Detrusor Muscle and NMJ
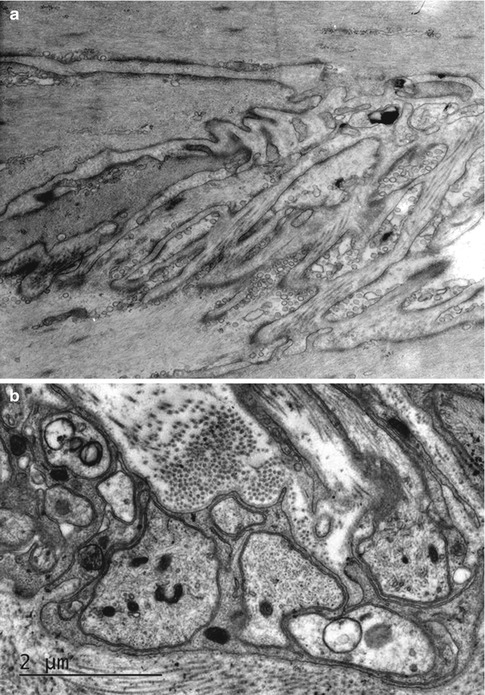
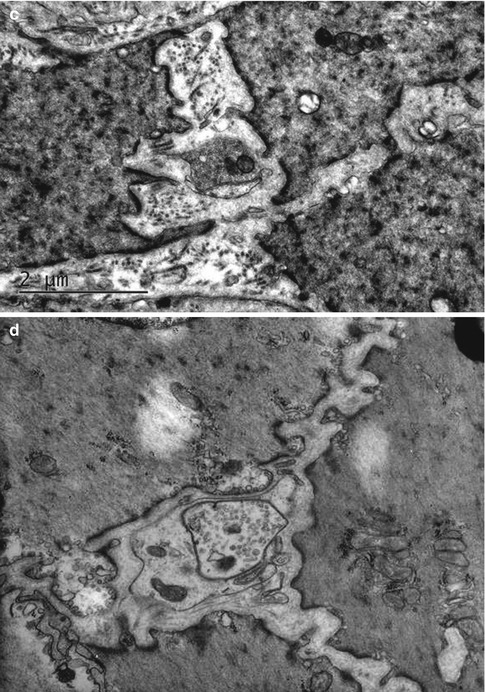
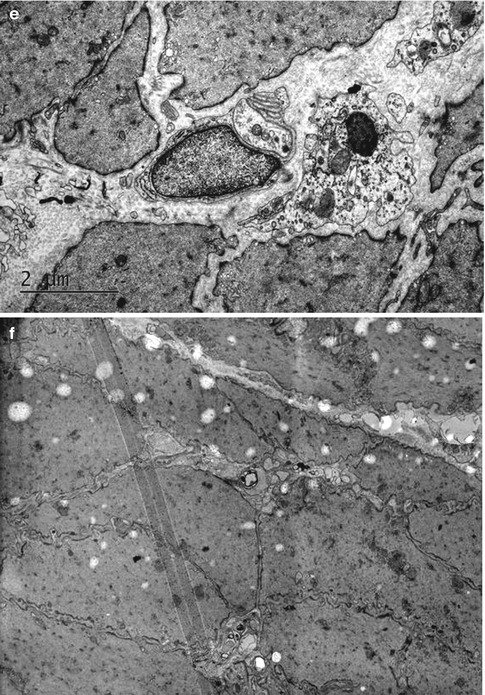
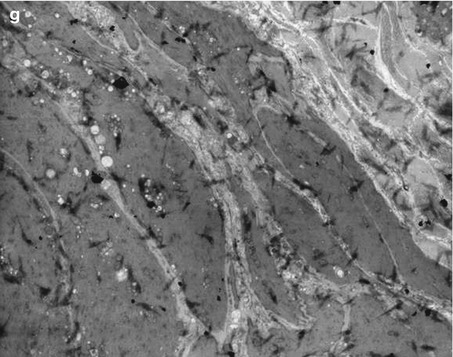
In the normal groups, SMCs were in a long shuttle shape and aligned in an orderly manner. The intercellular space was small and uniform. Mitochondria and endoplasmic reticula were not swollen. Dense bodies and parallel-arranged myofilaments could be seen in muscle cells. Many pinocytotic vesicles were observed under the muscle membrane. A normal NMJ was seen between the cells of the detrusor muscle, with abundant synaptic vesicles, mitochondria and endoplasmic reticula.
In the reconstruction and injury groups, atrophy of muscle cells, disorganized fibers, and decreased/absent connections between cells were observed. An increased distance between cells and an appreciable number of collagenous fibers between myocytes were noted. Intracellular organelles were swollen and the number of myofilaments reduced. Dense bodies and pinocytotic vesicles in myocytes were observed. A reduction in the number of synaptic vesicles in the NMJ of T1 and T3 was noted, but more synaptic vesicles were observed in the NMJ of T6. In t1, the number of synaptic vesicles in the NMJ was less than that in the NMJ of the normal group. In t3, the structure of the NMJ degenerated with a deficiency of synaptic vesicles. In t6, the NMJ was rarely seen between detrusor-muscle cells (Fig. 5.2).
