CHAPTER 94 Lumbar Provocation Discography: Clinical Relevance, Sensitivity, Specificity, and Controversies
INTRODUCTION
Lumbar provocation discography is a commonly used diagnostic procedure utilized to determine the presence or absence of discogenic pain at a specific spinal segment. Although discography has been proposed as the criterion standard for identifying discogenic pain [NASS statement], the test is controversial. Skeptics argue that newer diagnostic tests such as MRI scans make discography obsolete and the test should be discontinued unless its utility can be validated.1
CORRELATION OF LUMBAR PROVOCATION DISCOGRAPHY WITH HISTORY AND PHYSICAL EXAMINATION FINDINGS
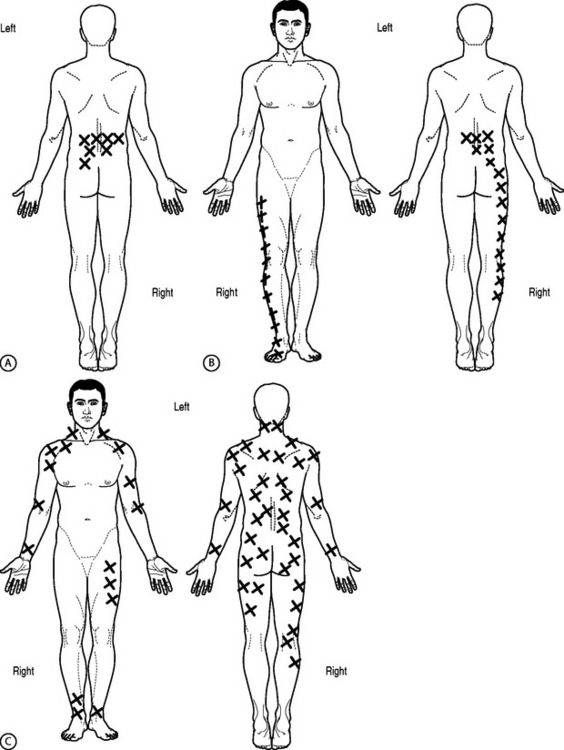
Various studies have attempted to correlate history and physical examination findings with the diagnosis of discogenic pain by discography and to compare these findings with respect to treatment outcome (Fig. 94.1). Simmons and Segil2 reported a diagnostic accuracy of 44% for clinical examination and 82% for discography based on ability to predict symptomatic level as confirmed by successful clinical result after surgery. They did not specify any particular tests used preoperatively, but used the following in follow-up examinations: straight leg raise, neurologic examination including reflexes, sensory or motor, range of motion, and tenderness. Although they correlated discogram results with these physical examination techniques, no other outcome instruments were correlated.
Schwarzer et al.3 found that no historical or clinical examination finding that they studied in 92 patients could accurately identify patients with internal disc disruption as diagnosed by provocation discography. Historical findings sought were pain increased or was relieved by sitting, standing, or walking. Pain referral patterns studied were pain into the buttock, groin, thigh, calf, or foot and whether the pain was unilateral, bilateral, or midline. Physical examination findings performed included provocation of pain with forward flexion, extension, rotation, combined rotation with extension, or straight leg raising making either back or leg pain worse.3 There was a trend (lowest p values obtained) with historical finding of pain increased with sitting (p=0.13), pain increased with standing (p=0.13), but also pain relieved with sitting (p=0.16) and physical examination finding of pain increased with forward flexion (p = 0.16). There was a negative trend (highest p values obtained) with a historical finding of pain increased with walking (p=0.89) or physical examination finding of pain increased with extension.
Young et al.4 prospectively examined 81 patients with clinical examination and various diagnostic injections and found a weak but statistically significant correlation of discogenic pain as diagnosed by discography with centralization of pain with repeated end-range movements (p=0.025, Phi=0.5). Although localization of a specific symptomatic level was not studied, 47% of those with positive discograms had ‘retreat of referred symptoms from the periphery toward the midline of the spine’ (centralization) during the standard McKenzie evaluation. Centralization was not seen with zygapophyseal joint pain as diagnosed by single intra-articular injection. Furthermore, all patients with a positive discogram (15 of 24 total discograms) reported pain when rising from sitting. A positive correlation (p=0.02) was, however, also noted in patients with sacroiliac joint pain.
Donelson et al.5 also prospectively studied 63 patients with chronic low back pain to evaluate the ability of the McKenzie mechanical lumbar assessment to diagnose discogenic pain and assess annular competence as determined by provocation discography. Seventy-four percent of centralizers and 69% of peripheralizers had a positive discogram as defined as exact pain reproduction accompanied by an abnormal image (nucleogram/CT), provided no pain was reproduced at an adjacent control level. The disc was interpreted as having a complete annular disruption or noncontained pathology if there was poor resistance to injection and contrast spread through the anulus to the epidural/perineural or peridiscal space. The disc was interpreted as having an intact outer anulus or contained pathology if there was firm resistance to injection even if contrast leaked from the disc at peak injection pressure. Of the centralizers, 91% had a competent anulus. Of the peripheralizers, 54% had a competent anulus. Of the patients whose symptoms did not change with repeated end-range movement, only 12.5% had a positive discogram. These differences were significant. The localization of a specific symptomatic level was not addressed and, therefore, these maneuvers could only be used for screening but not for identifying specific symptomatic disc levels for targeted interventional treatment.
A ‘bony vibration stimulation test’ or ‘vibration pain provocation’ was described by Yrjama and Vanharanta and the results of bony vibration were compared to the results of provocation discography.6 The studies assumed provocation discography as the reference standard and compared the bony vibration stimulation test by itself or in combination with either ultrasound or MRI.
Thirty-eight patients were studied with the bony vibration stimulation test, ultrasound, and provocation discography.7 Discs were graded by ultrasonographic findings. Grade 0 was a normal disc. Grade 1 discs showed a hyperechoic lesion in the inner anulus. Grade 2 discs demonstrated a hyperechoic lesion in the outer anulus. Grade 3 discs showed a hyperechoic area extending outside the disc. When used alone, the bony vibration stimulation test yielded a sensitivity of 65% and a specificity of 58%. In the patients with a grade 1 or grade 2 disc, the sensitivity was 90% and specificity 75%. In the patients who had a grade 3 disc and pain on bony vibration the sensitivity and specificity were 50%.
The authors also studied 33 patients with low back pain, correlating the results of bony vibration stimulation test and MRI with the results of provocation discography.8 When used alone, the bony vibration stimulation test yielded a sensitivity of 63% and specificity of 44%. If patients with history of previous lumbar surgery were excluded, the sensitivity was 61% and specificity 67%. In patients with or without previous history of surgery who had MRI findings of ‘partial annular rupture’ (as defined as irregular or absent intranuclear cleft images or bright-signal nuclear material into the outer anulus on T2-weighting), the sensitivity was 88% and specificity 50%. If the patients with previous surgery were excluded from this group, the sensitivity was 88% and the specificity 75%. The only false-positive finding in this group was a patient who was ‘hypersensitive’ and felt pain at all levels tested. If a ‘total annular rupture’ (defined as T2-weighted or proton density images showing discontinuity of the low-signal band representing the outer rim of the anulus) was seen, the sensitivity decreased to 47% and specificity to 50%.
UTILITY OF POSTDISCOGRAM COMPUTED TOMOGRAPHY
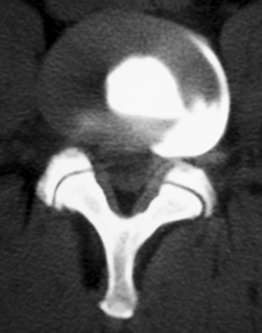
Discography was originally used as an adjunctive to myleography to visualize lateral herniations (Fig. 94.2). There are, however, fundamental limitations to using discograms exclusively as an imaging tool. The classic nucleogram patterns viewed with anteroposterior (AP) and lateral radiographs have been described as both normal and degenerative. Quinnell is credited with the original description of interpreting radiographic images of discography although he never proposed a classification scheme.9 He discussed the importance of monitoring contrast flow and volume to help improve the interpretation of the nucleograms.
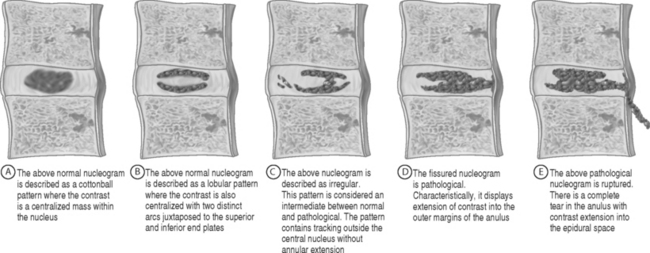
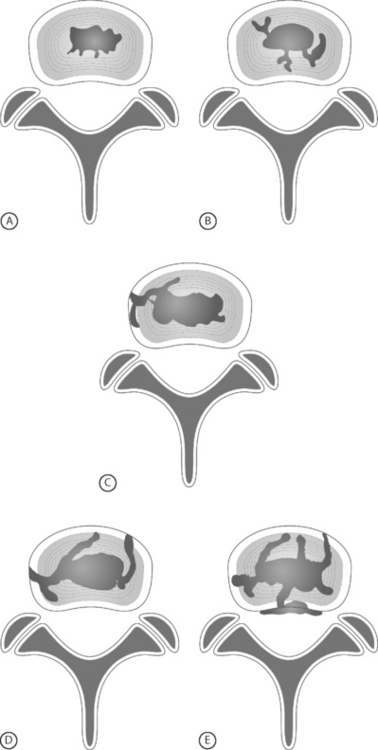
In 1986, Adams et al. initially classified nucleogram patterns into five categories; cottonball, lobular, irregular, fissured, and ruptured (Fig. 94.3).10 Cottonball and lobular patterns are thought to be normal variations, while fissured and ruptured are pathological. An irregular pattern is considered intermediate between these normal and pathological presentations. Adams et al. hypothesized the pathological patterns were due to disc degeneration. Cottonball nuclear patterns show the contrast central to the disc with an ovoid appearance (Fig. 94.3A). Lobular nuclear patterns also show the contrast centralized within the disc; however, there are two distinct arcs that may or may not be contiguous (Fig. 94.3B). An irregular pattern shows some tracking of the contrast outside the central nucleus without extension to the outer anulus (Fig. 94.3C). Although the contrast is intranuclear with irregular nucleograms, the small crevices and clefts exhibit early evidence of degeneration. Fissured nucleograms extend to the posterior annular margin, while ruptured nucleograms demonstrate complete radial tears and show contrast spread into the epidural space (Figs 94.3D, 94.3E).10 Adams speculated that by viewing the first four types of nucleograms, a natural progression of disc degeneration can be seen.
Postdiscogram CT scans provided a more comprehensive view of the disrupted anulus (Figs 94.4–94.6). Axial views allowed a more detailed view of pathological contrast patterns than the AP and lateral radiographs (see Figs. 94.3C, 94.3D, 94.3E). The disorganized patterns seen on radiographs now coalesced into structured images, demonstrating organized annular tears with circumferential spreading.
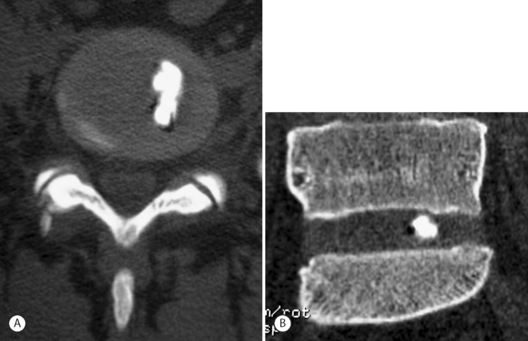
Fig. 94.4 Postdiscography CT with left-sided inner annular injection: (A) axial and (B) coronal views.
In 1989, Thomas Bernard published a case series of 250 patients who underwent both discography and postdiscography CT.11 He showed that computed tomography scanning after discography was not only able to define the type of herniation and disc architecture (protrusion, extrusion, sequestration, or internal disc disruption), but it could also be used to rationalize false-positive levels in the setting of non-nuclear injections (annular injections) (Fig. 94.4).
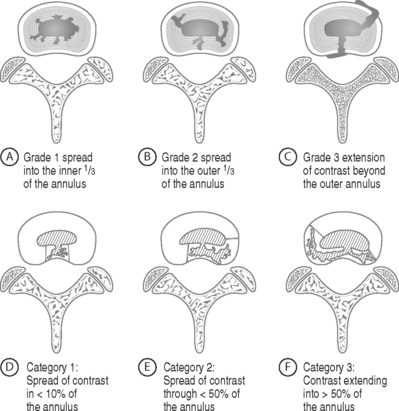
In 1987, Sachs et al. organized the previously inexactly described axial contrast patterns into the Dallas discogram scale (Fig. 94.5).12 Sachs’s original description was based on the appearance of the anulus. This allowed objective categorization of the anulus, classifying both degeneration and annular disruption separately. Sachs’s grading of the Dallas discogram scale is based on a four-point scale of 0 to 3, with zero defined as normal.
Annular disruption defined as ‘leaking/protrusion/annular fissuring’ is based on the radial spread of the contrast away from the center of the nucleus to the periphery (Fig. 94.5A–C). Grade 1 is defined as spread within the inner third of the anulus; grade 2 is into the outer third of the anulus, while a grade 3 is defined as moving beyond the outer anulus.12
Degeneration findings were based on the circumferential distribution of contrast contained in quadrants of the anulus (Fig. 94.5D–94.5F). Grade 1 was defined as local spread in less than 10% of the anulus. Grade 2 was defined as partial spread or less than 50%, while grade 3 was defined as greater than 50% spread of contrast across the anulus.
The development of the Dallas discogram scale not only allowed a new perspective to classify annular degeneration and disruption, but it also increased the inter-rater reliability when interpreting these findings. Sachs et al. were able to show 91% reproducibility and 88% repeatability when using the Pearson correlation test.12 Furthermore, they showed how standard AP and lateral discogram radiographs may appear normal until viewed axially. This reproducibility helped validate the Dallas discogram scale.
Aprill and Bogduk soon added a grade 4 to the disruption scale.13 Approximately 10 years after its original description, Schellhas et al. expanded upon the three-grade disruption classification system to propose the modified Dallas discogram scale. The modified Dallas discogram scale incorporates both aspects of degeneration described as circumferential involvement as well as annular disruption depicted as radial contrast extension. The definitions of grades 0–2 remained the same. Grade 3 was expanded slightly to include either focal or radial extension of contrast into the outer third of the anulus, with a limitation of circumferential spread less than 30 degrees. Grade 4 was defined the same as grade 3, but with greater than 30 degrees of circumferential spread into the outer anulus. Grade 5 is a full-thickness tear, either focal or circumferential, with extension of contrast outside the anulus (Fig. 94.6).14
CORRELATION OF LUMBAR PROVOCATION DISCOGRAPHY WITH LUMBAR MRI
Lumbar MRI is a sensitive means to investigate anatomic abnormalities of the low back. However, even asymptomatic subjects have been noted to have significant spinal pathology on imaging, including disc protrusion or extrusion with or without neural compromise.15–17 Therefore, although MRI demonstrates pathology, it does not necessarily reveal whether the abnormality is causing a patient’s symptoms. The correlation between MRI findings and provocative discography results has been investigated. The common goal of these studies was to determine whether imaging findings could predict the presence of concordant discogenic pain. If imaging studies could reliably predict discography findings, discography was unnecessary. The accuracy of MRI findings such as the high-intensity zone (HIZ) and endplate changes in determining symptomatic levels have been compared to the results of discography.18
High-intensity zone
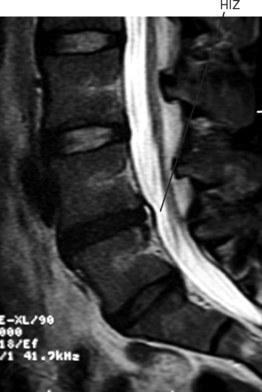
The high-intensity zone in the lumbar spine was first described by Aprill and Bogduk (Fig. 94.7)13 as a high-intensity zone (HIZ) seen on T2-weighted, sagittal images and defined by the authors as a high-intensity signal (bright white) located in the substance of the posterior anulus fibrosus. The HIZ must be clearly dissociated from the signal of the nucleus pulposus because it is surrounded superiorly, inferiorly, posteriorly, and anteriorly by the low-intensity (black) signal of the anulus fibrosus and because the HIZ has an appreciably brighter signal than the nucleus pulposus.
Schellhas et al.14 sought to reproduce Aprill and Bogduk’s findings with a similar study. In their retrospective analysis of 100 HIZs in 63 symptomatic patients, all discs with HIZ were internally deranged with annular disruption, 87 of 100 HIZ discs were concordantly painful at discography, and all 87 of these concordantly painful HIZ-containing discs had grade 3 to grade 5 annular tears on their modified Dallas discogram scale. Their schema is identical to Aprill and Bogduk’s; however, they further stratified the Dallas discogram and added grade 5 to identify those discs which had a ‘full-thickness tear, either focal or circumferential, with extra-anular leakage of contrast.’ Individual discs could be classified into two categories, such as grade3/grade 5 or grade 4/grade 5.14
Other similar studies correlating HIZ with positive provocation discography have shown poor sensitivity of 26%, high specificity of 90–95.2%, positive predictive values of 40–88.9%, and negative predictive value of 47–83%.19
The interobserver reliability of HIZ also varies. Aprill and Bogduk found that out of 67 images, the two observers agreed on the presence of HIZ in all but one (1.5%). Though both observers noted the abnormality, the two disagreed on its meeting the criterion of brightness due to poor-quality film. However, Smith et al.19 only found fair to good interobserver reliability with a kappa value of 0.57 with 95% confidence interval 0.44–0.70.
The original description by Aprill and Bogduk13 only included HIZ located in the posterior anulus and had a prevalence of 28%. The clinical significance of the HIZ was further studied by Rankine et al.20 in a patient population without neural compression. When including HIZs in any aspect of the anulus, the prevalence in a specialty spine surgery clinic was 45.5%. Most of these were posterior (77%) followed by posterolateral (22%). The HIZ was associated with moderate disc degeneration as assessed by signal reduction on T2-weighted sagittal images. There was no correlation of presence of HIZ with clinical features such as age, duration of symptoms, Oswestry score, or Schober’s extension–flexion range of motion testing. There was also no correlation with patient history of employment, pain above or below the knee, or the positions or activities worsening pain. No physical examination findings studied predicted the presence of HIZ. The examination findings tested were paraspinal muscle spasm, spinal tenderness, straight leg raise, neurologic testing with reflexes, myotomal and dermatomal testing, and Waddell’s testing. Correlation of HIZ presence with positive provocative maneuvers producing concordant axial pain with forward bending or extension/quadrant loading was not measured.
Endplate degeneration on MRI
Magnetic resonance signal intensity changes adjacent to vertebral endplates have been described and are associated with degenerative disc disease.21 Modic classified these endplate changes into two types, while others have expanded their classification to three.22 Type 1 endplate changes have decreased signal on T1-weighted images and increased signal intensity on T2-weighted images. Type 2 endplate changes have increased signal on T1-weighted images and isointense or slightly increased T2-weighted image signal intensity. Type 3 endplate changes have a decreased signal intensity on both T1-weighted and T2-weighted images. Kokkonen et al.18 compared endplate degeneration to pain provocation on discography and to the original Dallas discogram description which included three grades of annular disruption. Modic-type endplate degeneration was found to have a strong correlation with disc (anular) degeneration. There was no correlation between endplate degeneration and ‘disc rupture’(annular rupture) and no correlation between endplate degeneration and pain provocation by discography. Based on these data, provocation discography would not necessarily be positive for those who have pain associated with endplate changes.
LUMBAR PROVOCATION DISCOGRAPHY AND ITS PREDICTIVE VALUE FOR TREATMENT AND PROGNOSIS
In 1975, Simmons and Segil retrospectively reported the value of discography for the cervical, thoracic, and lumbar spine by accurately localizing a symptomatic spinal level based on postoperative results.2 Lumbar discograms were performed at 995 levels in 393 patients. Discogram results were assessed by patient pain response, amount and resistance to injection, and discographic appearance by Collis criteria, which describes discs as normal, degenerate, or protruded. Various clinical examinations were compared to the results of surgery on a scale with poor, fair, good, or excellent categories based on patient rating, complaints, occupation, activities, examination findings, and radiographic findings. It was assumed that if the patient was relieved of preoperative symptoms or was significantly improved after surgery, that the level of surgery selected by a certain test was accurate. Specific diagnoses and numbers for each were not reported but lumbar surgeries performed were ‘discotomy,’ ‘discotomy and fusion’ (usually posterolateral and intertransverse), and fusion alone without laminectomy. Overall, 94% of these lumbar surgery patients had satisfactory (fair to excellent) results. Diagnostic accuracy for these surgical outcomes was 44% for clinical examination, 71.5% for routine radiography, 45.6% for myelography, and 82% for discography. Specificity, sensitivity, false-positive, and false-negative rates were not addressed.
In 1979, Brodsky and Binder23 performed a retrospective study of patients who underwent discography. The authors performed discography only if the myelogram was negative but the patient was clinically thought to have discogenic pain. Specific indications included complaints which were atypical or without localizing neurologic signs, a myelogram which was equivocal or indeterminate, and a myelogram which was positive at one level while symptoms were suggestive of another. Discography was also performed to evaluate discs adjacent to a herniated disc. Decision-making was ‘significantly influenced’ by the discogram in 77.9% of cases. Decision-making would have been the same without discogram in 22.1%. Positive discography was confirmed with surgery in 55.8% of the cases.
In 1988, Calhoun et al. prospectively studied the predictive value of symptom reproduction during provocation discography as a guide to planning spine surgery for symptomatic intervertebral discs in the absence of nerve root compression.24 All 195 patients had lumbar provocation discography at L4–5 and L5–S1, most at L3–4, and some at L2–3 and all underwent lumbar surgery including anterior or posterior fusion and/or laminectomy. With at least 2-year follow-up, surgical success was based on whether the surgical objective was achieved radiographically (successful fusion, etc.) and clinical result was based on complete or significant relief of symptoms, resumption of work and/or normal activities, and no intake of analgesics. Failure to achieve these results was ‘clinical failure.’
Also in 1988, Blumenthal et al.25 used provocation discography to diagnose internal disc disruption (IDD) with the main purpose of the study being to evaluate the efficacy of anterior lumbar fusion as a treatment for IDD. All 34 patients underwent provocation discography and anterior fusion with average follow-up of 29 months. The diagnosis of IDD required radiographic signs of degeneration and discography with concordant pain reproduction with ‘instillation of small amounts of contrast.’ Successful treatment was defined as return to work or normal activities and either no medications or use of NSAIDs only. Fusion success was judged by radiographs only. The successful fusion rate was 73 %, but successful clinical treatment rate was 74%. Four cases were indeterminate for fusion. Of those with healed grafts, 73% had clinical success while only 62.5% of those with nonunion had clinical success. Of those patients with a successful clinical result, 81% had evidence of fusion while only 56% of the clinical failures had evidence of fusion. The authors cite higher previous fusion rates of 91–96%. Wetzel et al. performed a retrospective review of 48 patients, with a minimum follow-up of 2 years, who had lumbar arthrodesis based on provocation discography results.26 All were symptomatic for a mean time of 34.4 months prior to discography. Pain reproduction was graded as concordant or nonconcordant. The discography protocol did not, however, include a negative control disc. Fifty-four percent were single-level discographies, presumably without a control level. Two- and three-level discographies accounted for 31% and 14.5%, respectively. Sixty three-levels were graded as positive based on a concordant pain response. Seventy-five percent of patients had a single-level positive discogram, but 72% of these ‘single-level positive’ patients only had a single level studied. Two-level and three-level positive results were obtained in 18.9% and 6.2%, respectively. However, of the two-level positive discs, 77.8% only had a two-level discogram. None of the previously operated levels was included in discography. Fusion was performed to include all symptomatic levels determined by discography. Previously operated discs were included in fusion if they were adjacent to symptomatic discs. Anterior and posterior fusion techniques with and without varying instrumentation were performed. The clinical outcome was evaluated on the criteria of Zucherman which includes subjective symptom improvement, functional limitations, and amount of analgesic use. Categories were poor, fair, good, and excellent. Success of fusion was also assessed radiographically.
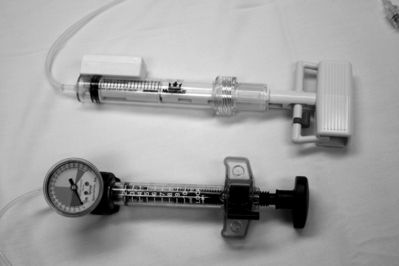
Derby et al. retrospectively evaluated pressure-controlled discography for its ability to predict surgical outcomes for interbody fusion, intertransverse fusion, combination fusion, or nonsurgical treatment.27 The study’s premise is that pressure-controlled manometric discography may allow improved and more specific diagnosis and categorization of discogenic pain and may have the potential to predict outcome of surgery (Fig. 94.8). The positive discs found on provocation discography of 90 patients were classified as ‘chemically sensitive,’ ‘mechanically sensitive,’ or ‘indeterminate’ based on pain provocation at specific values above ‘static opening pressure.’ ‘Opening pressure’ is the manometric reading taken when injected contrast is first visualized entering the disc on fluoroscopy. Derby et al. classified a chemically sensitive disc as one which has positive concordant pain provocation of (1) immediate onset when less than 1 mL of contrast is visualized reaching the outer anulus, or (2) at less than 15 psi above opening pressure. These discs were considered the ‘most positive’ since the lowest pressures resulted in significant concordant pain. A disc was classified as ‘mechanically sensitive’ when concordant pain was noted between 15 psi and 50 psi above opening pressure. A disc was categorized as ‘indeterminate’ when concordant pain occurred between 51 and 90 psi above opening pressure. A disc was classified as normal if no pain occurred at pressures up to 90 psi above opening pressure. Thirty-six patients with chemically sensitive discs were identified. Clinical outcomes were based on the Patient Satisfaction Index adapted from the NASS low back pain outcome instrument, numerical rating scale for pain, and a modified ADL scale. ‘Favorable outcome’ was defined as at least two favorable outcomes of the three scales.


Stay updated, free articles. Join our Telegram channel

Full access? Get Clinical Tree


