Chapter 16 Lower Limb Neuromuscular Control and Strength in Prepubescent and Adolescent Male and Female Athletes
INTRODUCTION
An estimated 30 million children aged 5 to 18 years participate in organized sports programs each year in the United States.1 Unfortunately, approximately one third of these athletes sustain injuries frequently in the ankle or knee that require medical treatment.1,47,62,78 Several studies have reported that female athletes have a four- to eightfold higher incidence of serious knee ligament injury than males participating in the same sport.4,15,36,51 The mechanisms responsible for the disparity between genders in knee ligament injury rates, especially in regard to the anterior cruciate ligament (ACL), are controversial and not scientificallydefined at present. Theories have included anatomic variations, environmental influences, hormonal fluctuations, and genetic factors.34 Investigators have described gender differences in neuromuscular indices including muscle strength, running, cutting, sidestepping, and landing characteristics in adolescent and adult populations that are believed to be at least partially responsible for the differences in knee ligament injury rates.*
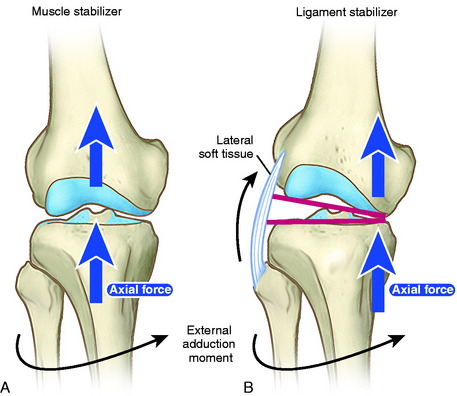
A valgus lower limb alignment commonly occurs during noncontact ACL injuries, when an athlete either lands from a jump or attempts to accelerate into a jump.11,28,30 Scientists have reported significant differences between genders in knee and hip flexion angles44 and ground reaction forces placed on the lower extremity upon landing.42,57,68,69,76 Experimental studies show that, in a cadaver model, a valgus torque combined with an anterior tibial force results in statistically significant larger strain in the ACL than that produced from an anterior tibial force alone (P < .0001).10 Markolf and coworkers54 measured in vitro forces in the ACL during isolated and combined loading states in cadaver knees. Increases in ACL forces occurred when a valgus or varus moment was applied with an anterior tibial load compared with those measured when an anterior tibial load only was applied. In addition, high valgus or varus moments increase the risk for medial or lateral tibiofemoral joint lift-off and the potential for a knee ligament rupture (Fig. 16-1).54 It is unknown whether one can extrapolate these laboratory findings to an increased risk of ACL injury when an athlete lands or collapses into a valgus position, with little distance separating the right and the left knee.
This chapter summarizes a series of four studies conducted by the authors that measured the effects of chronological age and gender in athletes 9 to 17 years of age on isokinetic lower extremity strength, lower limb alignment during a drop-jump test, and lower limb symmetry during single-leg-hop tests. The ages for the hypotheses developed for the studies were based on the mean time to achieve peak height velocity (mean, 11.5 yr for girls and 13.5 yr for boys88) and skeletal maturity (mean, 13.3 yr for girls and 14.3 yr for boys3). All studies were approved by a local hospital’s institutional review board.
NEUROMUSCULAR TESTING METHODS
The goal of the SIT was to collect data on a large number of young athletes that included
Videographic Drop-Jump Screening Test
A drop-jump videographic screening test was developed as described in detail previously.65 Minimal equipment is required and the software is available from the authors’ nonprofit foundation. A camcorder equipped with a memory stick is placed on a stand 102.24 cm (40.25 inches) in height. The stand is positioned approximately 365.76 cm (12 ft) in front of a box 30.48 cm (12 inches) inheight and 38.1 cm (15 inches) in width. One-inch Velcro circles are placed on each of the four corners of the box that faces the camera. Athletes wear fitted, dark shorts and low-cut gym shoes. Reflective markers are placed at the greater trochanter and the lateral malleolus of both the right and the left legs, and Velcro circles are placed on the center of each patella. A research assistant demonstrates the jump-land sequence, and one practice trial is done to ensure the athlete understands the test. No verbal instruction regarding how to land or jump is provided. Athletes are told only to land straight in front of the box to be in the correct angle for the camera to record properly. The athletes perform a jump-land sequence by first jumping off the box, landing, and immediately performing a maximum vertical jump. This sequence is repeated three times.
Critical Points NEUROMUSCULAR TESTING METHODS
Sports injury test done on 1140 athletes (916 female, 224 male) 9–17 yr of age.
Videographic Drop-Jump Screening Test
Isokinetic Evaluation of Knee Extensor and Flexor Strength
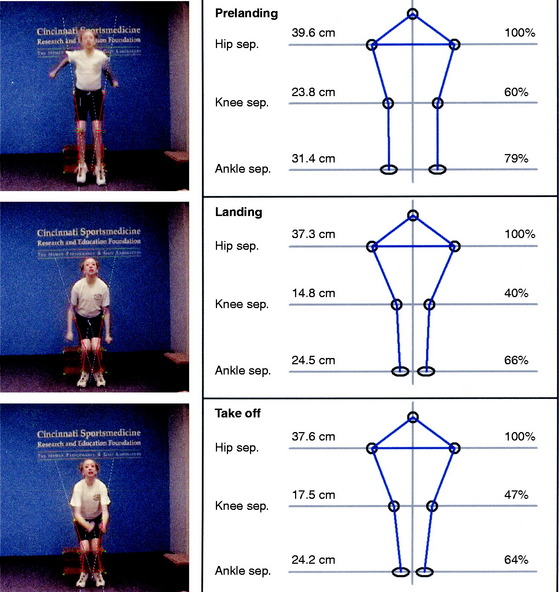
The absolute centimeters of separation distance between the right and the left hip and normalized separation distances for the knees and ankles, standardized according to the hip separation distance, are analyzed. Normalized knee separation distance is calculated as knee separation distance divided by hip separation distance and normalized ankle separation distance is calculated as ankle separation distance divided by hip separation distance (Fig. 16-2).
The reliability of the drop-jump videographic test was determined in 17 female athletes who underwent the test twice, 7 weeks apart.65 The reliability of the absolute centimeters of hip separation distances was evaluated. Hip separation distance was expected to be highly reliable, thus providing the basis for normalization of knee and ankle separation distances. Then, in 10 other subjects, reliability within the videographic test was assessed by capturing two of the three jump-land sequence trials and comparing the absolute centimeters of hip, knee, and ankle separation distances between the two sequences on the same day of testing. For the test-retest trial, the intraclass correlation coefficients (ICC) for the hip separation distance demonstrated high reliability (pre-land, .96; land, .94; take-off, .94). For the within-test trial, the ICC for the hip, knee, and ankle separation distance were all .90 or higher, demonstrating excellent reliability of the videographic test and software capturing procedures.
Isokinetic Evaluation of Knee Extensor and Flexor Strength
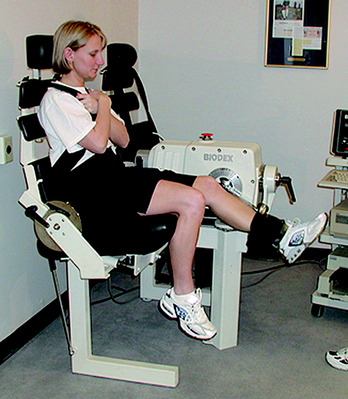
Isokinetic knee extensor and flexor testing was conducted (concentric mode) at 300°/sec (Fig. 16-3) in athletes over the age of 11 years. For the children who were 9 to 10 years of age, this test was performed at 180°/sec. Other investigators have reported acceptable reliability of isokinetic measurements in children and adults at these test velocities.48,58,60 The athletes first completed a dynamic warm-up session that lasted 5 minutes. They were then positioned in the chair of the device with appropriate torso, pelvis, and thigh straps placed according to the manufacturer’s protocol. The lever arm of the dynamometer was aligned with the lateral epicondyle of the knee, with the knee flexed to 90°. The chair was adjusted for each athlete as required to ensure proper positioning. The range of motion during the test was fixed from 90° to 0°. Gravitational factors were calculated by the dynamometer and automatically compensated for during the tests. The athletes performed three to four submaximal trials to become familiar with the machine and test velocity. A total of 10 repetitions were completed and the highest peak torque value used for analyses. Mean peak torque values (in Newton-meters [Nm]) were normalized for body weight (BW) in kilograms. Verbal encouragement was given throughout the tests, because the athletes were told to kick as hard and as fast as possible, but no visual feedback was available.
Isokinetic Evaluation of Internal and External Tibial Rotation Strength
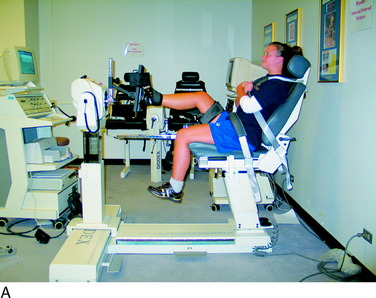
An isokinetic assessment of knee internal tibial rotation (IR) and external tibial rotation (ER) strength was conducted on a calibrated Biodex System 3 (Biodex Medical Systems, Inc., Shirley, NY). The IR and ER peak torques of each limb were obtained at 120°/sec and 180°/sec. Testing was preceded by a dynamic warm-up that lasted approximately 5 minutes. The patients were positioned in the device in a partial supine position with the hip flexed 60° and the knee flexed 90° as described by Hester and Falkel (Fig. 16-4).39 Appropriate torso, pelvis, and thigh straps were placed according to the manufacturer’s protocol. In addition, the foot and ankle were tightly secured to a footplate using Velcro (VELCRO USA, Manchester, NH) straps.39 The athletes were instructed to relax so that the neutral position with regard to tibial rotation and the range of internal and external tibial motion could be obtained.72,89 Five submaximal repetitions were done before each test to promote familiarization with the dynamometer velocity speeds and to set the range of motion limits for both IR and ER.
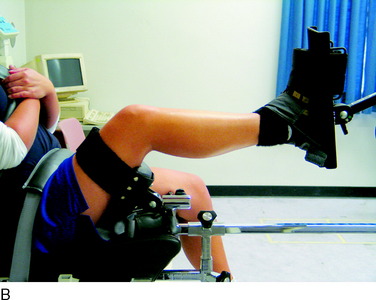
There were 2-minute rest periods between the two velocity speed tests. The testing sequence of the dominant and nondominant limbs was randomized among the subjects. Verbal encouragement was given throughout the tests, because the athletes were told to rotate their lower leg through full range with maximal effort, but no visual feedback was available. A total of eight repetitions were completed at each speed and the single highest peak torque value used for analyses. Peak torque values were normalized for BW in kilograms and were expressed as (Nm/BW). Time-to-peak torque was measured in milliseconds (msec). The ratio of the mean peak torque of IR was calculated relative to that of ER (ratio IE = IR/ER × 100) in a manner described by Segawa and associates.82 The ratio of the mean peak torque of both IR and ER were also calculated relative to that of knee flexion. The ratio IR-F was calculated as IR/flexion × 100, and the ratio ER-F was calculated as ER/flexion × 100. The ratio of the mean peak torque of IR (IR-E) and ER (ER-E) were also calculated relative to that of knee extension in a manner similar to that described for knee flexion.
Single-Leg Functional Hop Testing
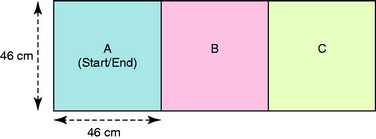
Two single-leg functional hop tests were conducted: a timed side-hop and a crossover hop for distance. The athletes were provided with instructions and one practice trial was conducted for each test. In the timed side-hop test, a course was created on the floor using masking tape to mark three boxes that were 46 × 46 cm (Fig. 16-5).7 The athletes were encouraged to hop as fast as possible, but to maintain balance to be able to complete the test. If the athlete did not clear the lines, double-bounced between hops, or could not hold balance on landing, a zero was recorded. Two tests were completed for each limb, with mean times calculated with a standard stopwatch to the nearest .01 sec.
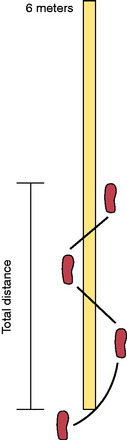
In the crossover hop for distance test, a marking strip made of masking tape was placed on the floor that extended approximately 6 m (Fig. 16-6).63 The athletes hopped three consecutive times on one foot, crossing diagonally over the tape on each hop. They were encouraged to go as far as possible while maintaining balance and control. The total distance hopped was measured and each leg tested twice, with the average distance calculated. The reliability of this test has been reported by other investigators to be excellent.5,12,29
Limb symmetry was calculated for each test by dividing the mean of the right limb by the mean of the left limb andmultiplying the result by 100. Prior studies on populations aged 17 to 34 reported that less than 85% limb symmetry on single-leg-hop tests was abnormal and representative of a general lower limb functional limitation.6,63
STUDY #1: VIDEOGRAPHIC DROP-JUMP SCREENING TEST
In this investigation, 325 female and 130 male athletes aged 11 to 19 underwent the videographic drop-jump screening test.65 A neuromuscular-training program40,42 (Sportsmetrics) was completed by 62 of the females; their jump-landing characteristics were reexamined within 1 week of the final training session. This subgroup also underwent an isokinetic evaluation of knee extensor and flexor strength before and after the neuromuscular-training program. The training sessions, described in detail in Chapter 19, Decreasing the Risk of ACL Injuries in Female Athletes, lasted approximately 1 hr/day, 3 days a week on alternating days and consisted of stretching, plyometric jump-training, and weight training under the supervision of a certified instructor. Participation in the training program was strictly voluntary and no attempt was made to influence certain individuals over others to complete the training with respect to the results of the initial videographic tests. Power and sample-size calculations were done to evaluate the primary study findings, the effect of training on absolute knee separation distance and normalized knee separation distance. With 62 trained females, it was found that this investigation had sufficient power (90%) to detect significant differences at a level of 0.05.
Hypothesis #1: Female Athletes Have an Overall Lower Limb Valgus Alignment, Indicated by Abnormally Decreased Knee Separation Distances, on Landing and Acceleration into a Vertical Jump on a Videographic Drop-Jump Test
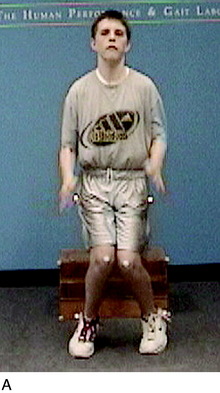
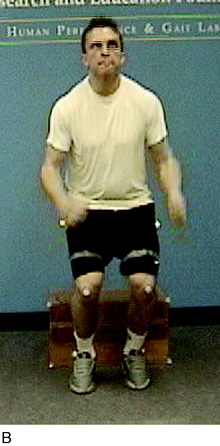
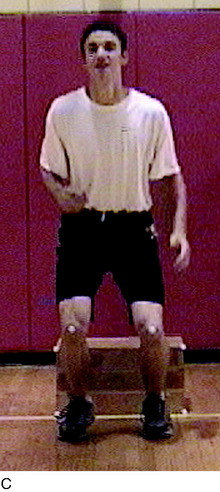
The hypothesis was supported, because a marked overall lower limb valgus alignment (indicated by a knee separation distance of ≤ 60%) was found in 63% of the female athletes on landing (Fig. 16-7) and in 80% on take-off.
Hypothesis #2: Male Athletes Have a More Neutrally Aligned Lower Limb Position, with a Greater Amount of Separation Distance between the Knees, on Landing and Acceleration into a Vertical Jump Compared with Females on a Drop-Jump Test
The hypothesis was not supported, as a marked overall lower limb valgus alignment was found in 75% of the male athletes on landing (see Fig. 16-7) and in 72% on take-off. There was no statistically significant difference between male and female athletes in the mean normalized knee and ankle separation distance during the landing and take-off phases. The female athletes had significantly higher mean normalized knee and ankle separation distances during the pre-land phase only.
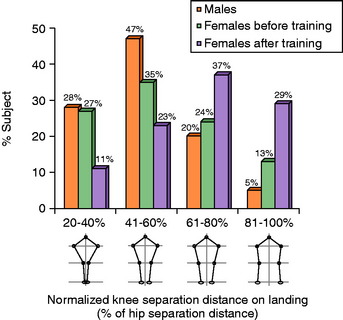
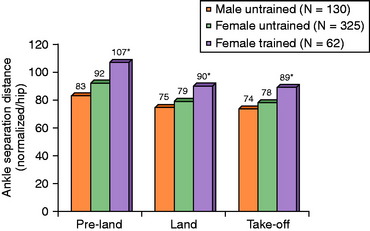
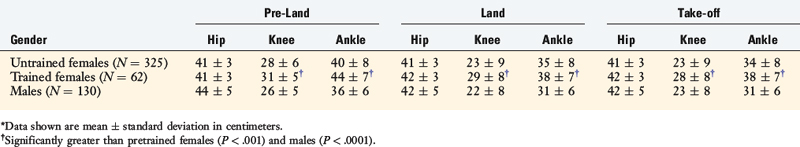
The normalized knee separation distances for both genders are shown in FIGURE 16-8, the normalized ankle separation distances are shown in FIGURE 16-9, and the absolute values for the hip, knee, and ankle separation distances are shown in Table 16-1. There were no correlations between knee and ankle separation distances for each phase of the jump-land sequence in either the female or the male athletes.
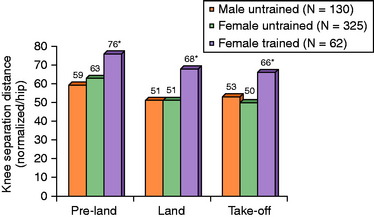
Hypothesis #3: A Neuromuscular-Training Program Will Produce Significantly Greater Knee Separation Distance in Female Athletes, thereby Producing a More Neutrally Aligned Lower Limb Position on a Drop-Jump Test
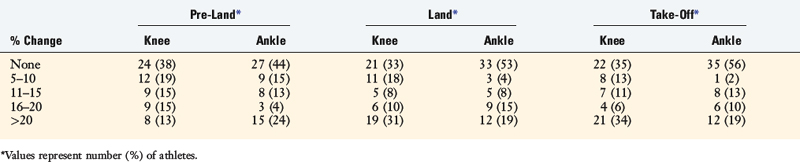
The neuromuscular-training program was effective, supporting the hypothesis, because statistically significant increases were found after training in the subgroup of 62 females in the absolute (see Table 16-1) and the normalized knee (see Fig. 16-8) and ankle (see Fig. 16-9) separation distances for all phases of the jump-land sequence (P < .001). After training, the female athletes had statistically greater mean normalized knee and ankle separation distances than the male athletes for all phases of the jump-land sequence (P < .0001). In addition, after training, a statistically significant difference was found in the distribution of female athletes who had less than 60%, 61% to 80%, or greater than 80% knee separation distance on landing (P = .003) and take-off (P = .006). The distribution in the percentage change in knee and ankle separation distances after training is shown for all three phases of the jump-land sequence in Table 16-2.
TABLE 16-2 Change in Normalized Knee and Ankle Separation Distances after Neuromuscular Training in 62 Female Athletes
Implication of Findings
The authors developed and studied a videographic drop-jump screening test to record lower limb axial alignment in the coronal plane using a single standard videographic camera. The testing procedure was designed to be relatively easy to perform by researchers, coaches, trainers, or therapists in any facility. The goal was to provide a general indicator of an athlete’s lower limb axial alignment in the coronal plane in a straightforward drop-jump and vertical take-off task. The authors do not propose that this videographic analysis can be used as a risk indicator for a knee ligament injury. The test depicts only hip, knee, and ankle positions in a single plane during one maneuver, and it is recognized that noncontact ACL injuries may occur in side-to-side or cutting motions. A more sophisticated multicamera system would be required to measure these types of motions. The use of even just a second camera to measure the degrees of knee flexion on landing would provide additional information44; however, the goal was to use one camera to make the measurements easier to perform from a screening standpoint. Because of these limitations, it may be that the single-plane videographic drop-jump test was not sensitive enough to depict relevant differences in landing patterns between the sexes.
Authors have reported that 58% to 61% of noncontact injuries occur on landing from a jump.28,30 The final position of the knee joint on landing is influenced by the center of gravity of the upper body and the trunk over the lower extremity. Equally important are the positions of trunk-hip adduction or abduction, foot-ankle pronation-supination, and foot separation distance. These effects combine together to produce either a varus or a valgus moment about the knee joint that must be balanced by the lower limb musculature (see Fig. 16-1).42 If the athlete is off-balance, or has contact with another player, a loss of trunk and lower limb control and position may occur and the knee joint may go into a hyperextended or severe valgus position. The knee position measured in the coronal plane in the authors’ single-plane videographic analysis is a reflection of rotations in both the coronal and the transverse planes (internal-external femoral and tibial rotation). This test does not distinguish between these individual motions, which requires more sophisticated instrumentation.42
Although there are many potential mechanisms for ACL injury, it has been postulated that excessive valgus moments about the knee joint with subsequent high anterior tibial shear forces may be one of the ACL injury mechanisms in females.33,46,53 Excessive valgus loading may result in decreased tibiofemoral contact or condylar lift-off54 and a reduction in the normal joint contact geometry that contributes to knee joint stability. This position, coupled with a highly activated quadriceps muscle that produces maximum anterior shear forces with the knee joint at low flexion angles (≤30°),23,35,67 can lead to ACL rupture.
Hamstrings muscle activation with the knee joint at or near full knee extension (≤30°) produces insufficient posterior tibia shear forces to protect the ACL owing to the small angle of inclination of the hamstring tendons.73 Noyes and Sonstegard66 described a decreased mechanical advantage of the inner hamstrings when the knee is extended, because the hamstring flexion force at 0° is approximately half that at 90°. Similarly, the rotation force of the inner hamstrings declines with knee extension, because the rotation force at 0° is 41% that of the rotation force that occurs at 90°. A rotation “wind-up” effect exists, in which the IR forces increase significantly with ER owing to an increase in muscle mechanical advantage.
The authors hypothesized that the majority of untrained female athletes would demonstrate an abnormal lower limb position on landing from a drop-jump and on acceleration into a vertical jump. A normalized knee separation distance of less than 60% occurred in 63% of the untrained females on landing and in 80% on take-off. It was also hypothesized that the majority of young male athletes would demonstrate a neutrally aligned lower limb position on landing and acceleration into a vertical jump. This hypothesis was not supported, because 75% of the males had marked knee separation distances on landing and 72% on take-off, indicating a valgus-aligned lower limb position. The significance of this finding is unknown and may represent an aberration requiring further study (Fig. 16-10). It may be that this single-plane videographic test was not sensitive enough to depict relevant differences in landing patterns between the sexes. Other studies that used multicamera systems or force plates to investigate the drop-jump test found significant differences between females and males regarding knee flexion angles,44 knee extension moments,16,42 knee valgus moments,16 and ground reaction forces.42 A prior investigation determined that untrained female athletes had lower knee extension moments than males and postulated that this was explained by the male subjects’ high use of the hamstrings as a knee flexor at landing.44
< div class='tao-gold-member'>
Related posts:
 Human Movement and Anterior Cruciate Ligament Function: Anterior Cruciate Ligament Deficiency and Gait Mechanics
 Differences in Neuromuscular Characteristics between Male and Female Athletes
 Rehabilitation after Articular Cartilage Procedures
 Lateral, Posterior, and Cruciate Knee Anatomy
 The Scientific Basis for Examination and Classification of Knee Ligament Injuries
 Posterior Cruciate Ligament: Diagnosis, Operative Techniques, and Clinical Outcomes
Stay updated, free articles. Join our Telegram channel

Full access? Get Clinical Tree


