Limb-Length Discrepancy
Matthew A. Halanski
Kenneth J. Noonan
INTRODUCTION
The child with a leg-length discrepancy presents a variety of challenges to the treating orthopaedist who must understand the natural history of the disease process and be able to predict the discrepancy as it will exist at maturity. In order to do so, it is required to be familiar with the methods used to analyze growth and to predict future growth. Implicit to this is an understanding of methodology, risk, and the effect of the wide variety of treatment options on the growing child. Limb-lengthening techniques have evolved rapidly, and the orthopaedic surgeon must consider the ability of these techniques to equalize length discrepancy in light of physical and mental morbidity to the patient. Although enamored with the potential to correct large discrepancies, surgeons and parents need to consider the long-term effects of these treatments on the child.
In addition to understanding the assessment and methodology for treatment of length discrepancies, the surgeon is challenged by the sometimes difficult task of educating the patient and parents. In the case of epiphysiodesis, it can be difficult to explain why a problem in one leg requires an operation on the normal leg; furthermore, patients are not pleased at the thought that it will make them shorter. In the case of leg lengthening, the parents and the patients must understand why the child may wear an external device for many months even after the length is gained. In addition, the family must understand that a fairly high morbidity is associated with this process and the risk of complications can occasionally compromise the final result.
DEFINITIONS
First, we must define what we mean when we say someone has a leg-length discrepancy. Do they have an angular deformity, dislocation, or contracture at the hip, knee, ankle, or foot causing one limb to be apparently shorter or longer? Or is there a true anatomic difference in lengths/size of one of the segments of the lower extremity (femur, tibia, foot)? To avoid confusion, we define structural or true leg-length discrepancy as a difference in the length of a given anatomic segment (femur, tibia, foot). A leg-length discrepancy that refers to discrepancies that are not true differences in anatomic segment lengths are termed apparent or a postural discrepancy. As an example, a knee flexion contracture or a dislocated hip may cause an apparent shortening of a limb. Functional leg-length discrepancy (the sum of the true and apparent leg-length discrepancy) is the most important in treatment decisions (Fig. 28-1). Just as important in the future outcome of leglength differences is the understanding of age, maturity, and growth potential. Chronologic age refers to the actual years of life. Skeletal (bone) age is a measure of maturity based on a set of “norms” from which we can make predictions on future growth. From clinical and radiographic assessment, one arrives at a functional length discrepancy and the overall maturity of the patient. Treatment can be considered based on a prediction of the final discrepancy at skeletal maturity and an understanding of the natural history.
EPIDEMIOLOGY, GROWTH, AND ETIOLOGY OF LEG-LENGTH DISCREPANCY
Leg-length differences are common at skeletal maturity. In one study, 77% of 1000 military recruits were found to have differences in leg lengths (1), in another group of military recruits, 36% had differences >0.5 cm (2). In the pediatric population, 2.6% of asymptomatic adolescents were found to
have leg-length differences large enough to cause a clinically noticeable pelvic obliquity during scoliosis screening (3).
have leg-length differences large enough to cause a clinically noticeable pelvic obliquity during scoliosis screening (3).
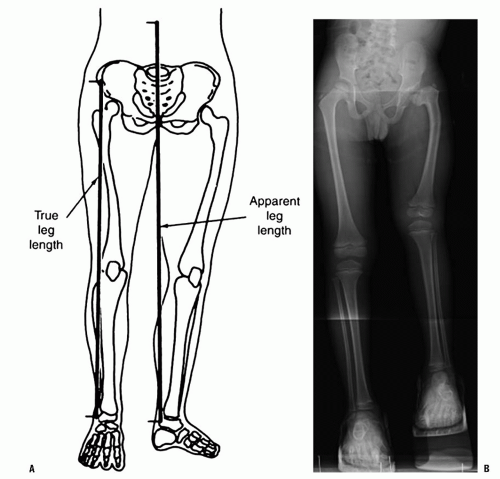 FIGURE 28-1. A: True leg length is a measure from a point on the pelvis (ASIS) to the ankle and apparent leg length is a measure from the umbilicus to the ankle. The latter is affected by hip abduction or adduction as well as knee and hip flexion. B: Functional leg-length discrepancy takes into account the combined effect of the true leg discrepancy and the hip and knee pathology seen in this child with congenital short femur; even with orthotic shoe modification his lower extremity is still slightly short. |
In any attempt to predict what will occur in two lower limbs in which unequal growth has been found, one must first understand the normal growth of the lower limb. At birth, the lower limbs are 20% of their final length. The difference in the length of the femur and tibia at birth is 1.2 cm compared with the 10 cm at skeletal maturity (4). The femur and the tibia respectively contribute 54% and 46% of the length of the lower extremity at skeletal maturity; these percentages change throughout growth (5, 6 and 7). The growth of the lower limb occurs at four growth plates and the foot. The majority of growth of the lower limb occurs about the knee. Anderson found that 71% of femoral growth occurred distally and 57% of the tibia growth occurred proximally (6). This can be shown diagrammatically in terms of percentage of bone growth, limb growth, and actual average growth per year (Fig. 28-2).
In general, overall growth rate and lower extremity growth rate decrease from birth until adolescence when the adolescent growth spurt occurs (6) (Fig. 28-3). More specifically, growth can be considered to happen at different rates throughout development. Dimeglio describes four periods consisting of the antenatal period (exponential growth), birth until 5 years of age (rapid growth), 5 years until puberty (stable growth), and finally puberty (acceleration/deceleration). Using skeletal ages, Dimeglio has demonstrated an early increased growth rate (3.2 cm/yr to 5 cm/yr) at puberty termed the acceleration phase followed by a decreased growth rate during the remainder of puberty (4). This limb peak height velocity occurred 6 months before that of the peak height velocity of the spine.
Thus, at the onset of puberty (Tanner stage 2 and skeletal age of 13 for boys and 11 for girls), the average growth remaining in the lower extremities was 10 cm for boys and 9 cm for girls before reaching skeletal maturity. Growth patterns can also be described in the Green and Anderson growth data whereby the lower extremities grow after the age of 5 years an average of 3.5 cm per year (2 cm/yr from the femur and 1.5 cm/yr from the tibia) until puberty.
Thus, at the onset of puberty (Tanner stage 2 and skeletal age of 13 for boys and 11 for girls), the average growth remaining in the lower extremities was 10 cm for boys and 9 cm for girls before reaching skeletal maturity. Growth patterns can also be described in the Green and Anderson growth data whereby the lower extremities grow after the age of 5 years an average of 3.5 cm per year (2 cm/yr from the femur and 1.5 cm/yr from the tibia) until puberty.
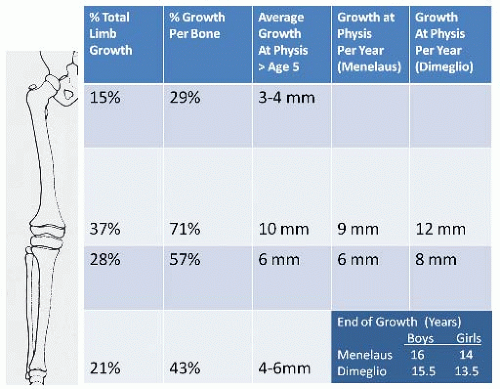 FIGURE 28-2. Cumulative data representing the growth of the lower extremity. |
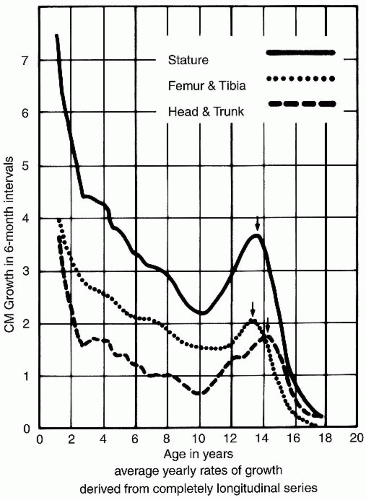 FIGURE 28-3. Green and Anderson growth curve. The examination of growth rate as a function of chronologic age shows a major growth spurt during adolescence. Interestingly, no such spurt appears in the growth curve of Figures 29-6 and 29-7. (From Green W, Anderson M. Skeletal age and the control of bone growth. Instr Lect Am Acad Orthop Surg 1960;17:199-217.) |
Etiology Leading to Abnormally Shortened Limb.
Several congenital conditions of limb-length discrepancy (congenital short femur, fibular hemimelia, tibia hemimelia) may be apparent at birth and continue to inhibit growth of the short limb as the child ages. Thus in mild cases, the difference in length may only be noticed as the child gets older. In initially apparent cases, a structural deformity may exist within the bones themselves including the physis. For instance, congenitally short femurs are often associated with coxa vara, bowing, hypoplasia of the lateral femoral condyle, and external torsion (8, 9 and 10). In addition the congenitally short femur may be associated with other clinically noticeable limb abnormalities including fibular hemimelia (11, 12), anterior cruciate ligament (ACL) deficiency (13, 14, 15, 16 and 17), ball-in-socket ankle, tarsal coalition, and absent metatarsals and toes (18) (Fig. 28-4). Posterior medial bowing of the tibia is another congenital condition that has also been shown to accompany a leg-length discrepancy as well as calcaneal-valgus feet (19, 20 and 21). Other conditions that lead to limb-length discrepancy include congenital pseudarthrosis of the tibia (22); and patients born with a clubfoot have an increased risk of having a leg-length discrepancy as a result of smaller foot size and also decreased length in the tibia (23) (Fig. 28-5).
An acute change in bone length usually follows trauma and fracture malunion. When a fracture heals in a shortened position, an immediate difference in limb length is observed. Some regrowth is likely to occur in younger patients (24, 25); this is especially seen in the femur (see below). Unfortunately regrowth is unlikely to occur in older children and adolescents with shortening >2.5 cm in the femur, thus leaving a permanent leg-length discrepancy. Similarly, avascular necrosis secondary to Perthes disease, idiopathic, or iatrogenic causes can result in an acute loss of height in addition to damaging the physis of the proximal femur (26, 27).
More commonly, limb-length discrepancies result from gradual changes in leg lengths associated with growth arrests from various causes. Growth plate fractures resulting in partial or total growth arrest may result in growth arrests with or without angular deformities. Similarly neonatal sepsis with multifocal osteomyelitis and septic arthritis with an associated intra-articular growth plate (i.e., proximal femur) lead to physeal destruction and growth arrest (28) (Fig. 28-6). Other causes of premature growth arrest include radiation exposure (29) and neoplastic processes. The latter can be malignant or benign tumors-enchondroma, osteochondroma, and unicameral bone cysts. In these cases, growth arrests result from alterations in local growth or by iatrogenic means in treating them. Mechanical forces can lead to growth retardation and
include infantile and adolescent Blount disease, which cause varus deformities of the proximal tibia through medial growth inhibition at the proximal tibia (30). The angular deformities seen in Blount disease and the anterolateral bowing seen in congenital pseudoarthrosis of the tibia, both cause an apparent discrepancy due to the deformity and a true discrepancy in that the affected bones are shorter than their normal counterparts.
include infantile and adolescent Blount disease, which cause varus deformities of the proximal tibia through medial growth inhibition at the proximal tibia (30). The angular deformities seen in Blount disease and the anterolateral bowing seen in congenital pseudoarthrosis of the tibia, both cause an apparent discrepancy due to the deformity and a true discrepancy in that the affected bones are shorter than their normal counterparts.
Vascular impairment can also result in altered growth plate function and can be seen as a complication of regional disruption of blood supply [e.g., umbilical or femoral catheterization (31)] or local disruption [e.g., hip surgery in the infant (32)]. In these vascular causes, the likelihood of discrepancy can be correlated to the pattern of ischemic damage and increases with increasing involvement (33). Septic and vascular insults to the growth plate tends to lead toward diffuse growth plate dysfunction while trauma or neoplastic process may result in more discrete formation of bony bars between the metaphysis and the epiphysis preventing further growth.
 FIGURE 28-4. A: Patient with congenital short femur. Standing alignment film demonstrates genu valgum and shortened femur. B: AP radiograph of the knee demonstrates lateral femoral condyle hypoplasia, lateral subluxation of the patella, and hypoplasia femoral intercondylar notch and of the tibial spine consistent with cruciate deficiency. C: AP radiograph of the ankles demonstrates a ball-andsocket ankle. |
Localized neurological syndromes can cause anatomic limblength discrepancies. Hemiplegic cerebral palsy (34, 35), polio (36, 37), and other neurologic abnormalities (38) can cause decreased growth of affected limbs (Fig. 28-7). These patients can also have apparent shortening due to concomitant knee and hip contractures and need to be factored in when considering the functional discrepancy. Other nonneurologic causes of apparent shortening include the child with dislocated hip, who may present with apparent shortening without a true leg-length discrepancy.
Etiologies Leading to Abnormally Lengthened Limb.
Some of the same factors that can cause shortening of a limb may also cause overgrowth of a limb. In general, it is thought that situations causing increased blood flow to a limb
either transiently or permanently may cause overgrowth of the extremity. Examples of transient increased circulation would be that of posttraumatic or postinfectious overgrowth of the femur and or tibia. Examples of more permanent increases in blood flow would be inflammatory arthritis and arteriovenous malformations (39, 40) that can be seen in Klippel-Trenaunay syndrome (41, 42).
either transiently or permanently may cause overgrowth of the extremity. Examples of transient increased circulation would be that of posttraumatic or postinfectious overgrowth of the femur and or tibia. Examples of more permanent increases in blood flow would be inflammatory arthritis and arteriovenous malformations (39, 40) that can be seen in Klippel-Trenaunay syndrome (41, 42).
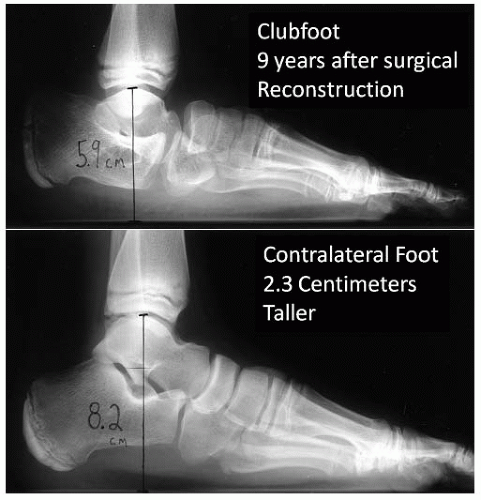 FIGURE 28-5. A 10-year-old boy has a 2.3 cm discrepancy as a result of decreased foot height from the surgical management of idiopathic clubfoot. |
Posttraumatic overgrowth typically occurs following a femur fracture but may also occur after an isolated tibia fracture or a combination of the two (43, 44) (Fig. 28-8). This is more likely to occur in proximal third and middle third femur fractures (45). The most common ages at which this occurs seem to be between 4 and 7 years of age (46, 47), and average overgrowth of the femur has been found to range from 7 to 10 mm (48). While the majority of overgrowth is felt to occur within the first 2 years (44), the clinician should follow these patients periodically until skeletal maturity to ensure similar leg lengths at skeletal maturity. In addition to trauma, increased blood flow from inflammatory conditions can stimulate growth. Examples where growth is stimulated via inflammation near the physis include osteomyelitis or chronic inflammatory arthritis (rheumatoid, psoriatic, or lupus arthrosis etc.) (49, 50 and 51).
Several syndromes such as Proteus syndrome (53), Macrodactyly, Parke Webber (54), and Klippel-Trenaunay-Weber syndromes (41, 42, 55) have limb-length discrepancy due to generalized overgrowth of one of the limbs and may be accompanied by vascular malformationst. In general, these patients fit within the category of hemihypertrophy, and the discrepancy may be a result of various neurocutaneous disorders that are known to be associated with overgrowth. For instance, neurofibromatosis type 1 (NF-1) (which can also be associated with shortening in congenital pseudarthrosis of the tibia) can present with hemihypertrophy (52). Cutaneous signs of NF-1 include café au lait spots, axillary and inguinal freckling, and cutaneous neurofibroma.
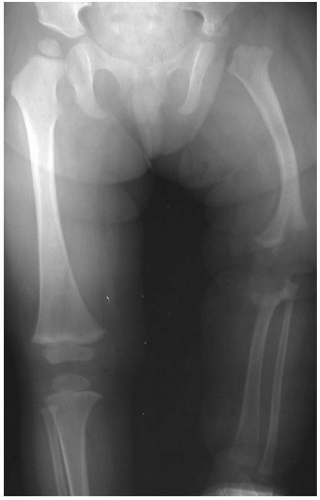 FIGURE 28-6. A 2-year-old girl with a history of multiple joint neonatal sepsis and limb-length discrepancy as a result of physeal destruction and joint dislocations. |
When no apparent systemic disorder is present and the child has apparent idiopathic hemihypertrophy, the treating physician must recognize the possibility of Beckwith-Wiedemann syndrome (56, 57). This disorder is characterized by major criteria (macroglossia, overgrowth abnormalities, and anterior chest wall defects) and minor criteria (ear creases, flame-shaped facial nevi, kidney enlargement, hypoglycemia, and hemihypertrophy) (58). These children are at increased risk for developing intraabdominal tumors such as Wilms tumors, adrenal carcinomas, and hepatoblastomas (59). Because of this risk, regular screening with abdominal ultrasounds is
recommended every 6 months for the first 8 years of life. Input from pediatric genetic specialists can be invaluable in evaluating all these hemihypertrophy patients when a diagnosis is not clear.
recommended every 6 months for the first 8 years of life. Input from pediatric genetic specialists can be invaluable in evaluating all these hemihypertrophy patients when a diagnosis is not clear.
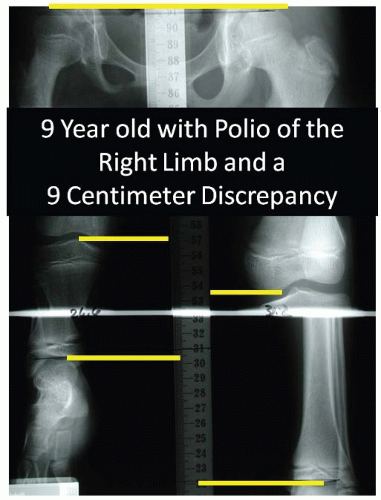 FIGURE 28-7. A 9-year-old girl with infantile polio and a completely flaccid right lower extremity has a 9-cm limb-length discrepancy. |
PATIENT EVALUATION
The parents of a child with limb-length discrepancy may present with concerns referable to a painless limp, pelvic obliquity, and differences in knee height, limb size and shoe sizes. It is important to study the past history of trauma, infection, neurologic conditions, abnormal skin pigmentations, or cutaneous vascular abnormalities. The orthopaedic physical exam is paramount in understanding a limb-length discrepancy. Each patient’s height and weight are recorded on the growth chart and parental heights are noted.
The general physical examination is important and will become more focused based on findings and clues toward the etiology are noted. Patients with questionable syndromes should be examined in shorts and with appropriate covering to evaluate for spinal deformity, pelvic obliquity, signs of spinal dysraphism, and hemiatrophy. In the seated position, the clinician should evaluate for any abnormal skin markings such as hemangiomas, axillary freckling, or café au lait spots. Hands can be inspected for differences in size and lower limb hemihypertrophy (Fig. 28-9) can be documented with the “thigh-leg” technique by measuring the foot length, calf, and thigh circumference at set distances above and below the knee in the supine and prone positions (60). In congenital limb-length discrepancies, deficient thigh and gluteal musculature can lead to spuriously larger appearing discrepancies. With the patient in the supine position, the abdomen should be palpated to feel for any intra-abdominal mass such as a Wilms tumor that can be related to Beckwith-Wiedemann syndrome. Examination of gait may suggest underlying neurologic conditions; spasticity (noted by a crouched gait, decreased knee extension, equinus, and raising of one arm) or weakness (Trendelenburg gait) may be uncovered. Functional compensation can be detected in gait and include hip and knee flexion and circumduction of the long limb. On the short side, the patient may exhibit an equinus contracture at the ankle and vaulting over the long limb. Vaulting is typically recognized as the patient’s center of gravity is thrust up and down. Upper extremity range of motion and muscle tone should be assessed in order to detect an underlying neurologic disorder.
In the standing position, the level of the popliteal crease, iliac crest, and shoulders is noted and overall coronal and sagittal alignment of the spine and lower extremities is assessed. The clinician must be sure the patient has his or her knees in extension and feet flat on the ground. An Adams forward bend test should be performed to look for occult scoliosis. A fixed pelvic obliquity due to a spine deformity may be the underlying cause of an apparent leg-length discrepancy. Placing their hands on the patient’s iliac crest will allow the examiner to observe any difference in height of the posterior superior iliac spines and then by using graduated blocks one can equalize the pelvis estimating the discrepancy. (Fig. 28-10). This indirect method of measuring leg lengths has been shown to be accurate within ˜1.5 cm of actual lengths (61—64). Pelvic asymmetry may occur in up to 5% of the normal population and give rise to some inaccuracy (65). In addition, this method may be more unreliable in the overweight child.
Patients with nonsyndrome causes will undergo exam of the affected limb in comparison to the contralateral limb. Examination of the foot for any signs of deformity should be mandatory; the deformity should be evaluated and may be a sign of fibular hemimelia. Hip, knee, and ankle instability should be documented and may suggest congenital short femur (hip and knee instability) which is crucial to consider when planning limb lengthening. Care is needed to document joint motion, muscle girth, and neurovascular function. While supine, a detailed range of motion of the hip, knee, and ankle should be assessed for any contractures. Hip adduction contractures produce a functionally shortened limb while abduction contractures produce a functionally long limb; these can thus produce an infrapelvic obliquity (66, 67 and 68).
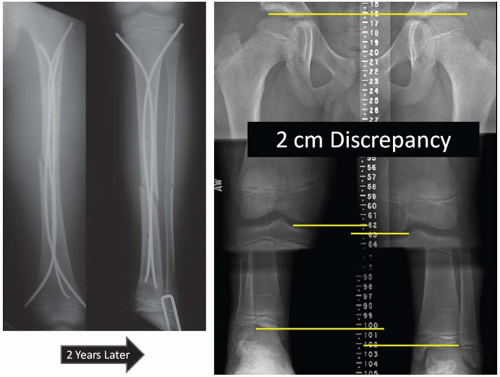 FIGURE 28-8. Two centimeters of limb overgrowth is present 2 years after surgical management of an ipsilateral femoral shaft and tibia fracture. |
In the supine position, the true and apparent leg lengths can be measured using a tape measure. The apparent leg length is measured from umbilicus to medial malleolus. The true leg length is measured from the anterior superior iliac spine to the medial or lateral malleolus (60, 61, 64, 69, 70, 71 and 72) (Fig. 28-1). The knees and hips can be flexed 90 degrees and any difference in knee heights recorded (Galeazzi sign) will suggest pathology in the femoral segment (hip joint to knee joint). Similarly, with the patient prone, differences in the height of the heel pad can be recorded demonstrating likely pathology between the distal femur and the foot. As tape measurements and block measurements are prone to error, the clinician should use them together to screen for a true leg-length discrepancy and should confirm their findings with radiography. While the imaging modalities have been shown to be more accurate than clinical screening methods, clinically measured leg-length differences correlated better with patient’s perceived inequality than did imaging (73).
In addition to an orthopaedic examination, an accurate assessment of maturity should be made. While seldom done in the orthopaedic clinic, a full Tanner staging can be useful to determine an adolescent’s maturity. For review, the Tanner stage relies on the development of secondary sex characteristics to determine maturity.
RADIOGRAPHIC ASSESSMENT
Several different radiographic methods are available to quantitate a leg-length discrepancy, and each has its benefits and weaknesses. Factors that affect which study to order include the estimated discrepancy, the location of the discrepancy, and the age of the patient. For instance, in children under 2 years of age who are initially presenting with a leg discrepancy, the authors prefer to obtain a standing radiograph of the entire lower extremity. Although this radiograph does not allow the highest accuracy in measuring the discrepancy, it is a simple method that requires only one exposure of a potentially fidgety child. In addition, it provides an evaluation of alignment and lets the clinician see all the bones in the legs.
After the patient grows to the age whereby a more sophisticated study can be reliably performed, this same technique should be employed throughout the child’s course so that differences are consistent. Similarly, the clinician should personally measure all his or her own films using consistent landmarks (top of femoral head, medial femoral condyle, center of the ankle joint) to ensure as much consistency as possible. Radiographic measurements should correlate with the clinical exam findings and when discordance is present, the cause of an apparent leg-length discrepancy should be sought. A classic
example is the patient with a concurrent hip or knee flexion contracture; thus the length of the bones may be best assessed with separate lateral films of the tibia and femur or advanced measurement techniques such as CT scanogram (Fig. 28-11). Available in many centers, Computer Scanogram has several benefits; it is quick, associated with decreased radiation (74—76) and easily accommodates contractures (77) and external fixators. Even though many clinicians do not have a CT scanner immediately at their disposal in the clinical setting and other reliable methods exist, CT scanograms have been shown in some of these cases to be more accurate than standard radiographic measurements below.
example is the patient with a concurrent hip or knee flexion contracture; thus the length of the bones may be best assessed with separate lateral films of the tibia and femur or advanced measurement techniques such as CT scanogram (Fig. 28-11). Available in many centers, Computer Scanogram has several benefits; it is quick, associated with decreased radiation (74—76) and easily accommodates contractures (77) and external fixators. Even though many clinicians do not have a CT scanner immediately at their disposal in the clinical setting and other reliable methods exist, CT scanograms have been shown in some of these cases to be more accurate than standard radiographic measurements below.
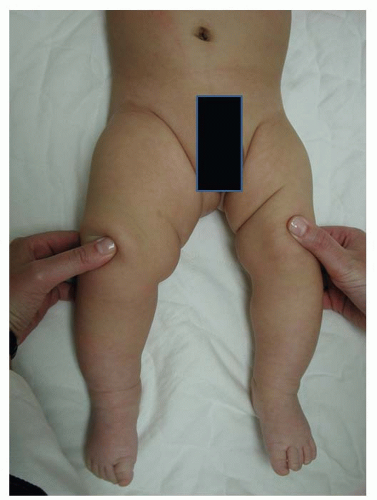 FIGURE 28-9. Clinical picture is presented of a 10-month-old infant with apparent hemihypertrophy. Although he does not have other signs of Beckwith-Wiedemann syndrome, routine abdominal ultrasounds are needed to detect abdominal tumors. |
Teleoroentgenography consists of standing alignment film (35 cm × 90 cm) taken with a single exposure at a distance of 2 m centered on the knee joint; a radiopaque ruler will allow one to measure the differences in length (Fig. 28-12). It is perhaps the best radiographic assessment in the young where scanograms are difficult to obtain and where full visualization of the skeleton can assist in diagnosis. Its benefit is that it is a quick single x-ray and it can give information about limb alignment and limb length. Unfortunately, one must account for magnification as parallax becomes an issue. In the past, the storage of these large films was more cumbersome, but with widespread use of digital radiography, this is less of an issue and some programs can assess length without the radiographic ruler. For individuals who cannot stand well, there is no significant difference in length measurements when this technique is performed in the supine position (78).
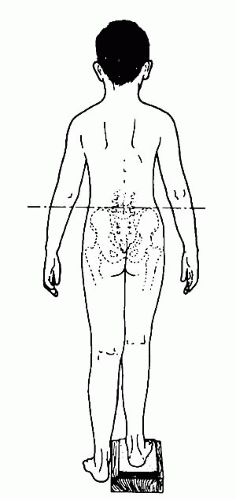 FIGURE 28-10. Placing blocks beneath the heel of the short leg allows assessment of the combined effect of all factors that produce functional leg-length discrepancy. |
Recently, several authors have recommended these radiographs (especially the computer variants of this technique) to be the primary imaging tool to be used to diagnose and monitor leg-length discrepancies as the technique is relatively inexpensive, involves less radiation, is widely available, shows angular deformities, and can show asymmetries in the foot and pelvis (79—82) Recently, Sabharwal compared the use of the scanogram and digital teleoroentgenogram (with a 5% magnification factor). The mean differences between the two techniques were 0.5 cm and they had a correlation coefficient of 0.96. The authors endorsed the use of the single x-ray as this gave important information as to mechanical axis deviations not seen on a scanogram, and this limited the patient to a single radiation exposure. This is in agreement with the findings of others (78).
Orthoroentgenography consists of three separate exposures at the hip, knee, and ankle all placed on the same longstanding film with ruler centered over each joint (Fig. 28-13). This technique eliminates the magnification error as the x-ray source moves to the center over each joint (83). It can be adapted to show angular deformities, but throughout all exposures the patient must remain still and thus makes it a challenge for smaller children.
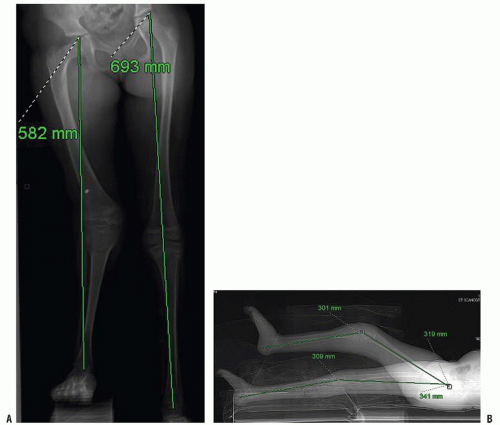 FIGURE 28-11. A: Standing alignment film of an 11-year-old girl with arthrogryposis demonstrates a functional discrepancy in length approximating 9 cm. Unfortunately, her severe knee flexion contracture precludes accurate assessment of her anatomic bone lengths. B: Lateral CT scanogram demonstrates that her femur is not significantly shortened (2 cm) and her tibia are essentially equal. |
Slit scanography or scanograms are performed so that the x-ray source and the film are both adjusted to reduce parallax error and all three joints are placed on one smaller film. Similar to the orthoroentgenography, the patient must remain still as the film and x-ray source move (84) (Fig. 28-14). Both indirect and direct slit scanograms have been described. Indirect scanograms utilize a midline ruler between the extremities from which measurements are made; a direct scanogram places the ruler along the mechanical axis of the limb. The direct method has been shown to be more reproducible than the indirect (63). With today’s computer imaging software, one can rapidly determine the differences in the absolute length between certain bones, thus improving clinical efficiency by avoiding marking, measuring, and calculating differences.
Other imaging technologies have been described to decrease radiation exposure; however, most of these are not readily available to the practicing orthopaedic surgeon. Microdose radiography involves an x-ray source and computer detection system which yields data in about 20 seconds. The advantage of this system is its accuracy and the significantly less radiation exposure than in conventional radiographs. However, the widespread availability of the technology is limited (74). As another method, ultrasound has been used to measure leg-length discrepancies and has found to be slightly less accurate than x-rays (72) but eliminates all radiation. Finally, MRI has been used to assess lengths and despite the elimination of radiation, the cost, the length of procedure, and less accuracy have prevented its widespread use (85).
MATURITY ASSESSMENT
Assessment of maturity is another important factor in treating a patient with a leg-length discrepancy. Unfortunately, chronologic age is only a rough estimate of maturity, and as orthopaedists, we are interested in skeletal or physiologic maturity as it relates to growth. While a detailed developmental history (menarche, shaving, and secondary sexual characteristics) can give a general idea of maturity, several imaging techniques
are often used to more accurately evaluate a child’s skeletal maturity. Up to 50% of children were found to have a skeletal age that differed from their chronologic age by >6 months (86).
are often used to more accurately evaluate a child’s skeletal maturity. Up to 50% of children were found to have a skeletal age that differed from their chronologic age by >6 months (86).
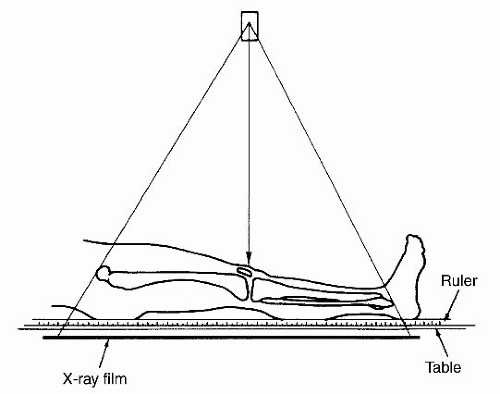 FIGURE 28-12. The teleoroentgenogram reveals angular deformities but is subject to errors of magnification. It is best for children who cannot remain still or as an initial test to locate deformity as well as length discrepancy. |
Methods for measuring maturity based on the appearance of various ossification centers in various populations of “normal” pediatric patients have been published. Findings at the foot (Hoerr), knee (Pyle and Hoerr), pelvis (Acheson), and upper extremity have all been used. The most widely used method of assessing skeletal maturity is using the bone age, as described by Greulich and Pyle (87). These authors studied the ossification centers of the left hand in a number of healthy normal children at different ages. As the ossification centers appear and coalesce in a reasonably predictable fashion, they were able to develop a norm for each age. When a child has a bone age x-ray, the clinician or radiologist can compare this child’s x-ray with those in the atlas and develop a bone age with a given standard deviation. While helpful, it does have significant deficiencies including gaps as far as 14 months, thus giving a rather large standard error. While the average or mean radiograph would likely be chosen for a given skeletal age (placing half the children as more mature and half the children as less mature), the developers chose some of the standards based on what they subjectively felt were most representative of that age. Furthermore, while a general order of ossification occurs in the bones of the hand and wrist, variations do occur; therefore arbitrary choices in age must be made.
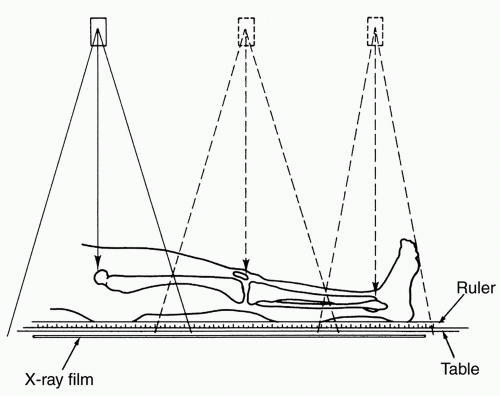 FIGURE 28-13. The orthoradiograph technique exposes each joint individually, thereby ensuring that the x-ray beam through each joint is perpendicular to the x-ray film and thereby avoiding errors of magnification. |
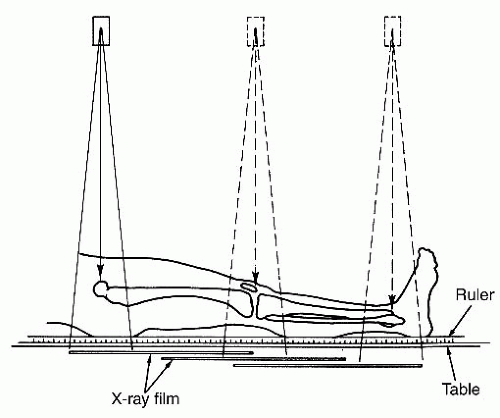 FIGURE 28-14. The scanogram technique avoids magnification error in the same manner as the orthoroentgenogram does and has the advantage of being on a smaller image. It is also useful for children who can be counted on to remain still. |
Despite the above limitations, the most common technique used in determining skeletal maturity is the Greulich and Pyle technique that is based on standard radiographs, now over 50 years old, from affluent white children. The applicability of these “standards” to other ethnicities and to modern-day children has been questioned. Recent studies have shown children to achieve an older bone age for a given chronological age today versus 25 years ago (88). Similarly, bone ages of Asian and Hispanic children tend to be overestimated using the Greulich and Pyle technique. They appear to mature sooner than the Caucasian and African American children (89). Recent advances have used computer-based systems to score the x-rays and determine the skeletal age (90, 91 and 92). One of these systems has involved the recent acquisition of an atlas of 1,400 children from four different ethnicities to attempt to limit any ethnic bias from the standards (89). Preliminary results appear promising
using these techniques as they are able to eliminate reader variability and bias.
using these techniques as they are able to eliminate reader variability and bias.
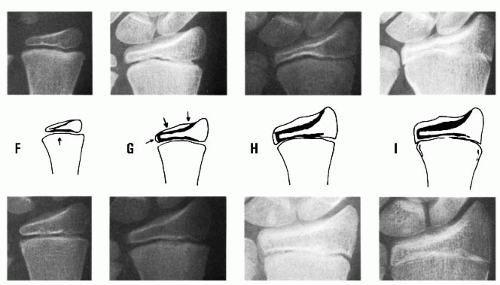 FIGURE 28-15. The Tanner-Whitehouse atlas provides standards for 20 different landmarks of the hand and wrist and allows determination of the skeletal age. (From Tanner J, Whitehouse R, Marshall W, et al. Assessment of skeletal maturity and prediction of adult height (TW2 method), London, UK: Academic Press, 1975.) |
Similar to the Greulich and Pyle method, the Tanner-Whitehouse method (93) relies on the ossification centers of the hand and wrist (RUS-radius ulna and small bones) to determine maturity, but relies on computerized mathematical procedures to evaluate the successive stages of 20 bony landmarks of the bone and wrist. The radiograph is compared to standard radiographs, and each of the 20 landmarks is designated a letter score. A numeric score is derived from this letter score after gender is taken into account. The result is a skeletal or bone age with a much smaller standard error. This method relies on the cuboid and long bones of the hand. If a discrepancy in age between these two types of bones exists, it may be reasonable to assume those measures of the long bones to be more directly relevant to the maturity and growth of the long bones of the lower extremity, but this is only speculative (Fig. 28-15).
Dimeglio (94) has shown accuracy in using a modification of the Sauvegrain method of bone age especially in the prepubertal and pubertal children. This is beneficial as it is in this age group (9 to 15 years old) that the Greulich and Pyle atlas lacks norms at regular intervals. This French method looks at the four different ossification centers about the elbow and develops a maximum 27-point score for males and females. The score is then plotted on a graph and the appropriate bone age (at 6-month intervals) can be determined. This method has been shown to be very reproducible and is ideal for children in this age group. Before the age of 9 in females and 11 in males, this method cannot be used.
OTHER DIAGNOSTIC STUDIES
When evaluating the limb-length discrepancy and based on the likely etiology, other imaging studies may be required. As previously stated, patients with apparent idiopathic hemihypertrophy require interval screening (every 6 months of age up until age 8 years) via abdominal ultrasound to rule out a Wilms
tumor or other abdominal masses that would be consistent with Beckwith-Wiedemann syndrome. When evaluating a growth plate injury from a traumatic, infectious, or neoplastic cause, a CT scan or MRI of the affected growth plate may be essential to evaluate for any potential for bar excision (95, 96). Similarly, an MRI may be advantageous in evaluating the presence of anatomic structures (ACL) in a patient with a congenital short femur or in evaluating the location of an arteriovenous malformation prior to surgical intervention.
GROWTH PATTERNS
In order to predict the ultimate discrepancy, one needs to consider the patient’s growth potential and whether future growth could be retarded or accelerated. For instance, one would expect a 3-cm discrepancy from a femur shaft malunion in a 12-year-old boy to remain stable as the growth plate is unaffected and the patient is unlikely to recoup the distance with regrowth. In contrast, a Salter Harris type I distal femur fracture with complete growth arrest will continue to worsen until skeletal maturity. In congenital limb differences, the ratio of the short limb to the long limb has been shown to be constant (97). Clinically, these limbs will stay proportionately the same, but the absolute difference in length will increase (98). Some generalities can be made about the existing congenital deformity according to the patient age. For instance at birth, the ultimate discrepancy will be 5 times the difference at birth, 3 times the difference at 1 year of age, and 1.5 times the difference at 7 years of age (4). Some developmental discrepancies (polio, Ollier disease, growth arrest) have been shown to have a rate of inhibition that is also fixed.
Shapiro (99) described five patterns of growth inhibition (Fig. 28-16). Constant inhibition was only one pattern of growth inhibition recognized. While five patterns were recognized, a given diagnosis may exhibit more than one pattern of inhibition. Unfortunately, these patterns of inhibition are difficult to use clinically. Even so, one may wish to keep these patterns in mind
when planning an equalization procedure as this may cause a deviation from the prediction models described below.
when planning an equalization procedure as this may cause a deviation from the prediction models described below.
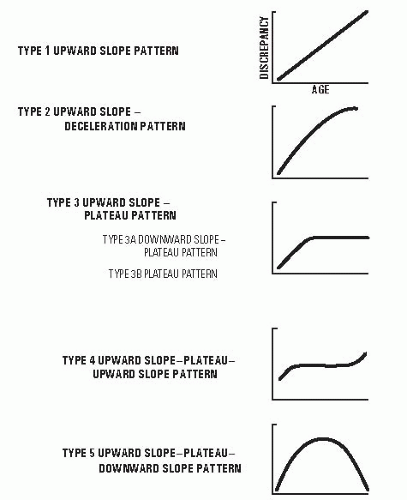 FIGURE 28-16. Different patterns of growth retardation are demonstrated here. (From Shapiro F. Developmental patterns in lower extremity length discrepancies. J Bone Joint Surg Am 1982;64(5):639-651.) |
PREDICTIONS OF GROWTH AND ULTIMATE DISCREPANCY
The most important question that drives prognosis and treatment is “what will be the final limb-length discrepancy, and how and when are we going to equalize them?” Multiple methods have been developed to try to predict final discrepancies and thus guide treatment to allow equal leg lengths at skeletal maturity. From the previous sections, it becomes obvious that accurate knowledge of both the discrepancy and maturity is essential in answering these questions. Essentially, most methods to predict final discrepancies and time treatment rely heavily on the ground-breaking work of Green and Anderson, and each attempts to use this data in different ways (mathematically and graphically). Several generalizations can be made regardless of the technique used. Multiple data points (of discrepancy and skeletal age) over time help make more accurate predictions, and greater accuracy exists in predicting final limb difference as the child gets older (children >10 years of age).
Green and Anderson Growth Remaining Model.
Green and Anderson used longitudinal data on the growth of the lower extremities to predict the amount of growth remaining in the distal femur and proximal knee. Initially, semilongitudinal data on over 800 individuals were used to construct a growth remaining chart in 1947 (7). In 1963, a pure longitudinal cohort consisting of 50 males and 50 females was followed yearly to refine the growth remaining chart and a nomogram of femur and tibia lengths. The later prospective cohort provided more accurate standard deviations over time and used skeletal age using Greulich and Pyle bone age. By plotting the skeletal age of the child, the amount of growth remaining in each bone could be read from the chart and allowed the prediction of the outcome of epiphysiodesis within two standard deviations. The growth remaining graph did not take into account the differences in the size of stature or inhibition which might lead to differences from those predicted.
Green and Anderson constructed another graph looking at the yearly growth of the tibia and femur in 67 males and 67 females from ages 1 to 18 years of age. This again was a completely longitudinal study based on chronologic age and average tibia and femur lengths (5). From this data, a nomogram was again constructed in which a patient’s leg lengths could be plotted. From multiple measurements, percentile growth of the individual could be seen on the “normal leg” and inhibition of the short leg could be observed. They felt this helped with the growth remaining curve to determine whether a patient might be on the high or low side of the average growth remaining (i.e., a patient whose tibia and femur were two standard deviations from the norm might have a greater growth remaining and thus a greater inhibition after epiphysiodesis than someone two standard deviations below the mean). They stressed the importance of obtaining several measurements to get a sense on the pattern of the growth rate abnormality, especially in the 2 to 3 years before a planned procedure as this rate may change over time. When using the chronologic graphs, they stressed the importance of taking maturity into account. Multiple measurements and the patient’s overall growth chart percentiles can be useful in identifying discrepancies in maturity between skeletal and chronologic ages on these graphs. A patient consistently in the 80% percentile for height for age should similarly fall in near the second standard deviation for tibia and femoral length; if they suddenly drop in percentile this may mean they are either delayed in their maturation or were previously precocious. Knowledge of this will be useful in altering final predictions and might lead a clinician to use skeletal age rather than chronologic age. This method has been used for years and has been found to be accurate (100) at predicting the timing of epiphysiodesis (Figs. 28-17, 28-18, 28-19 and 28-20).
Moseley Straight-Line Graph Method.
In an effort to simplify and improve the accuracy of the Green and Anderson method, Moseley developed a nomogram for skeletal age derived from Green and Anderson data to correct for percentile growth (variations in maturity and relative size) (101, 102). On this graph, the growth of each limb is
recorded as a straight line. The effects of epiphysiodesis can be determined by using any one of three (proximal tibia, distal femur, both) reference lines so that equivalent leg lengths are achieved at maturity. To utilize this chart, the length of the NORMAL leg is plotted on the given normative line. A vertical line is then drawn and the intersection of the reference skeletal age (determined from Greulich and Pyle measures) is recorded. The length of the ABNORMAL leg is then plotted on this same vertical line. The process is then repeated for at least three measurements. Best fit lines are then drawn on the skeletal nomogram and the ABNORMAL limb. A vertical line is drawn from the intersection of the skeletal age nomogram at maturity. The distance between these lines at maturity is the predicted discrepancy. Using the reference slopes for epiphysiodesis, one can determine when different combinations of epiphysiodesis could be performed to allow ultimate correction (Figs. 28-21 and 28-22).
recorded as a straight line. The effects of epiphysiodesis can be determined by using any one of three (proximal tibia, distal femur, both) reference lines so that equivalent leg lengths are achieved at maturity. To utilize this chart, the length of the NORMAL leg is plotted on the given normative line. A vertical line is then drawn and the intersection of the reference skeletal age (determined from Greulich and Pyle measures) is recorded. The length of the ABNORMAL leg is then plotted on this same vertical line. The process is then repeated for at least three measurements. Best fit lines are then drawn on the skeletal nomogram and the ABNORMAL limb. A vertical line is drawn from the intersection of the skeletal age nomogram at maturity. The distance between these lines at maturity is the predicted discrepancy. Using the reference slopes for epiphysiodesis, one can determine when different combinations of epiphysiodesis could be performed to allow ultimate correction (Figs. 28-21 and 28-22).
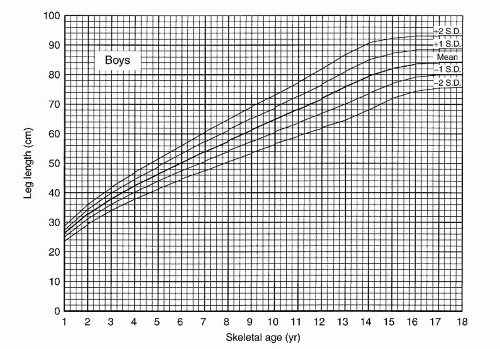 FIGURE 28-17. Graph showing total leg length versus skeletal age for boys allows a specific boy to be related to the population by plotting his leg length as a function of his skeletal age. It is useful in the analysis of leg-length data because it allows a projection into the future on the basis of the present situation. (From Anderson M, Green WT. Lengths of the femur and tibia; norms derived from orthoroentgenograms of children from five years of age until epiphyseal closure. Am J Dis Child 1948;75:279-290.) |
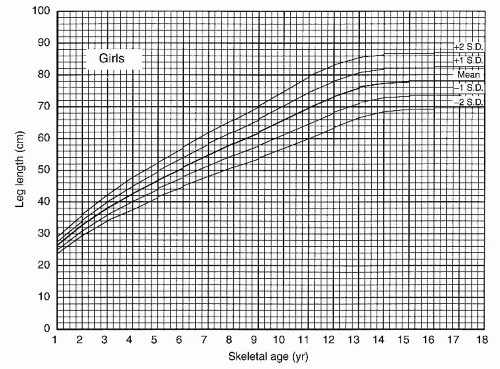 FIGURE 28-18. Graph showing total leg length versus skeletal age for girls serves the same purpose for girls that Figure 28-17 serves for boys. (From Anderson M, Green WT. Lengths of the femur and tibia; norms derived from orthoroentgenograms of children from five years of age until epiphyseal closure. Am J Dis Child 1948;75:279-290.) |
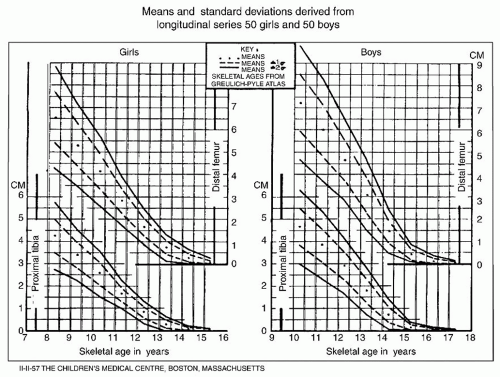 FIGURE 28-19. Green and Anderson growth-remaining graph. This graph shows the amount of growth potential remaining in the growth plates of the distal femur and the proximal tibia of boys and girls as functions of skeletal age. The graph is useful in determining the amount of shortening that will result from epiphysiodesis. (From Anderson M, Messner M, Green W. Distribution of lengths of the normal femur and tibia in children from one to eighteen years of age. J Bone Joint Surg Am 1964; 46-A(6):1197-1202.) |
This method remains very useful in predicting final limb length with a mean error of 0.6 cm using this technique (76, 101). After surgical intervention, typically epiphysiodesis or lengthening, the leg-length discrepancy can continue to be monitored on the same graph to see if further interventions will be needed. Recently, this graph has been updated to include more modern growth data, and the originators claim it is more accurate than the original Moseley straight-line graph (103). The authors do not have experience with this graph.
Menelaus/White—Arithmetic Model.
The arithmetic model was first proposed by White (104) and is useful when only one data point exists for the prediction of ultimate discrepancy. It was developed to help predict the timing of epiphysiodesis and not to describe growth. He suggested the distal femur grew 3/8 in. (10 mm) per year and proximal tibia grew 1/4 in. (6 mm) per year and the discrepancy increases by 1/8 in. (3 mm) per year. This equated to 37% of total limb growth at the distal femur and 28% of total limb growth at the proximal tibia. White assumed boys stopped growing at 17 years and girls at 16 years. Menelaus later adjusted the age of growth cessation to be 16 years for boys and 14 years for girls. While calendar age was used in developing this method, Menelaus suggested it only be used when skeletal and chronologic age are within 1 year off each other and clinical used leg-length differences as determined by blocks and not radiographic length
measurements. This method is best suited for those patients during the last few years of growth whose skeletal age correlates well with their chronologic age. The results of this technique for timing epiphysiodesis have found that 80% of patients were within a ½ in. when compared with the 90% obtained by using the Green and Anderson technique (105, 106) (Fig. 28-23).
measurements. This method is best suited for those patients during the last few years of growth whose skeletal age correlates well with their chronologic age. The results of this technique for timing epiphysiodesis have found that 80% of patients were within a ½ in. when compared with the 90% obtained by using the Green and Anderson technique (105, 106) (Fig. 28-23).
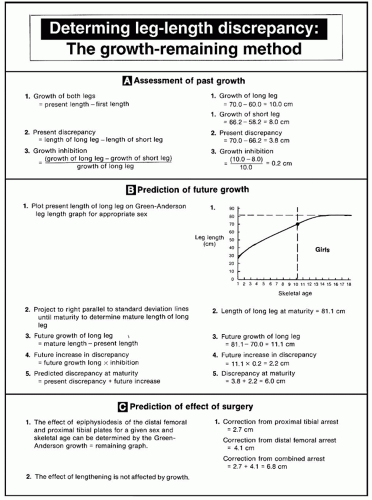 FIGURE 28-20. Step-by-step instructions for the use of the growth-remaining method. |
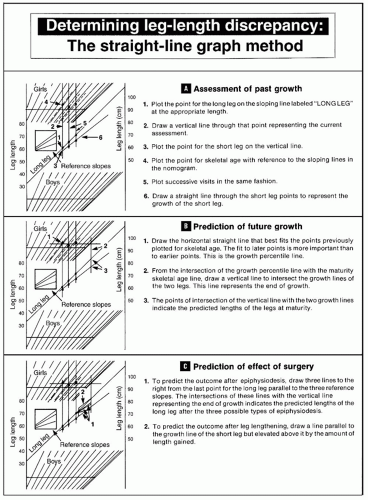 FIGURE 28-21. Step-by-step instructions for use of the straight-line graph method. |
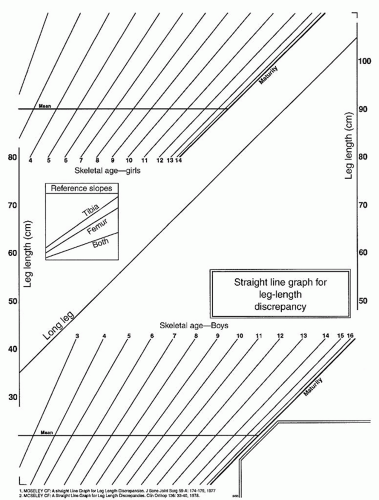 FIGURE 28-22. The straight-line graph comprises three parts: the leg-length area with the predefined line for the growth of the long leg, the areas of sloping lines for plotting skeletal ages, and reference slopes to predict growth following epiphysiodesis. |
Dimeglio Method.
This method is similar to the White and Menelaus method; however, different assumptions are made regarding the growth and skeletal age. Dimeglio calculates the growth at the knee to be 2 cm per year (1.1 cm at the femur and 0.9 cm at the tibia) at the onset of puberty (bone age of 11 years in girls and 13 years in boys); in this model, growth ceases at bone age of 13.5 years in girls and 15.5 years in boys. Based upon this, four common scenarios are generated for each discrepancy and timing of epiphysiodesis. To treat a 5-cm discrepancy, epiphysiodesis of the distal femur and proximal tibia should be performed at the onset of puberty. For a 4-cm discrepancy, epiphysiodesis of the femur and tibia is performed 6 months after the onset
of puberty. For a 3-cm discrepancy, epiphysiodesis of the femur alone is recommended at the onset of puberty. For a 2-cm discrepancy, epiphysiodesis of the femur only is recommended 1 year after the onset of puberty. This strategy can be adapted to individual cases but stresses the importance of making treatment decisions at the onset of puberty and detecting this through Tanner staging (stage 2) and skeletal age (11 years in girls and 13 in boys). In this age group, hand and elbow radiographs were found to be effective in determining bone age (4, 107).
of puberty. For a 3-cm discrepancy, epiphysiodesis of the femur alone is recommended at the onset of puberty. For a 2-cm discrepancy, epiphysiodesis of the femur only is recommended 1 year after the onset of puberty. This strategy can be adapted to individual cases but stresses the importance of making treatment decisions at the onset of puberty and detecting this through Tanner staging (stage 2) and skeletal age (11 years in girls and 13 in boys). In this age group, hand and elbow radiographs were found to be effective in determining bone age (4, 107).
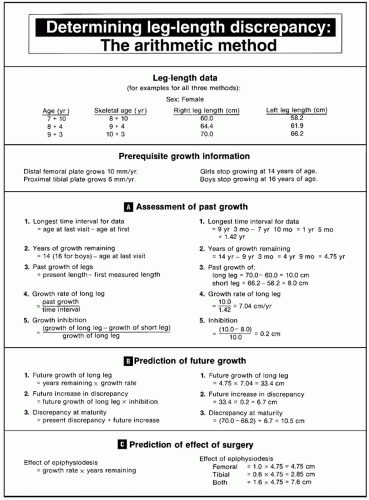 FIGURE 28-23. Step-by-step instructions for use of the arithmetic method. The method presented here is modified from that presented by Menelaus and Westh, in that the future increase in discrepancy is calculated from growth acquired in the past instead of being assumed to be 0.3175 cm per year of growth remaining. An example is shown in the panels in the right column. |
Multiplier Method.
In order to calculate the ultimate discrepancy, defined multipliers have been determined from previously published growth data. Tables of multipliers (for each age and gender) decrease with age and when multiplied by the existing deformity, an ultimate discrepancy can be predicted. Thus by using the multiplier, the current leg lengths, and knowledge of whether the discrepancy is congenital or developmental, the clinician can estimate leg-length discrepancies at maturity. For congenital discrepancies, the discrepancy at skeletal maturity is easy to calculate.
Discrepancy at maturity = (L — S) × M, where L and S are the long- and short-limb measurements and M is the age appropriate multiplier. As developmental discrepancies have a constant rate of inhibition, the clinician must be able to calculate the rate of inhibition and the amount of growth remaining in the long limb. Thus, Discrepancy at maturity = (L — S) + [1 — (S — S’)/(L — L’)] × L (M — 1), where S, L are the current lengths and S′, L′ are the lengths from 6 to 12 months ago. From these two calculations, affects and timing of epiphysiodesis can be estimated using similar appropriate formulae. This method has been found accurate (108—110), and the originators state that chronologic age is as accurate as bone age using this method (Table 28-1).
In summary and as stated previously, all of the above methods assume constant growth and constant inhibition. Despite the knowledge that several inhibition patterns do exist (99), these do not appear to be of real clinical importance in estimating ultimate leg lengths. Studies have not consistently shown that one method is superior over the others and that skeletal age does not necessarily improve estimation in final discrepancies. For example, Kasser et al. (I11) found a mean error of 2.4 cm using Anderson and Green data with chronologic age versus 2.6 cm using the straight-line graph with skeletal ages in children <10 years of age. The accuracy of the skeletal age determination has been brought into question. While no one technique is fail safe, the authors would recommend always utilizing at least two techniques when determining treatment. If there is a sizable discordance between these techniques, a third should be employed. Of course, this is not always possible; both the Moseley and Green and Anderson methods require using multiple data points. When a clinician encounters a patient for the first time near the epiphysiodesis date (10 to 14 years of age), a treatment decision based on elbow and hand radiographs may better help determine the true skeletal age.
TABLE 28-1 Multipliers | |||||||||||||||||||||||||||||||||||||||||||||||||||||||||||||||||||||||||||||||||||||||||||||||||||||||||
|---|---|---|---|---|---|---|---|---|---|---|---|---|---|---|---|---|---|---|---|---|---|---|---|---|---|---|---|---|---|---|---|---|---|---|---|---|---|---|---|---|---|---|---|---|---|---|---|---|---|---|---|---|---|---|---|---|---|---|---|---|---|---|---|---|---|---|---|---|---|---|---|---|---|---|---|---|---|---|---|---|---|---|---|---|---|---|---|---|---|---|---|---|---|---|---|---|---|---|---|---|---|---|---|---|---|
| |||||||||||||||||||||||||||||||||||||||||||||||||||||||||||||||||||||||||||||||||||||||||||||||||||||||||
NATURAL HISTORY OF LIMB-LENGTH DISCREPANCY
The natural history of limb-length discrepancy in adults is of major concern, yet unfortunately the data on this are lacking. To fully test the effect of limb-length discrepancy on a patient’s long-term function, one would need to study a cohort of affected individuals which could be compared to normal subjects. These groups would have to be large in order to control for genetic predisposition for arthritis, traumatic and lifestyle (obesity, smoking, exercise habits) factors, and other comorbid conditions that can affect the rates of limb arthrosis and back pain. In the growing years, the long-term effect of discrepancy is also not known. Therefore, it is helpful to consider the effects of limb-length discrepancy on the growing child in terms of mechanisms of compensation.
Mechanisms of Compensation.
The parents of patients with leg-length discrepancy worry about developing problems of the hip, knee, and the spine. It is important to counsel families that the data on long-term effects of discrepancy are unknown in adults, and no data demonstrate damage to the growing skeleton as a result of discrepancy. The child with a congenital leg-length discrepancy usually compensates better than adults who may have an acquired leg-length discrepancy. The movements about the lower limb joints with simulated and real leg-length discrepancies have been found to be essentially unchanged with small discrepancies (112).
Often times, a young child with a congenital discrepancy of 3 cm may not feel right with a shoe lift and prefer to go without it. Song et al. found that discrepancies >5.5% of the long extremity increased the mechanical work performed by the long limb and increased the vertical displacement of the center of body mass, with consequent energy penalty. Children with lesser discrepancies were able to normalize the work performed by the two extremities. These children compensate for minor degrees of leg-length discrepancy by walking on the toes of the short leg, with the heel rarely touching the ground. This can result in a smooth, symmetrical gait that shows no abnormality except for the lack of heel strike on the short side. Children who are older or who have a discrepancy of 4 to 5 cm may also compensate for the discrepancy by flexing the knee on the long side or more commonly vaulting over the long leg. This action produces excessive up-and-down motion of the pelvis and trunk.
Natural History in Adults.
It has been shown that discrepancies of <2 cm are of no functional or clinical consequence in adults and that these discrepancies do not require treatment (113). Despite evidence to suggest that discrepancies of <2.5 cm are not significant in the adult (114), postural sway has been shown to increase when simulated discrepancies are as small as 1 cm (115). Liu et al. (116) proposed the “symmetry index” (SI) as a measure of the quality of gait and found that correction of discrepancy by a heel lift considerably improves the SI.
It has been hypothesized that idiopathic arthritis of the hip in the elderly patient may actually be the result of some previously unrecognized mild dysplasia, slipping of the capital femoral epiphysis, or leg-length discrepancy. It is conceivable that pelvic obliquity from limb-length discrepancy would decrease the coverage of the hip of the long leg in two-legged stance and with greater discrepancy; a more significant decrease in the center-edge (CE) angle could be expected to result in arthritis (Fig. 28-24). Despite this theory, there is no documentation to prove this hypothesis, and such a study would be difficult to conduct as mentioned above. Leg-length discrepancy may increase the incidence of knee pain in athletes, although the nature of the relation has not been elucidated (117).
The effects of leg-length discrepancy on the spine are also not clearly established. Contradictory evidence exists about the possibility that leg-length discrepancy causes low back pain in the long term (118, 119 and 120). Low back pain is unusual in the younger child and is more common in the adolescent, but there is no evidence that low back pain and leg-length discrepancy are related in this age group. Froh et al. (121) studied whether leg-length discrepancy had any effect on the orientation of the facet joints in adults and found none, whereas Giles and Taylor (122) found changes in the facet joints of cadavers with leg-length discrepancy. It is not clear whether the incidence of back pain is higher in patients with leg-length discrepancy than it is in the general population.
Related posts:


Stay updated, free articles. Join our Telegram channel

Full access? Get Clinical Tree


