Abstract
Objective
The aim of this study is to determine the impact of electrical stimulation frequency on muscle force and fatigue and propose application modalities in regards to sports or clinical rehabilitation training.
Methods
The maximal voluntary contraction (MVC) force of the quadriceps femoris muscle was recorded before, during and after electrical stimulation in 26 healthy adults during 20-minute sessions corresponding to 60 of 5-second contractions separated by 15-second rest periods. Three different frequencies were used: 100, 50 and 20 Hz.
Results
With a frequency of 100 Hz, we obtained 71% of the MVC force at the beginning of the session (MVCb). The decrease in muscle force at the end of the session is significantly greater for the highest frequencies respectively 27, 33 and 38% of MVCb for 100, 50 and 20 Hz.
Conclusion
The impact of electrical stimulation to improve muscle force seems to be dependent on frequency, intensity pulse trains and number of contractions per session. Higher intensity and higher frequency induce stronger muscular contractions, but also a stronger decline in force and thus quick-setting muscle fatigue. Classical 20-minute training sessions with many contractions (60 or more) do not seem appropriate for sports training or clinical rehabilitation programs.
Résumé
Objectifs
L’objectif est de déterminer l’influence de la fréquence de stimulation électrique sur la force et la fatigue musculaire et de proposer des modalités d’application dans une optique d’entraînement sportif ou de rééducation.
Méthode
La force maximale volontaire et électro-induite isométrique du quadriceps fémoral de 26 sujets est mesurée avant, pendant et après une séance de stimulation électrique de 20 minutes, soit 60 contractions tétaniques de cinq secondes séparées de 15 secondes de repos. Trois fréquences de courant sont utilisées 100, 50 et 20 Hz.
Résultats
Une fréquence de 100 Hz permet d’obtenir 71 % de la force maximale volontaire de début de séance (FMVd). Le déclin de force en fin de séance est significativement plus important pour les fréquences les plus élevées respectivement 27, 33 et 38 % de FMVd pour 100, 50 et 20 Hz.
Conclusion
La fréquence et le nombre de contractions par séance conditionnent l’efficacité d’une stimulation électrique, visant à améliorer la force musculaire. L’influence de la fréquence des impulsions influe sur la fatigue musculaire. L’entraînement classique sous stimulation électrique d’une durée de 20 minutes avec de nombreuses contractions (60 ou plus) est à remettre en cause.
1
English version
1.1
Introduction
Starting in the 1960s, technological advances have widened the field of electrical stimulation (ES) to include various applications in Physical Medicine and Rehabilitation (PM&R) . ES is used in muscular training program, in order to improve skeletal muscle (voluntary muscle) force in healthy individuals or persons with muscular wasting or atrophy . Neuromuscular ES is used to apply high-intensity training exercises on stimulated muscles while not being limited by cardiovascular stress, which is the case in voluntary training exercises. Patients affected by Chronic Obstructive Pulmonary Disease (COPD) , heart disease or ischemic stroke can follow an ES muscle reconditioning program, in the best and safest conditions, without being submitted to general fatigue. Furthermore, repeated ES sessions can improve neuromuscular qualities in elderly individuals . To obtain a gain in muscular strength by ES, it is necessary to maintain a level of ES-induced activation of muscle force at more than 60% off the maximal muscle force (MVC) . However, the ES-induced muscle contractions can trigger an intense fatigue compared to voluntary contractions . The electrically elicited nerve conduction is synchronous . The increase of ES frequency leads to quick-setting muscle fatigue . The optimal ES frequency seems to be located between 80 and 100 Hz . Ferry and Poumarat showed that the optimal frequency depended on the type of muscle. A 60-Hz frequency yields better results on the triceps surae muscle containing mostly Type 1 muscle fibers.
Muscle fatigue is defined by a decline in muscle force linked to repeated muscular activation . The onset of this early fatigue tends to reduce the ES’s efficacy, particularly during maximal strength training .
To our knowledge, there are no studies that can be compared to this one; however, several authors focused on evaluating muscle force and fatigue in relation to ES frequency.
Edwards et al. showed that low-frequency fatigue (fatigue induced by frequency < 25 Hz) is characterized by a progressive decline in muscle force and a slow recovery. A frequency above 75 Hz can help reach a higher strength level, but triggers a quick-setting decline in muscle force coupled with a slow recovery. Cooper et al. reported that the correlation between decline in muscle force and decline in muscle excitability capacity was dependant on ES frequency. Benton et al. and Jones et al. demonstrated that fatigue progressed along with the increase in ES frequency. They showed that ES at a frequency below 40–50 Hz solicited more and more Type I, slow-twitch muscle fibers that are more resistant to muscle fatigue. Higher frequencies solicited more Type IIa and IIb fast-twitch muscle fibers that are easily fatigued. Kesar and Binder-Macleod reported that low-frequency ES (11 Hz) associated to long-pulse duration (PD) (600 μs) is less tiring for the muscles than medium frequency ES (30 Hz) coupled to medium-PD (150 μs) or high frequency SE (60 Hz) and short-PD (131 μs). However, the subjects were only asked to produce 20% of their MVC force that is far from the values usually set for strength training programs. Russ et al. showed that for gastrocnemius muscles the increase in frequency did not have any impact on muscle fatigue during a fatigue protocol that consisted in 150 pulse trains delivered to the rate of one train every 10 seconds for a PD varying between 300 to 1200 ms. Three frequencies were used 20 Hz, 40 Hz and 80 Hz. The intensity used allowed to produce 10% of MVC force during plantar flexion. Here also the force produced is not compatible with the one required for strength training. Another study showed that high-frequency ES elicits less fatigue than low-frequency ES during a repetitive stimulation protocol.
However, to our knowledge, no studies were conducted in order to evaluate the electrically induced muscle force and fatigue during a 20-minute repetitive ES protocol, with three different frequencies and force intensity levels that are compatible with a strength-training program. The 20-minute time period is the most commonly duration reported in ES training protocols.
1.2
Material and methods
Twenty-six healthy subjects, students at the Blaise-Pascal University of Clermont-Ferrand (mean age 23 ± 3 years, mean height 174 ± 10 cm, weight 71 ± 10 kg), free from any orthopedic, neurological or vascular pathology, participated to the three sessions proposed (three different stimulation frequencies). They were divided into three groups from 13 to 16 subjects. Most of these students practice some type of sports, either for leisure or at competition level, regional to national. After receiving complete and detailed information, we collected their signed consent form to participate in this non-invasive study, the recruitment was done on a voluntary basis, subjects could leave the study at any time. The procedure used is in concordance with the declaration of Helsinki, recommendation for conduct of clinical research. The subject is positioned sitting down on a chair in order to be able to evaluate the extension force of the leg on the thigh. The depth of the seat and the sensor’s position can be adapted to the subject’s morphology ( Fig. 1 ). The subject’s trunk is set at a 120° angle and leg flexion at 60°, corresponding to the position where maximal force can be obtained . The force sensor is strapped to the subject’s right ankle, perpendicular to the longitudinal axis of the leg. The pelvis is strapped to the chair by an adjustable abdominal belt, in order to prevent movement interferences.

We used a Data acquisition card (National Instruments DAQCard-AI-16E-) for the measurement chain in order to record muscle force at a continuous frequency of 50 Hz. Acquisition and study-specific data analysis software were developed in our laboratory (computing language Matlab ® ).
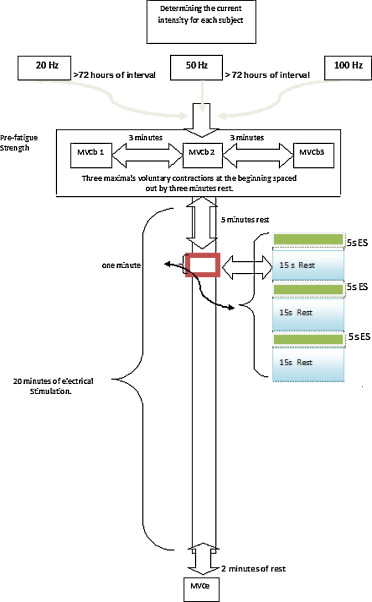
The subject can visualize on a screen, in real time, the representation of the force applied. A « Magic Form » ES apparatus delivers square wave biphasic electrical current, pulse length of 300 μs. The frequencies used are 100, 50 and 20 Hz. The intensity corresponds to the maximal tolerable intensity. We used four surface flexible polymer electrodes; three were positioned on the motor points of the vastus lateralis, vastus medialis muscles and right quadriceps femoris muscle , and the fourth one located right above the femoral nerve in the proximal thigh ( Fig. 1 ). Before each experimental session, the subject performed a specific three-minute warm-up session of the extensor muscles of the leg on the thigh (dynamic and isometric infra-maximal contractions), followed by a three-minute rest period. Each subject proceeded with the so-called beginning of the session maximal voluntary contraction force (MVCb). Three maximal voluntary isometric contractions, five-second duration, spaced out by three-minute rest periods were required. The mean of the three test sessions was noted as the reference MVCb value. A five-minute rest period was allocated before we started the ES session. Three 20-minute ES sessions were necessary for this study (60 ES-induced maximal contraction for a five-second duration separated by 15-second rest periods). These three sessions were spaced out every three days and administered in a random order, to avoid the ES training adaptation’s impact for subject who performed at least two sessions. The final maximal isometric voluntary contraction force (MVCf) was measured at the end each of the session after a two-minute recovery period ( Fig. 2 ). There was only one repeat test procedure. At this point, we considered that the subjects were familiar with the type of contractions needed for this study. However, this was not necessarily the case at the beginning of the session. Furthermore, the measures taken at a distance from the stimulation, due to the necessary rest period between each try-out session, made a repeat procedure non significant.
The forces elicited under ES are recorded for the 60 contractions needed. The values at the beginning (FESb) and end of the session (FESe) were noted. The values FESb, FESe, MVCf, as well as the forces produced for the 15th and 30th contraction (FES 15th, FES 30th) were expressed in percentage of MVCb.
1.3
Statistical analysis
One-way variance analysis ANOVA followed by Post-hoc analysis with Tukey’s test were used to compare the percentages of ES-induced maximal forces at the beginning of the session (FESb), ES-induced forces at the 15th contraction (FES 15th), ES-induced at the 30th contraction (FES 30th) and forces at the end of the session (FESe), to the MVCb (%FESb/MVCb; %FES15th/MVCb, FES30th/MVCb, %FESe/ MVCb, %MVCf/ MVCb).
1.4
Results
The contractions obtained, either ES-induced or voluntary, were tetany-type contractions ( Fig. 3 ).
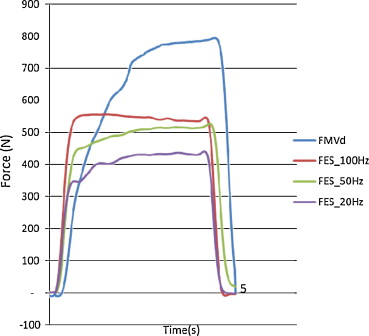
Electrical current frequency had a significant impact on the muscle contraction ( Fig. 3 ). Muscle fatigue set in very quickly, according to the increase in ES frequency ( Fig. 4 ). The slope of the curve obtained by normalizing the ES-induced maximal forces to MVCb showed this state of muscle fatigue ( Fig. 4 ).

Table 1 represents the mean values and standard deviations (SD) corresponding to the different measures recorded.
For each experimental setting 100, 50 and 20 Hz, the maximal voluntary contraction force recorded at the end of the session (MVCf) after a two-minute rest was lower than at the beginning of the session. MVCf represented respectively 71, 86 and 89% of MVCb ( Table 1 ). There was a significant difference ( p < 0.001) between the MVCb and end of the session (20 versus 100 Hz; 50 versus 100 Hz). The results obtained with ES frequencies of 20 and 50 Hz did not show any significant difference.
The ES-induced maximal forces at the beginning of the session (FESb) were significantly different from the MVCb.
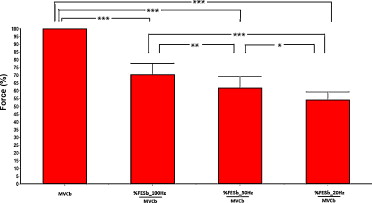
They represented respectively 71, 62, 55% of MVCb for stimulation frequencies of 100, 50 and 20 Hz. These values were also significantly different compared to one another (100 versus 50 Hz [ p < 0.01], 100 versus 20 Hz [ p < 0.001] and 50 versus 20 Hz [ p < 0.01]) ( Fig. 5 ).
There was a significant difference between the ES-induced maximal forces at the end of the session FESe compared to the MVCb ( p < 0.001). They represented respectively 27, 33, 38% of MVCb for stimulation frequencies of 100, 50 and 20 Hz. These values were also significantly different compared to one another (100 versus 50 Hz [ p < 0.01], 100 versus 20 Hz [ p < 0.001]). Apart from the comparison between the stimulations at 20 and 50 Hz there was no significant difference ( p > 0.05) ( Fig. 6 ).

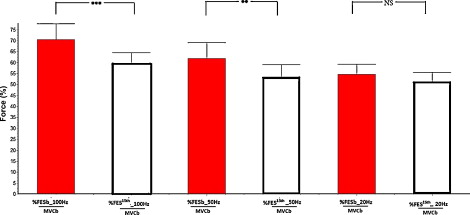
The intensity of the contraction declined significantly at the 15th stimulation for the sessions at 100 Hz ( p < 0.001) and at 50 Hz ( p < 0.01). There was no significant difference for the sessions at 20 Hz ( p > 0.05) ( Fig. 7 ). The percentages of force reached after the 15th contraction (i.e. after 5 min of stimulation) were at 60, 53 and 51% of MVCb, and at the 30th contraction (i.e. after 10 min of stimulation) the force produced only represented respectively 43, 43, 45% of MVCb for 100, 50 and 20 Hz frequencies ( Fig. 4 ).
1.5
Discussion
Our study compared the forces produced and the induced muscle fatigue during three ES sessions with 60 maximal 5-second contractions, separated by 15-second resting periods. For the three protocols, the PD was set at 300 μs. The increase of this value could help reach higher force thresholds, but it would also increases the painful sensation . For the subjects’ comfort, we did not keep this solution.
The intensity 61 ± 10 (data given by the manufacturer) was determined by the subjects’ tolerance; it was not significantly different for the three types of frequency used. We chose this option because it corresponds to a training setting when individuals use ES in addition to their regular strength-training program. Three different frequencies were used 100, 50 and 20 Hz. When we designed the protocol, we voluntarily gave the preference to frequency rather than the ES-induced force. In clinical practice, it is almost impossible to control the produced force. Furthermore, to envision a gain in muscular strength, the intensity of the contractions needs to be significant. This is hardly possible for low ES frequencies because of the pain triggered by the intensity increase. This study took these clinical requirements into account. The results of this study validated the ones from previous studies that showed an increase in force production linked to the increase in ES frequency . The muscle forces obtained in our study, with frequencies of 20, 50 and 100 Hz, represented respectively 55, 62 and 71% of the MVCb, in accordance with results reported by Portmann , who obtained, for a similar protocol, values of 56, 69 and 80%, respectively. However, this author did not monitor the force measurements during training sessions. The 100 Hz frequency led to a contraction at 71% of MVCb, but it triggered an intense fatigue, after 60 contractions the force produced was only at 27% of MVCb.
However, at a frequency of 20 Hz, muscle force declined less quickly than at 50 or 100 Hz. These results are similar to the ones reported in previous studies . The use of ATP by the actin-activated myosin ATPase is proportional to the generated tension . The ATPase reactions linked to Ca 2 +, Na+ and K+ contribute to using ATP during muscle activation. This phenomenon occurs even more quickly if the activation frequency is high . Contrarily to our results, Matsunaga et al. showed that low frequency (20 Hz) triggered a marked fatigue compared to high frequency (100 Hz). During their protocol, they used a very long ES duration (60 min versus 20 min in our study), and short training cycle, 4-second contraction and 60-second rest period versus 5 s and 15 s respectively in our study. This contradictory aspect could be explained by very long rest periods between contractions (60 s) allowing for a partial recovery of the substrates of the anaerobic metabolism of Type II muscle fibers’ that are solicited by high frequencies. Subjects, especially athletes who felt they were wasting their time, poorly tolerated such lengthy recovery periods between contractions.
Moreover, for strength training, it is necessary to reach a significant force threshold to expect a positive result . Based on the fact that force should be superior to 60% of MVCb in order to hope for improvement in muscle strength, only the 100 Hz frequency corresponds to this criterion at the 15th contraction. It is hardly possible to obtain 60% or more of MVCb with low frequencies as previously demonstrated . With a 50 Hz frequency, the 60% threshold is only reached for the first four contractions. An increase beyond pain threshold for low frequencies is simply not admissible. If 20 Hz frequencies are adapted for fighting against muscular atrophy or muscle wasting , they cannot be used to improve muscle force, at least in athletes. The same situation, at a lesser degree, is observed with 50 Hz frequencies.
Due to the onset of fatigue ( Fig. 4 ), during an ES session at 100 Hz, the force declines to reach, at the 15th contraction, 60% of MVCb (i.e. after 5 min of stimulation), and 43% at the 30th contraction (i.e. after 10 min of stimulation). This decline in force is to be correlated with the preferential solicitation of Type II muscle fibers, without any possibility of turnover for the motor units (23). A 20-minute stimulation protocol (60 contractions), very often used in studies on muscle strengthening, is not appropriate.
1.6
Conclusion
Due to the significant difference between muscle force and fatigue generated by the ES frequencies of 100, 50 and 20 Hz, we propose that the 100 Hz frequency be applied only to maximal muscle force training in a context of athlete training programs. According to the slower onset of fatigue at a frequency of 20 Hz, the latter seems more interesting in muscle rehabilitation training programs, for which the notion of force is less crucial. The ES protocol of 60 contractions used in a large number of training programs is not appropriate. It would seem preferable to use four sessions of 15 contractions (for a total duration of 5 min) separated by a 10-minute recovery period. This hypothesis still needs to be validated.
1.7
Acknowledgment
The authors would like to thank all the persons who participated in this study.
2
Version française
2.1
Introduction
À partir des années 1960, le développement de la technologie élargi le champ d’application de l’électrostimulation dans diverses applications de médecine physique et de réadaptation . La stimulation électrique (SE), est utilisée dans les protocoles d’entraînement musculaire, comme moyen d’amélioration de la force des muscles squelettiques sains pour des sujets indemnes de pathologie ou présentant des atrophies musculaires . L’utilisation de la SE neuromusculaire permet d’imposer aux muscles stimulés des quantités de travail non limitées par le stress cardiovasculaire, comme c’est le cas lors d’exercices volontaires. Les patients atteints de bronchopneumopathie chronique obstructive (BPCO) , de maladies cardiaques ou d’accident vasculaire cérébral peuvent suivre un programme de réentraînement à l’effort sous SE, dans les meilleures conditions sans que celui-ci génère une fatigue globale. De même, la pratique répétitive de l’électrostimulation peut améliorer les qualités neuromusculaires chez les sujets âgés . Pour obtenir une amélioration de la force sous SE, il est nécessaire de maintenir un niveau de force musculaire électro-induit de plus de 60 % de la force maximale volontaire . Cependant, les contractions musculaires électro-induites peuvent générer une fatigue très prononcée comparativement aux contractions volontaires . La conduction nerveuse électriquement induite est synchrone . L’augmentation de la fréquence de SE induit une installation très rapide de la fatigue . La fréquence de stimulation optimale semble se situer entre 80 et 100 Hz . Ferry et Poumarat ont montré que la fréquence optimale dépendait de la typologie musculaire. Une fréquence de 60 Hz permet d’obtenir les meilleurs résultats pour le muscle triceps sural, riche en fibres de type I.
La fatigue musculaire est définie par une diminution de la force musculaire liée à l’activation musculaire répétée . L’apparition de cette fatigue précoce est de nature à diminuer l’efficacité de la stimulation, particulièrement au cours de l’entraînement de force maximale .
Si, à notre connaissance, il n’existe pas d’études comparables à celle proposée ici, plusieurs auteurs ont abordés le problème de l’évaluation de la force et de la fatigue musculaire en fonction de la fréquence de stimulation.
Edwards et al. ont montré que la fatigue de basse fréquence (fatigue induite par des fréquences moins de 25 Hz) est caractérisée par une chute graduelle de force et une récupération lente de celle ci. Une fréquence supérieure à 75 Hz permet d’attendre un niveau de force supérieur, mais provoque une chute de force rapide accompagnée d’une récupération elle aussi rapide. Cooper et al. ont montré que la relation entre la diminution de force musculaire et la diminution de la capacité d’excitation était dépendante de la fréquence de stimulation. Benton et al. et Jones et al. ont démontré que la fatigue croissait avec l’augmentation de la fréquence de stimulation. La stimulation en dessous de 40–50 Hz solliciterait de plus en plus les fibres de type I, lentes, résistantes à la fatigue. Les fréquences plus élevées solliciteraient davantage les fibres de type IIa et IIb, rapides, très fatigables. Kesar et al. ont trouvé qu’une SE de basse fréquence (11 Hz) associée à une durée d’impulsion longue (600 μs) est moins fatigante musculairement qu’une SE de moyenne fréquence (30 Hz) et de durée d’impulsion moyenne (150 μs) ou qu’une SE de haute fréquence (60 Hz) et de courte durée d’impulsion (131 μs). Toutefois, il n’était demandé aux sujets que de produire 20 % de leur force maximale ; ce qui est loin des valeurs retenues pour un entraînement de force. Russ et al. ont montré que pour les muscles gastrocnémiens l’augmentation de la fréquence n’a pas d’influence sur la fatigue musculaire au cours d’un protocole de fatigue composé de 150 trains d’impulsions d’une durée de 300 à 1200 ms toutes les dix secondes. Trois fréquences, 20, 40 et 80 Hz, étaient appliquées. L’intensité utilisée permettait de produire 10 % de la force maximale volontaire lors de la flexion plantaire. Là encore, la force développée n’est pas compatible avec celle demandée pour un entraînement de force. Une autre étude a montré qu’une stimulation de haute fréquence induit moins de fatigue qu’une de basse fréquence pendant une stimulation répétitive.
Il n’existe cependant pas à notre connaissance de travaux permettant d’estimer la force et la fatigue musculaire électro-induite au cours d’une SE répétitive pendant 20 minutes, avec trois fréquences différentes et des niveaux de force compatibles avec un entraînement de force. Cette durée de 20 minutes est celle que l’on retrouve le plus souvent dans les protocoles d’entraînement proposés en SE.
2.2
Matériel et méthodes
Vingt-six sujets étudiants à l’université de Blaise-Pascal de Clermont-Ferrand (âge : 23 ± 3 ans ; taille : 174 ± 10 cm ; poids : 71 ± 10 kg), sans pathologie de type orthopédique, neurologique ou vasculaire, ont participé aux trois sessions proposés (trois fréquences de stimulation différentes). Ils sont répartis en trois groupes de 13 à 16 sujets. Ils pratiquent pour la plupart une activité sportive de loisir ou de compétition au niveau départemental à national. Après information et avoir donné leur consentement pour participer à cette étude non invasive, la participation des sujets était volontaire. Les sujets étaient libres de se retirer de l’étude à tout moment. La procédure utilisée est en accord avec la déclaration d’Helsinski. Le sujet est assis sur un siège permettant d’évaluer la force d’extension de la jambe sur la cuisse. La profondeur de l’assise et la position du capteur sont réglables selon sa morphologie ( Fig. 1 ). L’angle d’inclinaison du tronc est de 120° et la flexion de la jambe est de 60°, ce qui correspond à la position où une force maximale peut être produite . Le capteur de force est solidarisé à la cheville droite du sujet, perpendiculairement à l’axe longitudinal de la jambe. Le bassin est également attaché au fauteuil par une ceinture abdominale réglable, afin de limiter les mouvements parasites.
La chaîne de mesure utilisée permet d’enregistrer la force musculaire à une fréquence de 50 Hz en continu via une carte d’acquisition National Instruments DAQCard-AI-16E-4. Des logiciels d’acquisition et de traitement des données spécifiques à l’étude ont été développés au laboratoire (langage de programmation Matlab ® ).
Le sujet peut visualiser en temps réel une représentation de la force développée sur un écran. Un stimulateur de marque « Magic Form » délivre des courants de type bi-phasique rectangulaire, la durée des hémi-phases est de 300 μs. Les fréquences proposées sont 100, 50, et 20 Hz. L’intensité correspond à l’intensité maximale tolérable. Nous avons utilisé quatre électrodes de surface en élastomère : trois positionnées sur les points moteurs des muscles vaste latéral, vaste médial et droit fémoral et la quatrième en regard du nerf fémoral à la partie proximale de la cuisse ( Fig. 1 ). Un échauffement spécifique des muscles extenseurs de la jambe sur la cuisse d’une durée de trois minutes (contractions dynamiques et isométriques infra maximales), suivi d’une durée de trois minutes de repos est réalisé avant chaque expérimentation. Chaque sujet est alors soumis à un test de force maximale volontaire isométrique dite de début de séance (FMVd). Trois contractions volontaires isométriques maximales d’une durée de cinq secondes, espacées de trois minutes de repos sont demandées. La moyenne des trois essais est retenue comme étant la FMVd de référence. Cinq minutes de repos sont allouées avant d’entreprendre la période de SE. Trois sessions de stimulation de 20 minutes (60 contractions maximales électro-induites d’une durée de cinq secondes séparées de 15 secondes de repos) sont nécessaires à l’étude. Ces trois sessions sont espacées de trois jours et appliquées dans un ordre aléatoire, pour ne pas tenir compte de l’influence de l’adaptation des sujets à l’entraînement sous SE pour les sujets ayant réalisé au moins deux d’entre elles. La force maximale volontaire finale (FMVf) est mesurée en fin de séance après deux minutes de récupération ( Fig. 2 ). Il n’est demandé qu’une répétition de ce test. On considère qu’à ce moment de l’expérimentation les sujets sont familiarisés avec le mode de contraction demandé. Cela n’était pas forcement le cas en début de séance. Par ailleurs, la prise de mesures différée dans le temps compte tenu du repos nécessaire entre chaque essai rend non significatif une multiplication de la procédure.
Les forces induites sous SE sont enregistrées pour les 60 contractions demandées. Les valeurs de début (FESd) et de fin de séance (FESf) sont relevées. Les valeurs de FESd, FESf, FMVf, ainsi que les forces développées pour la 15 e et la 30 e contraction ( <SPAN role=presentation tabIndex=0 id=MathJax-Element-1-Frame class=MathJax style="POSITION: relative" data-mathml='FES15e’>FES15eFES15e
FE S 1 5 e
, <SPAN role=presentation tabIndex=0 id=MathJax-Element-2-Frame class=MathJax style="POSITION: relative" data-mathml='FES30e’>FES30eFES30e
FE S 3 0 e
) sont exprimées en pourcentage de FMVd.
2.3
Analyse statistique
Une analyse de variance à une voie (Anova) suivie d’une analyse « post-hoc » de Tukey sont utilisées pour comparer les pourcentages de forces maximales électro-induites de début de séance (FESd), les forces électro-induites à la 15 e contraction ( <SPAN role=presentation tabIndex=0 id=MathJax-Element-3-Frame class=MathJax style="POSITION: relative" data-mathml='FES15e’>FES15eFES15e
FE S 1 5 e
), les forces électro-induites à la 30 e contraction ( <SPAN role=presentation tabIndex=0 id=MathJax-Element-4-Frame class=MathJax style="POSITION: relative" data-mathml='FES30e’>FES30eFES30e
FE S 3 0 e
) et les forces de fin de session (FESf), à la FMVd (%FESd/FMVd; % <SPAN role=presentation tabIndex=0 id=MathJax-Element-5-Frame class=MathJax style="POSITION: relative" data-mathml='FES15e’>FES15eFES15e
FE S 1 5 e
/FMVd, <SPAN role=presentation tabIndex=0 id=MathJax-Element-6-Frame class=MathJax style="POSITION: relative" data-mathml='FES30e’>FES30eFES30e
FE S 3 0 e
/FMVd, %FESf/FMVd, %FMVf/FMVd).
2.4
Résultats
Toutes les contractions obtenues soit par SE, soit par contraction volontaire sont de type tétanique ( Fig. 3 ).
Related posts:
 Physical and rehabilitation medicine in Europe, from the White Book to the eBooks
A study of isokinetic trunk and knee muscle strength in patients with chronic sciatica
Non-steroidal anti-inflammatory drugs for athletes: An update
Seeking care for lower back pain in the French population aged from 30 to 69: The results of the 2002–2003 Décennale Santésurvey
Assessment of compliance with prescribed activity by hemiplegic stroke patients after an exercise programme and physical activity education
Analyse de livre
Physical and rehabilitation medicine in Europe, from the White Book to the eBooks
A study of isokinetic trunk and knee muscle strength in patients with chronic sciatica
Non-steroidal anti-inflammatory drugs for athletes: An update
Seeking care for lower back pain in the French population aged from 30 to 69: The results of the 2002–2003 Décennale Santésurvey
Assessment of compliance with prescribed activity by hemiplegic stroke patients after an exercise programme and physical activity education
Analyse de livre
Stay updated, free articles. Join our Telegram channel

Full access? Get Clinical Tree


