Infection and Inflammation/Arthritis 
Musculoskeletal infectious and inflammatory processes are discussed together in this chapter, since the clinical presentation is often quiet similar and, in many cases, the clinical picture dictates the final imaging diagnosis. In the domain of inflammatory or infectious arthritis, the role of the radiologist is to confirm or exclude the clinically suspected entity, characterize the severity and extent of the abnormality, and, in some cases, provide an alternative diagnosis. Correlation of MR imaging findings with plain films is quite useful especially in cases where a bony lesion is the predominant finding. The checklist for structured reporting is displayed in Appendices 1 and 2. Conceptual details of related MR physics and imaging protocol are discussed in the chapter of MR imaging protocol optimization.
 IMAGE EVALUATION
The below-outlined stepwise interpretation approach is only a practical guide, and all structures should be evaluated in multiple planes for optimal assessment. The following discussion will help reader evaluate infectious and inflammatory processes of the musculoskeletal system with reasonable accuracy.
1. Start with long-axis fluid-sensitive (fat-saturated [fs] T2-weighted [T2W], fs proton density-weighted [PDW], or short-tau inversion recovery [STIR]) images and T1-weighted (T1W) images to detect the lesions, assess their distribution in the regional anatomy, and gauge their extent. Fluid-sensitive sequences are most sensitive for identifying areas of edema, joint effusion, and fluid collection, whereas T1W images are good for anatomic localization, and for further characterization of the lesions, thereby increasing the specificity of the diagnosis.
2. Line up the similar-plane, axial T1W, fluid-sensitive, pre- and postcontrast fsT1W images, and synchronize them for tandem evaluation. If 3D isotropic images have been obtained, the technologist should create reconstructions in prespecified planes, so that reading time can be shortened and similar-plane reconstructions can be synced. Systematic evaluation of this kind allows the reader to outline the anatomy, identify the extent of the pathology and individual structures involved, and in particular, differentiate reactive bone marrow edema (mostly bright on fluid-sensitive images) from bone marrow infection (bright on fluid-sensitive images but also correspondingly dark on T1W images). On post-contrast images, the enhancing T2 bright areas reflect hyperemic tissue whereas those that lack enhancement, represent devitalized tissue. A rim-enhancing necrotic/cystic lesion in the cloud of edema/hyperemia is highly suspicious for an abscess. Enhanced scans are also useful to evaluate the extent and severity of synovitis, define the extent and distribution of soft tissue infections, identify sinus tracts, and detect foreign bodies. On all sequences, areas of low signal may correspond to fibrous tissue, calcification, sequestrum, air, or foreign bodies.
3. Although not universally obtained, MR angiography, dynamic contrast-enhanced (DCE), and diffusion-weighted (DW) imaging sequences are becoming increasingly popular as parts of musculoskeletal infection and inflammation imaging protocols. MR angiography can be used to evaluate vascular patency in areas of infection, define the proximity of vessels to drainable abscesses, and detect vascular irregularity in underlying vasculitis. DCE imaging offers characterization of enhancement patterns, detection of solid neoplastic tissue, if there is unsuspected underlying tumor, and defines the extent of devitalized tissue. Evaluated in conjunction with other pulse sequences, DW imaging assists in the diagnosis of abscess (which shows restricted diffusion), and in the evaluation of patients who have contraindication to intravenous contrast (including diabetic feet). Dark bone on a DW image usually means no osteomyelitis (OM) (Fig. 1).
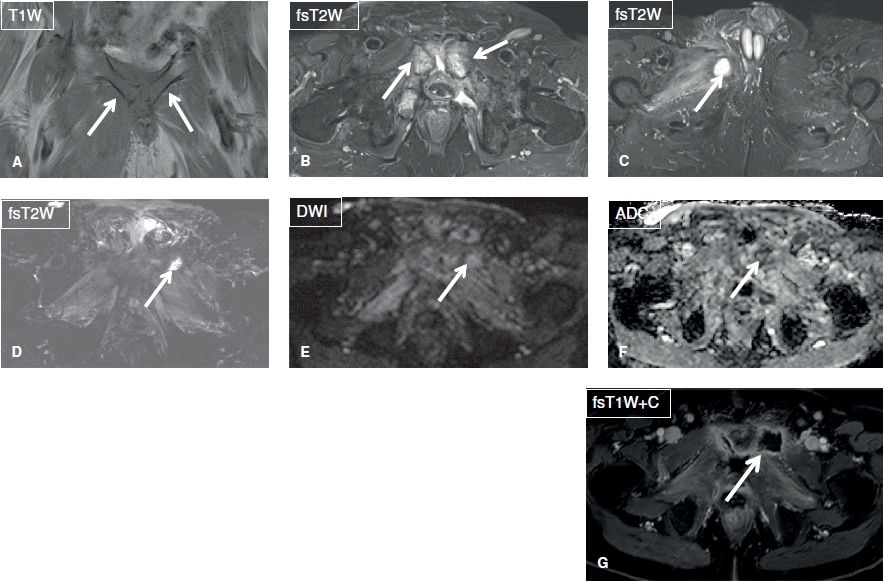
Fig. 1: Osteomyelitis and septic arthritis. A, B: Coronal images show confluent T1 hypointensity and T2 hyperintensity in the pubic symphysis with effusion in this patient with pubic osteomyelitis and septic arthritis (arrows). Also note surrounding myositis and fasciitis, a hallmark secondary sign of infection. C: Axial image shows abscess in the right adductor muscles (arrow). D–G: After debridement, there is resolution of osteomyelitis (dark on fsT2W and no diffusion restriction) with residual muscle edema. Notice new abscess in the left adductor muscle with mild diffusion restriction (arrows).
4. In case, arthritis or a rheumatologic condition is suspected, look for evidence of mono- or polyarthritis findings on the long-axis images. Using long- and short-axis images, check for soft tissue swelling (symmetric or asymmetric), joint effusion, synovial thickening/synovitis, tenosynovitis, bony productive changes (osteophytes, syndesmophytes, enthesophytes), joint space loss/cartilage loss, erosions/cystic changes, bone marrow edema, subluxation/bony malalignment, and ankylosis. Joint effusion should be graded as small, moderate, or large, as described in individual joint chapters in this book whereas synovial thickening/synovitis, bony productive changes, and tenosynovitis should be classified as mild, moderate, or severe. The severity of joint space/cartilage loss, erosions/cystic changes, subluxation, and ankylosis can be graded as involving less or more than the 50% of the articular surfaces. The locations of bone erosions and cystic changes (articular or para-articular surfaces) should be defined. In carpal involvement, the carpometacarpal ratio should be reported.
5. Finally, report incidental lesions, such as a space-occupying masses and soft tissue ganglion cysts, as well as identifiable internal derangement findings, such as tears of menisci, labrum, triangular fibrocartilage complex, and other ligaments, etc.
 BOX 1: The Structured Report: Infection
The checklist for structured reporting of MR imaging of infection. For each field, Normal is considered default in the dictation whereas the rest of the elements describe various pathologies that could be encountered during imaging evaluation. See Appendices 1 and 2 at the end of the chapter for a sample completed report.
EXAM: MRI [<EXTREMITY / JOINT>] [<WITH / WITHOUT>] CONTRAST
FINDINGS:
There [<is no> <is> <focal / diffuse>] soft tissue subcutaneous edema.
There [<is no> <is> <focal / diffuse / multifocal>] muscle edema.
There [<is no> <is>] significant superficial or deep fascial fluid.
There [<is no> <is>] large drainable fluid collection.
There [<is no> <is>] focal bone marrow edema.
There [<is no> <is>] large joint effusion.
Incidental Findings: [<_>]
Post-gadolinium Discussion: [<_>]
IMPRESSION:
[<In the order of importance with acute findings first>]
 HOW TO FILL THE STRUCTURED REPORT
Reporting Using the Template for Infection
There [<is no> <is> <focal / diffuse>] soft tissue edema.
There [<is no> <is> <focal / diffuse / multifocal>] muscle edema.
There [<is no> <is>] significant superficial or deep fascial fluid.
Musculoskeletal infections are characterized by edema and hyperemia of the involved tissues. Soft tissue edema manifests as area(s) of hyperintensity on fluid-sensitive images, and hypointensity on T1W images, which is usually ill defined and may, less commonly, demonstrate homogeneous soft tissue thickening (due to swelling). Hyperemia or cellulitis manifests as abnormally increased contrast enhancement and edema on T2W images of the involved tissues. Areas of edema-like T2 hyperintensity without abnormally increased contrast enhancement correspond to non-inflammatory edema (e.g., from congestive heart failure, diabetic vascular insufficiency and lymphatic obstruction) (Figs. 1–4). Finally, areas of edema-like T2 hyperintensity with abnormally decreased contrast enhancement reflect devitalized tissue (e.g., in diabetic feet with dry gangrene due to coagulative necrosis, wet gangrene due to liquefactive necrosis, and gas gangrene due to gas forming organisms).
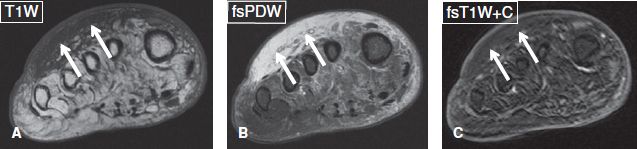
Fig. 2: Subcutaneous edema, without cellulitis in a diabetic subject. Axial images. A, B: There is diffuse T1 hypointensity and T2 hyperintensity of the dorsal aspect of the forefoot (arrows), in keeping with subcutaneous edema. There is no focal collection. C: Absence of contrast enhancement in the above area (arrows) indicates absence of hyperemia and excludes cellulitis.
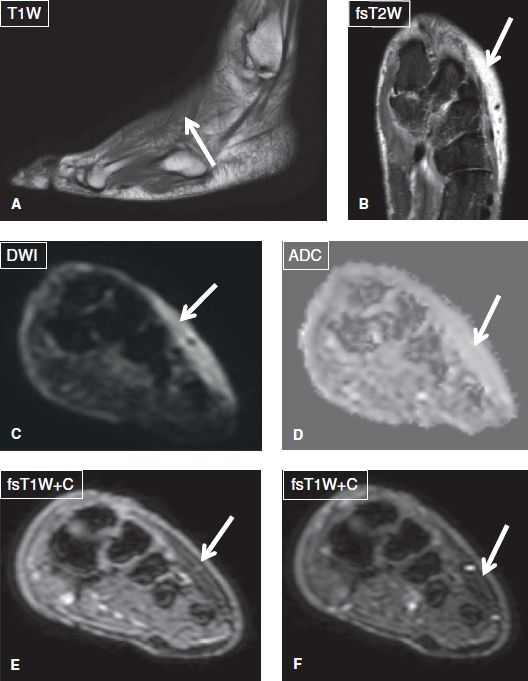
Fig. 3: Soft tissue edema and not cellulitis. Sagittal (A) and coronal (B) images show dorsal subcutaneous edema (arrows). There is no restriction on DWI images (arrows in C, D) and no significant enhancement on before and after subtraction contrast images (arrows in E, F).
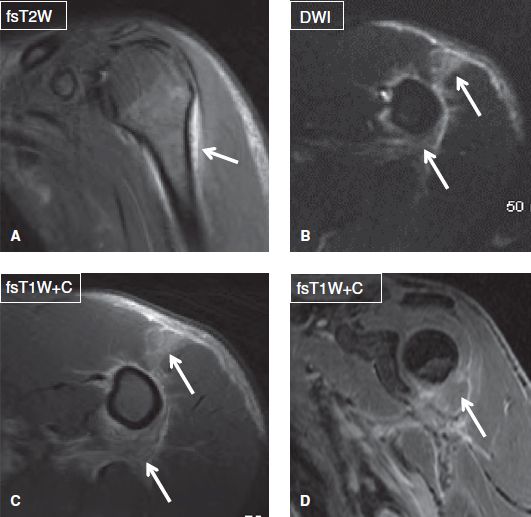
Fig. 4: Cellulitis and myositis. Coronal (A, D) and axial (B, C) images show edema and enhancement (arrows) in the anterior belly of the deltoid muscle and adjacent fascial planes. Notice no collection to suggest superimposed abscess. Also there is no osteomyelitis (dark on DWI and no abnormal enhancement) or evidence of septic arthritis (no effusion or synovitis).
The involvement of the soft tissues may be focal, diffuse, or multifocal. The first pattern usually advocates for a single and contained infectious process, the second pattern indicates an expansile and more aggressive entity, (such as necrotizing fasciitis or Fournier gangrene) whereas the third multifocal pattern likely suggests a systematic infectious process. Musculoskeletal infections can be classified into superficial lesions, which include skin ulceration, cellulitis, superficial fasciitis, septic bursitis, and infectious tenosynovitis; and deep lesions, which include deep fasciitis, necrotizing fasciitis, pyomyositis, periostitis, osteitis, OM, and septic arthritis. An important role of imaging is to distinguish superficial from deep infections because the latter usually require longer administration of antibiotics and/or surgery to address the primary nidus of deep infectious process or its complications, such as compartment syndrome and tissue necrosis.
Cellulitis is a non-necrotizing infection, restricted to the skin and subcutaneous tissues, without involvement of the underlying fascia or muscles (Figs. 1, 4). The diagnosis is clinical, but MR imaging may be ordered if the disease advances rapidly and/or demonstrates severe systemic manifestations, suggesting an underlying deep extension and/or abscess formation. Imaging findings include T2 hyperintensity, thickening and moderate contrast enhancement of the involved area.
Septic bursitis is the result of bacterial inoculation of synovial bursa (e.g., from penetrating injury or extension from the joint capsule, e.g., in infected iliopsoas or greater trochanteric bursitis). The most commonly involved sites are the olecranon, greater trochanteric, prepatellar, iliopsoas, and retrocalcaneal bursae. On imaging, the bursa is distended by T1 hypointense and T2 hyperintense homogeneous or heterogeneous fluid collection, and features a thickened and enhancing wall. Internal bursal septations and punctuate signal voids (gas bubbles), as well as edema and enhancement of the overlying skin (associated cellulitis) may also be seen (Fig. 5).
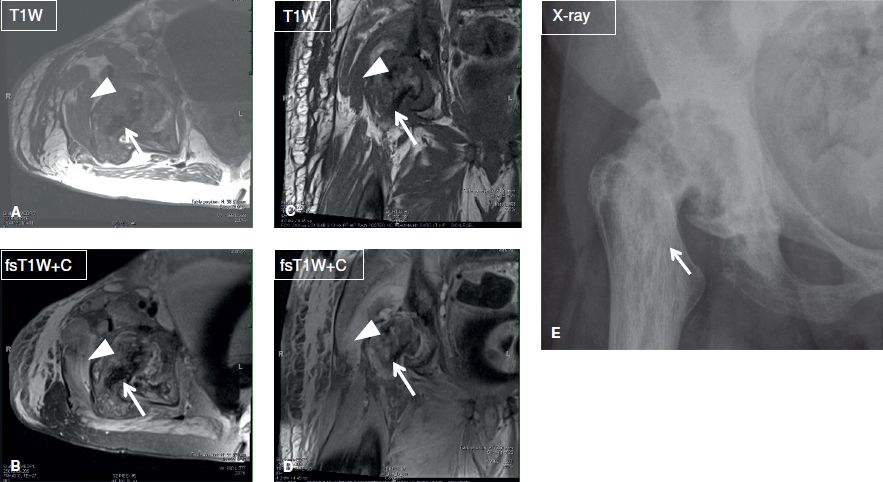
Fig. 5: Septic bursitis. Axial (A, B) and coronal (C, D) MR images and AP radiograph (E) show evidence of chronic pagetoid changes of the right hip (arrows). There is superimposed cellulitis, myositis, and greater trochanteric infected bursitis (arrowheads). Notice synovitis of the hip joint as well.
Infectious tenosynovitis most often occurs in the hand, wrist, elbow, feet, and ankle. It manifests as thickening and contrast enhancement of the involved tendon sheath, which is distended by complex fluid that shows varying signal alterations, related to pus, gas, blood, and/or debris. The respective infected/inflamed tendon is ill-defined, thickened, and shows intermediate signal. There is typically fascial edema of the surrounding soft tissues, which is a useful pointer in distinguishing it from other causes of inflammatory tenosynovitis. Additional findings suggesting infection include, asymmetrical involvement or isolated involvement of tendon sheath at the site of prior injury. Because infection evolves rapidly and it may be complicated by skin loss, tendon necrosis, or OM, infectious tenosynovitis is usually considered a surgical case, and early diagnosis and treatment are essential (Figs. 6, 7).
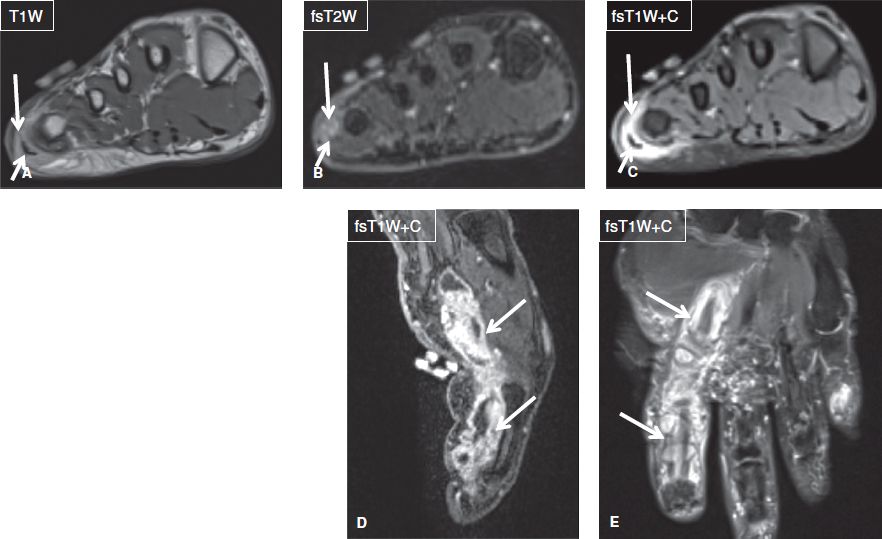
Fig. 6: Infection-related tendinitis. Axial images (A–C) demonstrate T2 hyperintensity and enhancement of the lateral aspect of the forefoot (long arrows), which reflect edema and enhancement, respectively and are indicative of inflammation. T2 hyperintensity and enhancement of the abductor digiti minimi tendon and muscles (short arrows) confirm associated tendinitis. Sagittal (C) and coronal (D) images in another subject show infectious tendinitis and tenosynovitis (arrows) of the flexor tendon of the index finger from atypical mycobacterium.
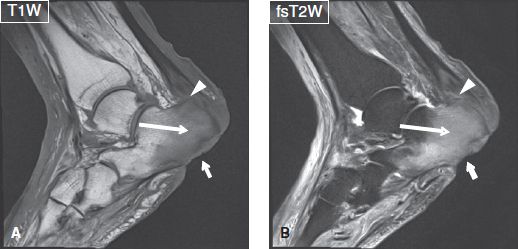
Fig. 7: Osteomyelitis and Achilles tendinitis. Sagittal images (A, B) show a T1 hypointense, T2 hyperintense confluent marrow signal alteration (long arrows) of the calcaneus corresponding to osteomyelitis. Note the deep ulcer (short arrows) of the overlying soft tissues, cortical destruction of plantar aspect of the calcaneus, and insertional Achilles tendinitis and small intratendinous collection (arrowheads).
Necrotizing fasciitis is a rapidly progressing infection of the deep fascial layers, which is characterized by widespread fascial necrosis and life-threatening system toxicity. Imaging findings include deep fascial and intermuscular fascial thickening and fluid collections, along with high T2 signal within the muscles, reflecting reactive edema. Contrast enhancement of the deep and intermuscular fascia is present in the early stages of the disease but becomes diminished or absent in the later stages, when the fascial necrosis progresses and the involved tissues become devitalized and avascular. Scattered subcutaneous and fascial foci of low signal are indicative of gas and are considered useful for the diagnosis of the entity. Other causes of emphysema include open wound communication or gas gangrene. The presence of bulging fascia in this setting is suspicious for development of compartment syndrome. The role of imaging is to define the extent of the process and detect fluid collections. It should be noted that the diagnoses of both necrotizing fasciitis and compartment syndrome can be confirmed, but cannot be excluded by imaging.
Pyomyositis (infectious myositis) refers to purulent infection of skeletal muscle. In most patients, a single muscle is affected, but multiple muscles can be involved in up to 30–40% of cases. In the initial stage, the affected muscle is enlarged, edematous and demonstrates architectural distortion along with heterogeneous areas of low T1 and high T2 signal. As the infection evolves, small intramuscular fluid collections develop and subsequently coalesce into larger abscesses (see description on next paragraph) that may demonstrate variable signal characteristics. There is restricted diffusion on DW imaging and peripheral enhancement on post-contrast images (Fig. 8). Delayed onset muscle soreness (DOMS) and rhabdomyolysis are related differentials, which occur following recent heavy exercise or drug abuse. Both entities are considered to be part of the same spectrum of excertional muscle injury. There are usually no clinical signs or laboratory findings of toxemia. The symptoms and imaging findings are commonly bilateral, and there are associated high serum CPK levels. While DOMS shows multifocal muscle edema-like signal, areas of intramuscular hemorrhage (T1 hyperintensity) are frequently present in rhabdomyolysis (Figs. 9, 10). Myoglobinuria is also more pronounced in rhabdomyolysis. Perimuscular fascial edema can be associated with most benign causes of muscle pathology, including myopathy, muscle strains, pyomyositis, and rhabdomyolysis, while it is characteristically absent in denervation muscle change.
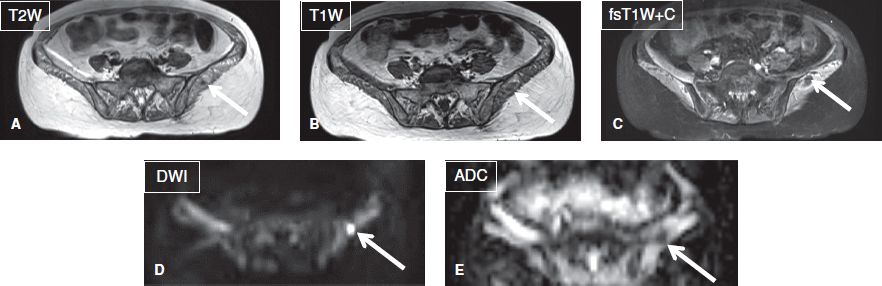
Fig. 8: Intramuscular abscess. Axial images. A–C: A relatively well-defined T1 hypointense, T2 hyperintense ring-enhancing lesion (arrows) is evident in the left gluteus muscle. Notice diffusely edematous pelvic muscles in this patient with septicemia. D, E: The lesion (arrows) demonstrates restricted diffusion (ADC = 0.8 × 10 to 3 mm2/s) was found to be a local abscess in otherwise florid case of diffuse myositis.
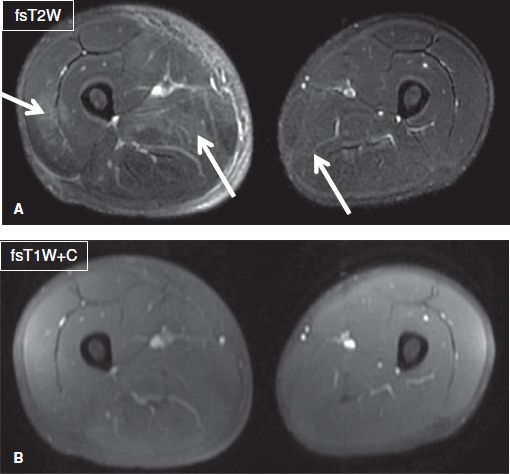
Fig. 9: DOMS. Axial images (A, B) show patchy muscle edema and adjacent fascial edema (arrows) in multiple compartments of the right leg and minimally in the left leg in this patient who had recently played a soccer match and now complains of leg pain for few days. CPK was elevated and there was no myoglobinuria. Notice no abnormal enhancement on contrast image.
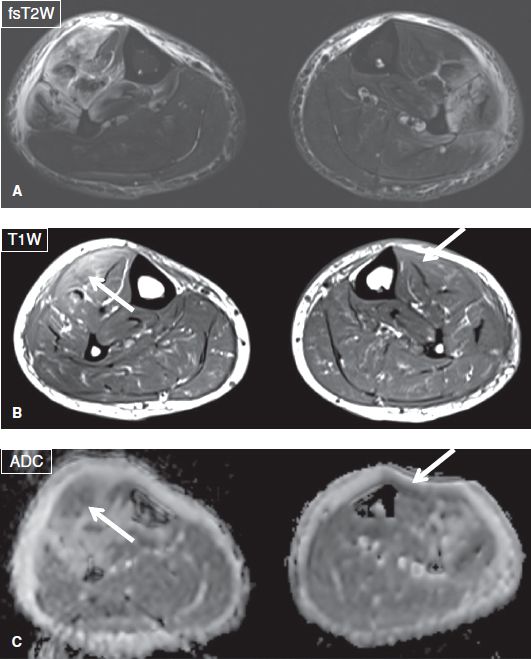
Fig. 10: Rhabdomyolysis. Axial images (A–C) show patchy muscle edema, adjacent fascial edema, and bulging fascia in the anterolateral compartments of both legs in this patient who had undergone recent excessive exercise. Notice internal patchy hemorrhage showing up as hyperintensity on T1W images and dark signals on ADC images (arrows).
There [<is no> <is>] large drainable fluid collection.
In the setting of infection, any localized fluid collection is considered an abscess, unless proven otherwise. Typical imaging features include a non-enhancing fluid collection of low-to-intermediate T1 signal and high T2 signal, which is demarcated by a hypointense and enhancing thick and irregular wall, and is associated with edema and reticulation of the surrounding tissues. The well-defined borders of the entity differentiate it from phlegmon, which appears as a poorly defined T2 hyperintense enhancing area. If gas develops due to communication with an air-containing hollow organ or open wound, or a gas-forming organism, foci of signal void will appear in the non-dependent portion of the cavity, leading to formation of air–fluid level (s). Abscesses also exhibit restricted diffusion on DW images, a feature that may assist in case where contrast administration is contraindicated. Another type of infectious (but not walled-off) fluid collection occurs with accumulation of inflammatory fluid within deep fascial layers in necrotizing fasciitis, as described above. This should be differentiated from simple-looking or blood product containing fascial fluid collection that might be observed in trauma-related degloving lesions. The latter lesions are most commonly observed in prepatellar or great trochanteric areas (Fig. 11). Any collection larger than 1–2 cm in the setting of fever should be aspirated, as imaging cannot definitely confirm the sterility of the lesion (Fig. 12).
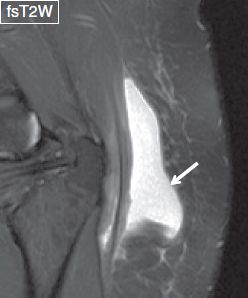
Fig. 11: Degloving lesion. Left gluteal swelling with history of recent MVA. Notice lobulated fluid collection separating the fascial layers above the gluteal tendon in keeping with a degloving lesion (arrow). Also note underlying trochanteric bursitis.
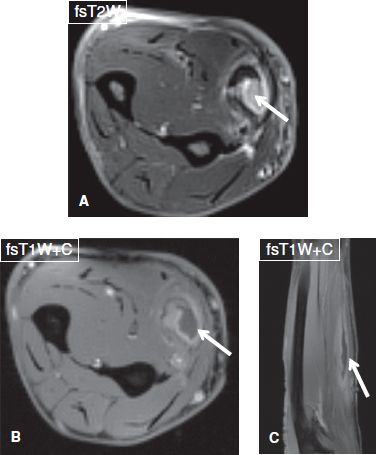
Fig. 12: Drainable intramuscularabscess. Middle-aged female with fever. Axial (A, B) and sagittal (C) images demonstrate complex rim-enhancing collection in the flexor carpi radialis muscle (arrows) with surrounding myositis.
There [<is no> <is>] focal bone marrow edema.
Bone marrow edema manifests as area(s) of hyperintensity on fluid-sensitive images. In the setting of adjacent inflammation/infection, such bone marrow hyperintensity may be attributed to (1) reactive marrow edema, in which the involved marrow space demonstrates either normal or minimal and hazy intermediate T1 signal (mostly in a subchondral location) minimal or no increased signal on DW images at higher b values (400 or above), as well as no or mild contrast enhancement (Fig. 13), or (2) acute-subacute OM, in which the involved marrow exhibits ill-defined and confluent low signal intensity on T1W images, increased signal on DW images, and intense enhancement on post-contrast images. The non-enhancing areas correspond to necrotic tissue or organized intra-osseous abscesses. The latter additonally exhibit rim enhancement, or demonstrate restriction on DW images. Therefore, in the setting of T2 hyperintense bone marrow, T1W images are the key to diagnose OM (Figs. 7, 14, 15), and OM can be excluded, without the use of contrast administration, in case no definite low T1 signal is detected in the involved marrow space. In fact, absence of bone marrow edema on STIR, fsT2W, or DW images virtually excludes OM (Fig. 16). Associated findings of acute-subacute OM include adjacent cellulitis, soft tissue phlegmon and/or abscess, subperiosteal abscess, and particularly, overlying ulcer, and/or sinus tract. The latter two findings are very common in adults, to the level that, acute OM is unlikely, if there is no ulcer or sinus tract. An important, highly specific feature for establishing OM is cortical disruption in the involved area, which is depicted as a focus of cortical discontinuity on T1W images and associated high T2 signal. Cortical involvement or destruction is easily seen as focal cortical enhancement on post-contrast images (Fig. 14). In children, an elongated multilayered necrotic lesion, which reaches but does not cross the growth plate, is also highly suggestive of acute OM (Fig. 17). Presence of fluid collections distinguish OM from neoplastic processes, such as Ewing sarcoma or leukemia, which demonstrate solid-enhancing masses.
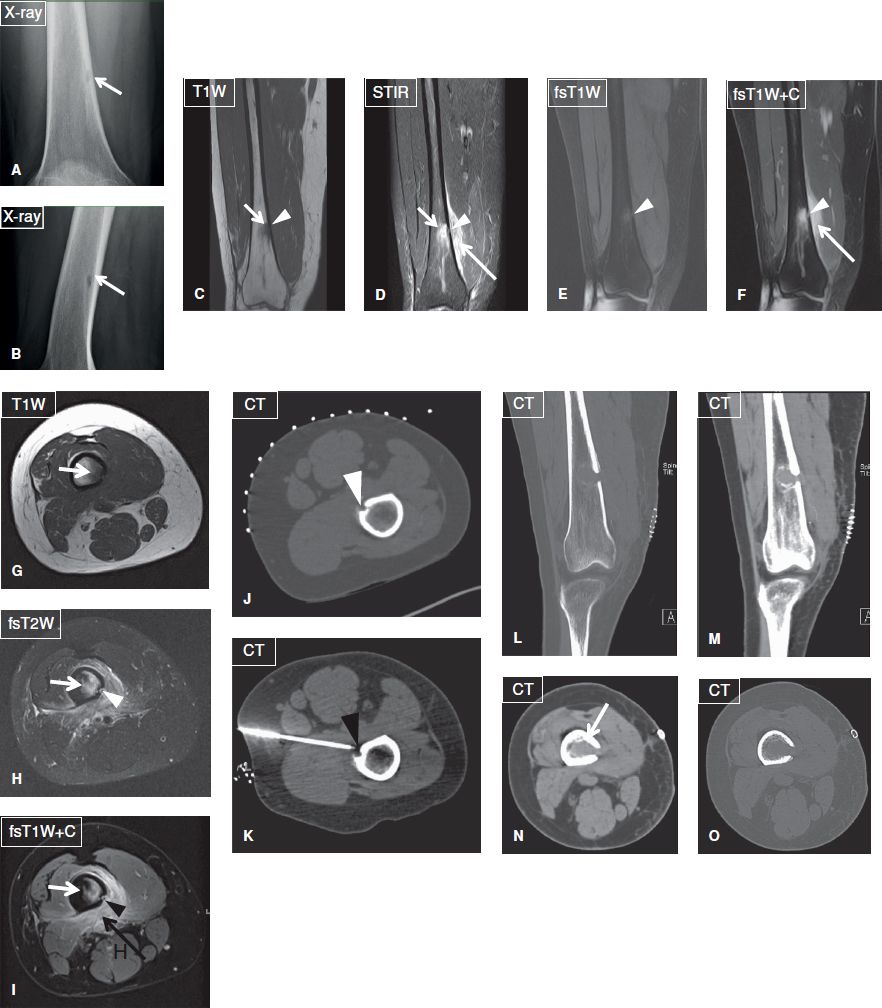
Fig. 14: Focal osteomyelitis in a 31-year-old female with history of furuncles on her thighs, who was treated with oral antibiotics. Anteroposterior (A) and lateral (B) plain films reveal a radiolucent focus (arrow) with relatively ill-defined margins at the distal femoral metadiaphysis. On the corresponding coronal (C–F) and axial (G–I) MR images, the lesion (short arrows) is T1 hypointense and T2 hyperintense, shows strong contrast enhancement and is associated with edema and enhancement of the adjacent soft tissues (long arrows) as well as with an adjacent focus of cortical disruption and enhancement (arrowheads). On biopsy under CT guidance (J, K), the lesion proved to be a focus of methicillin-resistant Staphylococcus aureus osteomyelitis. Again, note the focus of cortical disruption (arrowheads). Coronal-reformatted (L, M) and axial (N, O) CT images demonstrate the postdebridement appearance of the infected area.
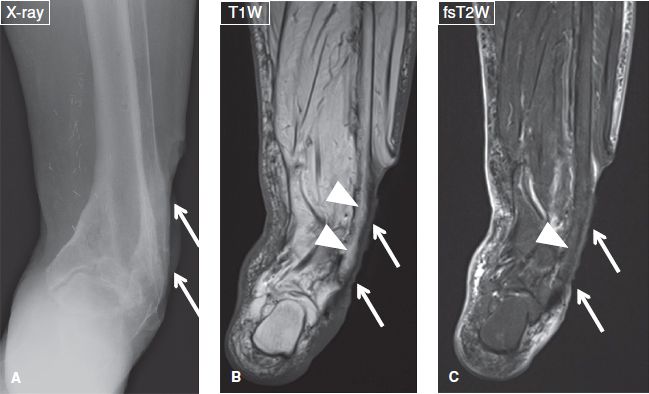
Fig. 13: Reactive bone marrow edema. Case of a 78-year-old female with fever and a deep and extended ulcer of the lateral aspect of the ankle. A: Anteroposterior radiograph reveals the ulcer (arrows) but shows no cortical destruction in the underlying bone. B, C: The respective coronal MR images again exhibit the ulcer (arrows), normal marrow on T1W image (arrowheads in B), and minimal reactive edema on the fs T2W image (arrowheads in C).
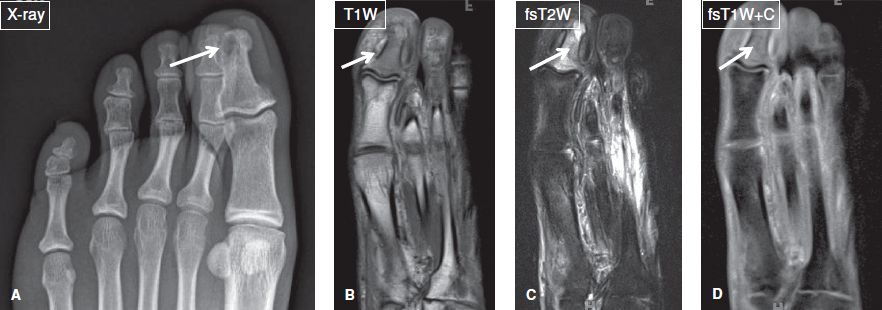
Fig. 15: Patient with diabetes mellitus, and toe swelling due to recent trauma. A: Anteroposterior radiograph show a subcortical lytic lesion at the distal phalanx of the great toe (arrow). B–D: On the corresponding coronal MR images, most of marrow of the phalanx is T1 hypointense/T2 hyperintense and enhances (arrows), in keeping with osteomyelitis, later proven on image-guided biopsy. Notice the lytic lesion corresponds to intraosseus abscess.
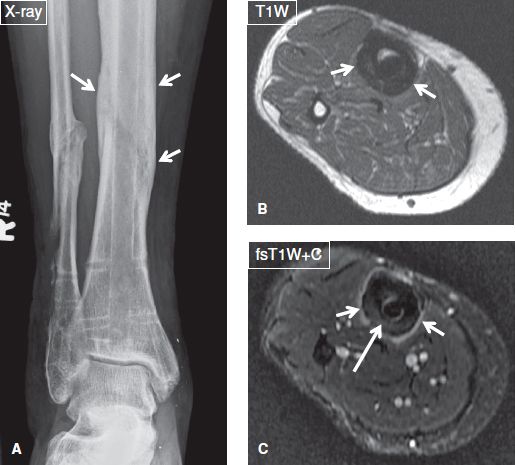
Fig. 16: Osteitis and periostitis but no osteomyelitis in a 47-year-old female who presented with fever and a tibial ulcer. A: Anteroposterior radiograph demonstrates chronic postoperative findings of fibular and tibial fractures as well as extensive periosteal thickening (arrows) of the tibia. B, C: On the respective axial MR images, there is homogeneous mild thickening and enhancement of the periosteum (short arrows), indicating of periostitis, as well as mild enhancement of the cortex (long arrow), signifying osteitis. Absence of marrow enhancement excluded osteomyelitis.
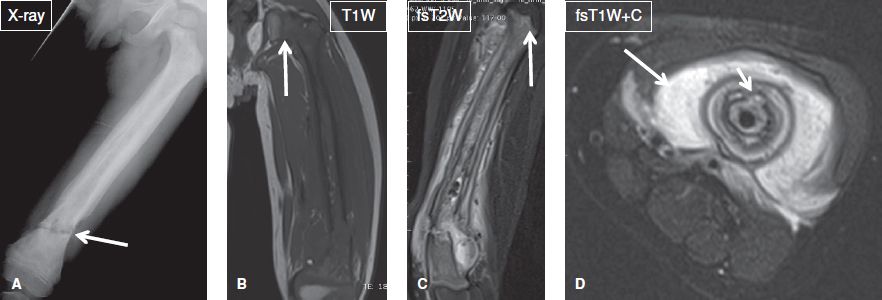
Fig. 17: Osteomyelitis. Young boy with fever and suspected Ewing sarcoma versus osteomyelitis. A: AP radiograph shows extensive periostitis, cortical thickening and sclerosis of the femur with a pathologic fracture at the distal metadiaphysis (arrow). B, C: Coronal MR images show extensive marrow replacement and fascial edema with subperiosteal and perifracture fluid collections. Notice the signal abnormality abruptly stops at the physeal plate (arrows, a classic sign of osteomyelitis). D: Axial postcontrast image shows extensive intramedullary, periosteal, and soft tissue enhancement (long arrow) and cloaca (short arrow) in this case of biopsy-proven osteomyelitis.
Subacute OM results from organisms of low virulence, inadequate therapy, abnormal bone, or strong host resistance. The classic form of subacute OM is Brodie abscess, which features a characteristic multizone configuration on T1W images, consisting of an innermost necrotic area of low signal, a relatively high signal intensity T1 rim, representing mineralized tissue; an outer low-to-intermediate signal rim of granulation tissue; and an outermost ill-defined zone of relatively low signal, which corresponds to marrow edema or hyperemia. Brodie abscesses usually develop in the metaphysis and may demonstrate finger-like extensions, which occasionally extend into the adjoining physeal plate and usually fail to cross it. This phenomenon is known as “tunneling,” and is pathognomonic of the condition (Figs. 18, 19).
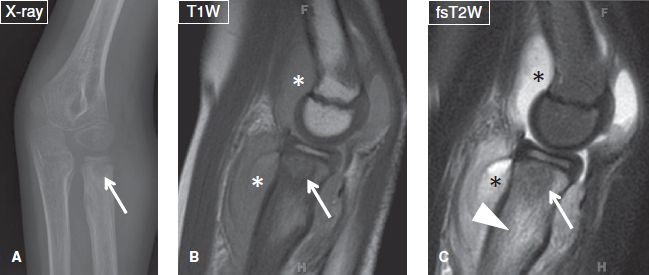
Fig. 18: Brodie abscess. A: Anteroposterior radiograph of the elbow demonstrates a well-defined radiolucent lesion (arrow) with surrounding sclerosis at the proximal radial metaphysis. Notice the sclerosis fades into the surrounding marrow (a sign indicative of Brodie abscess), unlike the sharp border of sclerosis frequently seen in neoplastic lesions. B, C: The corresponding sagittal MR images, the lesion (arrows) is hypointense, feature a multizone configuration and is surrounded by extensive marrow edema (arrowhead). Also note reactive joint effusion (asterisks) and surrounding fascial edema.
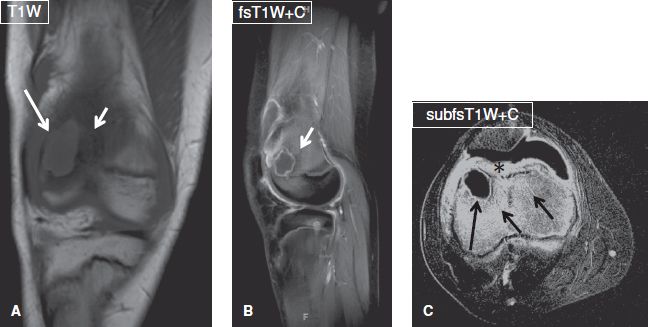
Fig. 19: Brodie abscess. Coronal (A), sagittal (B), and axial (C) images exhibit a well-defined ring-enhancing T1 hypointense lesion (long arrows) at the femoral metaphysis, which is surrounded by edematous and hyperemic marrow (short arrows) and feature a multizone periphery. Notice the intense enhancement of the prefemoral fat pad (asterisk) and synovium, in keeping with associated septic arthritis.
Inadequately treated infection leads to chronic OM, which is defined as persistent infection for more than 1 to 3 months. It is characterized by bone necrosis and sequestrum formation. On MR imaging, there is cortical thickening, bone expansion, and remodeling. As opposed to acute OM, in chronic OM, the tissue planes are better defined, and there is a sharp interface between normal marrow and the infectious area, which exhibits low signal on T1W images, mixed signal on T2W images, and enhances minimally to moderately after gadolinium administration. The sequestrum appears as a central area of low signal on all sequences and lacks contrast enhancement, which, in turn, confirms devitalized bone. It might extrude out of the bony opening (cloaca), and the reactive bone around that hole is called the involucrum (Fig. 17). The latter features low signal on all sequences and is separated by the underlying cortical bone by a linear zone of intermediate-to-high signal on fluid-sensitive images. As the infection becomes controlled, the dead cortical bone is incorporated with the involucrum, forming a focus of thickened cortex. The involucrum is more commonly found in infants and children. The cloaca also permits drainage of pus and granulation tissue from the medullary space into the adjacent soft tissues to the skin. This channel of cloaca appears hyperintense on fluid-sensitive fat suppressed images.
Fungal OM is uncommon and generally presents in an indolent fashion. It is usually the result of a fungal (commonly respiratory or urinary) infection, with the organism hematogenously settling in the bone marrow. Whereas any fungus may be responsible, the most common pathogens are Coccidioides immitis (coccidioidomycosis), Blastomyces dermatitidis (blastomycosis), and Sporotrichum schenckii (sporotrichosis). On MR imaging, findings are non-specific, except for a few features, such as multifocal lesions, no or minimal fluid collection, not so pronounced fascial edema, intralesional T1 hyperintensity due to minerals and lesser degree of contrast enhancement of the involved marrow. Recent travel or residence of the patient in the endemic areas, along with imaging evidence of infectious foci elsewhere in the body (mainly in the lungs) suggests the diagnosis (Fig. 20). The final diagnosis is usually established on bone biopsy.
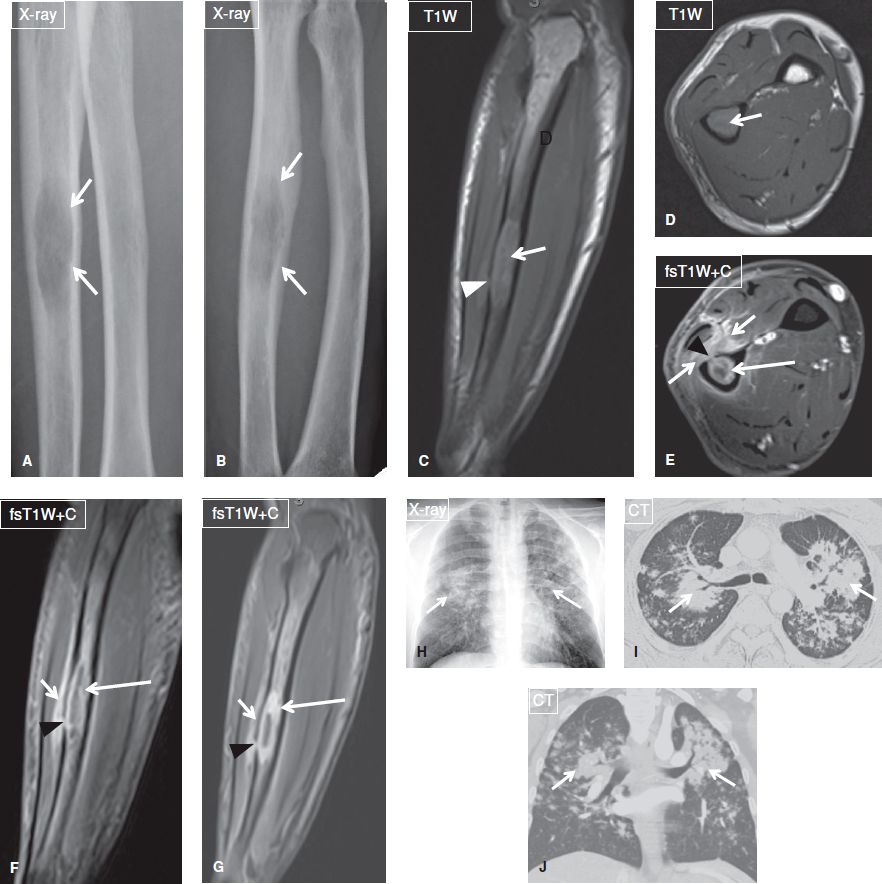
Fig. 20: Fungal (coccidioidomycosis) osteomyelitis. Anteroposterior (A) and oblique (B) radiographs of the forearm reveal an ill-defined radiolucent lesion (arrows) at the ulnar diaphysis. On the respective nonenhanced sagittal (C) and axial (D) MR images, the lesion (arrows) shows intermediate-to-high T1 signal, and is associated with focal cortical disruption (arrowhead in C). E, F: After contrast administration (E–G), the lesion (long arrows) exhibits thick peripheral enhancement, confirming the diagnosis of a necrotic lesion. Through the cortical disruption (arrowheads), infectious/inflammatory material has escaped to the adjacent soft tissues (short arrows), which demonstrate strong enhancement, reflecting hyperemia. Anteroposterior chest radiograph (H), and axial (I) and coronal-reformatted (J) CT images demonstrate bilateral alveolar infiltrates (arrows), mostly in a perihilar and peribrochovascular distribution. Sputum culture and bone biopsy reveal Coccidioides immitis, establishing the diagnosis of coccidioidomycosis pulmonary infection and fungal osteomyelitis.
Chronic recurrent multifocal osteomyelitis (CRMO) refers to an autoinflammatory disorder of children and young adults, which is characterized by non-bacterial OM. Patients typically present with multifocal bone pain secondary to sterile osseous inflammation, and the disease exhibits a relapsing and remitting course. CRMO is a diagnosis of exclusion based on the following criteria: Lack of causative organism; no abscess formation, fistula, or sequestra; atypical location compared with infectious OM, frequent involvement of the clavicle, and multifocality. MR imaging, and recently whole-body MR imaging, enable evaluation of the true extent of the disease because the latter often shows greater marrow involvement than suspected on radiographs. On MR images, there is marrow edema and heterogeneous contrast enhancement, often with periosteal new bone formation. Abscess formation is very unusual (Figs. 21, 22).
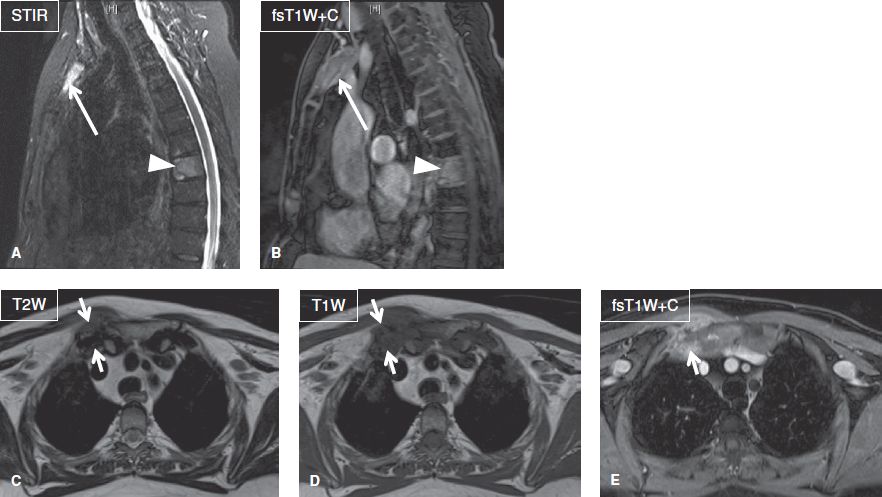
Fig. 21: Chronic recurrent multifocal osteomyelitis with SAPHO syndrome. Sagittal (A, B) and axial (C–E) images demonstrate marrow edema and contrast enhancement of the T8 vertebral body (arrowheads) and manubrium of the sternum (long arrows) indicative of osteomyelitis. Also note severe inflammatory arthropathy of the right sternoclavicular joint (short arrows).
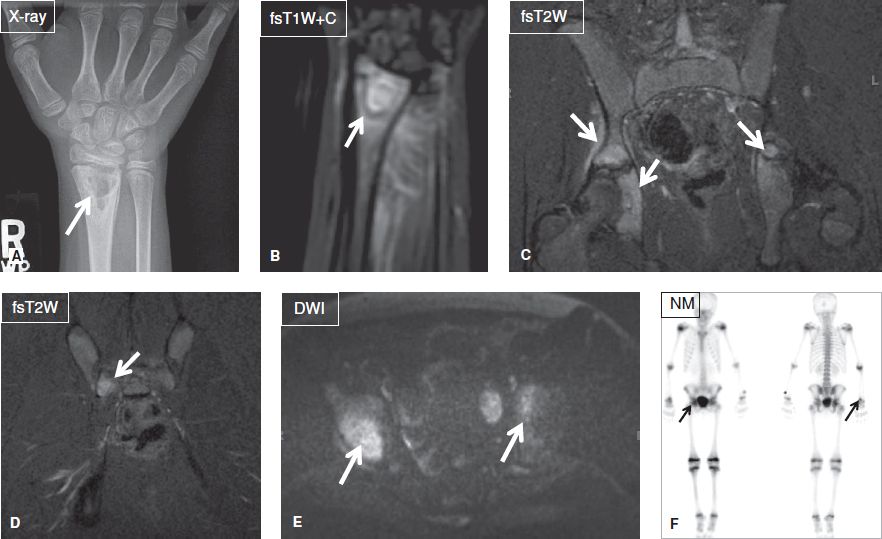
Fig. 22: Chronic recurrent multifocal osteomyelitis. A: Anteroposterior radiograph shows a well-defined multilocular lytic lesion (arrow) at the radial metaphysis. B: On the respective MR image, the lesion (arrow) and adjacent marrow enhance intensely, reflecting hyperemia. C–E: Coronal images of the pelvis exhibit multiple areas (arrows) of marrow edema and enhancement, reflecting infectious foci. F: On the bone scintigraphy Tc99 m MDP scan, the above foci (arrows) all demonstrate increased radionuclide update.
Since the body’s own immunologic response is less effective in areas of impaired vascularity, patients with sickle cell disease show increased incidence of bone infarction and OM. In these individuals, bone infarcts tend to occur in the epiphyses, frequently in the femoral and humeral heads, and these lesions are more often bilateral compared to avascular necrosis in other diseases. The most typical cause of OM in sickle cell disease is Salmonella. Differentiation between the two entities is important for treatment purposes and is based on fsT2W and post-contrast T1W images. Whereas both entities present with reactive marrow edema and surrounding hyperemia, acute infarcts demonstrate thin, linear rim contrast enhancement, in contrast to acute OM, which shows more geographic and irregular marrow enhancement. In addition, acute OM may be associated with subperiosteal or intraosseous fluid collection, a feature, which is not evident in acute infarcts (Fig. 23). Finally, bone pain in sickle cell disease is much more common in acute infarct as compared to acute OM. The final diagnosis is, however, established on blood culture or bone aspiration/biopsy.
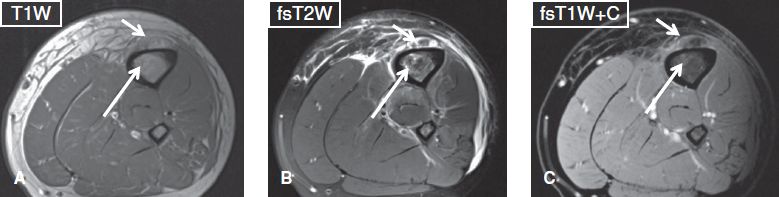
Fig. 23: Subperiosteal abscess. Axial images (A–C) show periosteal elevation along with an underlying ring-enhancing fluid collection (short arrows), in keeping with subperiosteal abscess. Also note tiny enhancing T1 hypointense, T2 hyperintense foci (long arrows) in the marrow, which correspond to osteomyelitis.
The differential diagnosis for acute OM related bone marrow edema pattern includes bone contusions and fractures, non-infectious inflammatory and metabolic bone lesions, histiocytosis, osteoid osteoma, Ewing’s sarcoma, bone infarct, leukemia, and metastases (Fig. 24). Therefore, clinical history and findings frequently assist in establishing the correct diagnosis. Subacute OM, in particular, can mimic a neoplasm (most often Ewing’s sarcoma), in both clinical manifestations and imaging findings. Helpful discriminators of infection versus neoplasm include the rim sign, which refers to a well-defined rim of low signal intensity surrounding the active disease on all sequences, and the penumbra sign, which appears on T1W images as a discrete and relatively hyperintense zone of transition between the intermediate-to-low signal intensity abscess cavity and the adjacent edematous or sclerotic bone marrow.
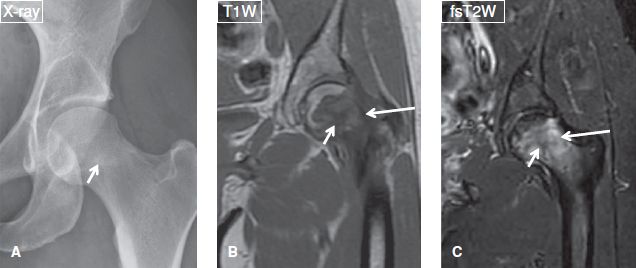
Fig. 24: Anteroposterior radiograph (A) and corresponding coronal MR images (B, C) show an intratrabecular fracture (short arrows) with a background of marrow infiltration caused by leukemia (long arrows). Notice absence of lesion conspicuity on the radiograph, not uncommon with round cell or other marrow infiltrative lesions.
In diabetic patients, the infectious lesions occur at the site of bony protrusion or ulceration. For evaluation of toe OM, one should obtain sagittal images, otherwise the deformities (hammer toe/claw toe) related to diabetic neuropathy and vasculopathy make the assessment of marrow infiltration quiet challenging (Fig. 25). In addition, neuropathic arthropathy (NpA) of the foot may be challenging to differentiate from OM. The imaging features that assist in differentiating the two entities include the following:
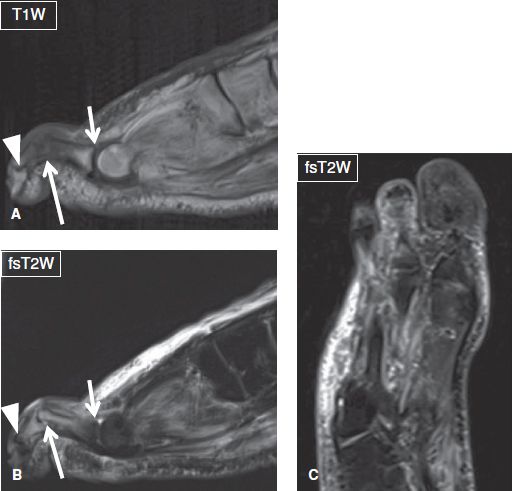
Fig. 25: Osteomyelitis with hammertoe deformity in a patient with diabetes mellitus. A, B: Sagittal images show flexion deformity of the third proximal interphalangeal joint (long arrows), with hyperextension of the respective metatarsophalangeal (short arrows) and distal interphalangeal (arrowheads) joints. Notice osteomyelitis with septic arthritis at the PIP joint and overlying cellulitis. C: The corresponding coronal (long axis) image detects the abnormal configuration of the forefoot but is unable to characterize the lesion.
 Soft tissue changes, with the overlying skin being edematous but intact in NpA; but commonly featuring an ulcer, abscess, and/or sinus tract in OM (Fig. 26)
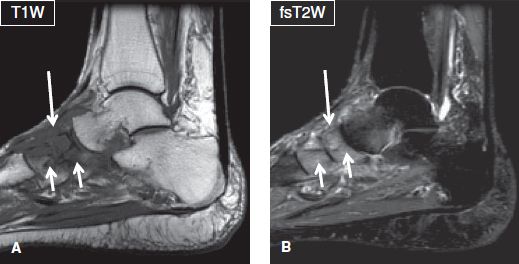
Fig. 26: Neuropathic arthropathy. Sagittal images (A, B) demonstrate architectural distortion of the midfoot joints, bony fragmentation, and marrow edema of the articulating tarsal bones (short arrows), as well as edema of the surrounding soft tissues (long arrows). There is no skin ulceration, collection, or sinus tract to suggest superimposed infection.
 The pattern of bone marrow edema, which tends to be diffuse in OM and, predominantly subchondral in NpA. Associated fascial edema or subperiosteal fluid is seen in infections as compared to NpA.
 The bone distribution, with OM usually involving one or two bones in a weight-bearing region (e.g., toes, metatarsal heads, calcaneus, dorsal aspect of phalanges in hammer toes) and NpA commonly involving multiple bones, usually in midtarsal joints of midfoot and often occurs bilaterally
 Typical presence of bone and joint deformity in NpA, a feature uncommon in OM unless there is underlying NpA
 Extensive cystic changes of the bones (common in NpA, cysts usually become inconspicuous with superimposed infection and reappear with resolution of infection)
 Finally, diffuse dark bones on all imaging sequences are only noted with NpA
There [<is no> <is>] large joint effusion.
A large joint effusion at or adjacent to a site of infection is highly suspicious for septic arthritis. In most instances, it is impossible to define the cause of infectious synovitis (Fig. 27). In the latter case, the effusion is often complex, features intermediate T1 and T2 signal, and is commonly associated with features of synovitis (synovial thickening and intense contrast enhancement), perisynovial edema, and capsular outpouchings (Fig. 28). If present, intra-articular gas bubbles appear as foci of signal void. Subacute and chronic cases may additionally feature joint erosions and rim-enhancing abscesses. It is important to know that absence of joint effusion does not exclude septic arthritis, and definite diagnosis should be based on joint aspiration. If dry joint tap is received, it is prudent to instill saline into the joint and aspirate back to send for Gram stain and culture sensitivity. One will see excessive white cell count with predominance of polymorphs, and leukocyte esterase test can be performed to augment the diagnostic accuracy. Septic arthritis is considered an orthopedic emergency because delayed diagnosis and treatment may result in disabling joint destruction.
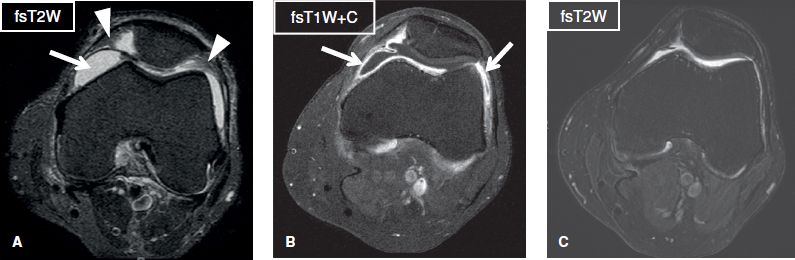
Fig. 27: Lyme synovitis. Axial images. A: There is moderate joint effusion (arrow) with synovial proliferation (arrowheads) of the knee joint. B: The synovial membrane shows homogeneous thickening and strong enhancement (arrows), suggestive of hyperemia/inflammation. C: Follow-up image while on treatment reveals resolution of effusion and synovial thickening.
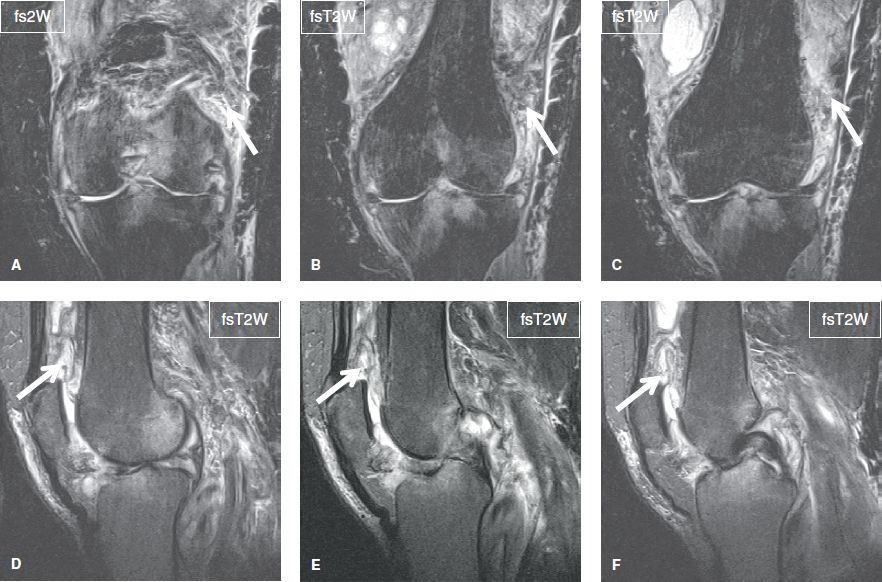
Fig. 28: Septic arthritis. Sequential coronal (A–C) and sagittal (D–F) images show heterogeneous moderate joint effusion (arrows) along with extensive diffuse edema of the surrounding soft tissues and areas of reactive bone marrow edema.
Incidental Findings
Foreign bodies are typically located within the inflammatory area, and these demonstrate variable features depending on their substance (signal void, susceptibility artifacts, etc.). Occasionally, a sinus tract is identified adjacent to the foreign body, demarcating the route of entrance within the soft tissues. The sinus tract and foreign body are particularly well seen on intravenous contrast examination. Correlation with radiographs is useful to distinguish soft tissue gas from a foreign body or calcification.
Post-Gadolinium Discussion
Studies that are entirely normal based on unenhanced sequences should not be complemented with intravenous gadolinium. Gadolinium administration, however, improves the conspicuity and defines the extent of the inflammatory process already visible on fluid-sensitive images. Post-contrast images also assist in upgrading the severity of the inflammation and in detecting additional marrow and soft tissue abscesses, as well as cortical destruction. Contrast-enhanced images are also useful in distinguishing abscesses from surrounding cellulitis/myositis. In OM, the role of contrast administration is not only to establish the diagnosis, but also to delineate the extent of the infection, assess for devitalized (nonenhancing) tissues, cortical involvement, and detect potential sequestrum. It is important to remember that lack of contrast enhancement rules out infection with a high degree of certainty. However, gadolinium administration cannot be used to reliably distinguish infectious from non-infectious inflammatory conditions.
Spinal Infections
Spondylodiskitis and vertebral OM are the most common types of spinal infections. In spondylodiskitis, there is obliteration of the intranuclear cleft and reduction of the disk height whereas both the disk and the adjacent endplates demonstrate low and high signal intensity on T1W and T2W images, respectively (reflecting edema) and enhance after gadolinium administration (reflecting hyperemia). Concomitant irregularity, erosions or bony sclerosis of the endplates, and long areas of edema and enhancement along the longitudinal ligaments assist in differentiating the condition from Modic type I changes, which can assume similar signal intensity changes. Epidural or paravertebral abscesses may coexist (Fig. 29).
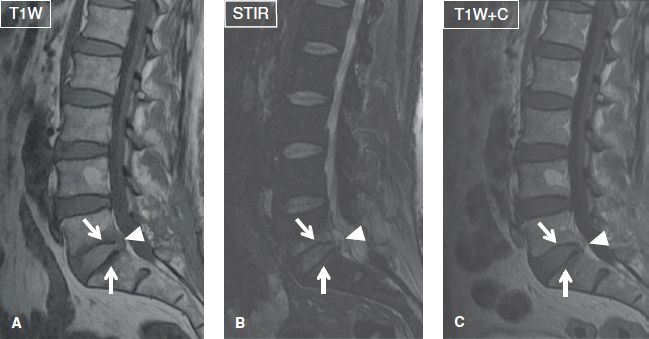
Fig. 29: Spondylodiskitis with epidural abscess. Sagittal images (A–C) demonstrate marrow edema and contrast enhancement of the opposing endplates (arrows) at the L5–S1 level, along with a small, peripherally enhancing fluid collection (arrowheads) in the epidural space.
Related posts:

Stay updated, free articles. Join our Telegram channel

Full access? Get Clinical Tree


