Growth and Development

Chapter 23 Growth and Development


Children are distinguished from people in other age groups by physical growth and developmental changes that are ongoing, normative, and expected. These changes usually proceed in an orderly progression that allows for individual variation. The family physician must be familiar with the range of normal physical and developmental changes that occur in the process of providing health supervision to children.


Growth is a dynamic process in which increasing cell size and number in various tissues result in a physical increase in the size of the body as a whole. Simultaneously, development occurs as tissues differentiate in form and mature in function, reflecting the person’s genetic heritage and environmental interaction. Nutritional, family, emotional, sociocultural, and community influences as well as physical factors play a role in shaping the child’s psychological and physiological development (Vaughan and Litt, 1992). The child responds emotionally to a particular stimulus in an apparently innate and characteristic style that reflects his or her temperament.


Knowledge of normal as well as abnormal patterns of growth and development enables the physician to assist the child in maximizing his or her fullest potential. Growth in height and weight is a sensitive reflection of a child’s general health. Deviations from normal can reflect the presence of physical illness or a disturbance in the child’s environment. Box 23-1 lists some significant causes of growth abnormalities.


Care of Children in Family Medicine


Family physicians have the opportunity to provide family-centered pediatric care in the context of the child’s family and community. The office should be “child friendly” and child safe with at least one room equipped to evaluate the child’s physical growth. Blood pressure cuffs should be available to measure a child’s blood pressure, at least from age 36 months and older. Electrical outlets and cords should be secured and potentially hazardous chemicals and biohazard bins stored either out of reach or under lock and key from curious young toddlers. Guidelines for the frequency of “well child” or “well teen” visits are available from the American Academy of Pediatrics (AAP) Bright Futures: Guidelines for Health Supervision of Infants, Children, and Adolescents (Hagan et al., 2008).


Initial history for a new infant or child includes the birth history, nutritional history (e.g., breastfed vs. bottle-fed), developmental milestones achieved, immunization record, and environmental history (e.g., do parents smoke?) Later, the physician or staff will also perform anticipatory guidance, including injury prevention and the need to immunize against vaccine-preventable diseases.


Observation of the parent-child interaction informs the physician about the relationship between parent(s) and the child, especially with infants and young children. The parent sitting in a chair reading a magazine while her young infant teeters on an exam table engenders more concern than the parent who is standing next to the child or has him in her lap. Observation of the child’s appearance, alertness, muscle tone, state of hydration, and respiratory status also raise or lower the index of concern about a child. The cardiorespiratory examination is often done best if the child is sitting or lying on a parent’s lap, whereas examination of the abdomen, genitalia, and hips is generally done on the exam table. The HEENT examination is often done last because it is the most likely to provoke discomfort.


Blood Pressure Monitoring


Hypertension has become increasingly common in children and adolescents. Since 1988, the prevalence of high blood pressure has increased, especially for certain populations, such as Mexican-Americans and blacks (Din-Dzietham et al., 2007). The rising rate of obesity, particularly truncal obesity, at least partly accounts for this. Because of potential end-organ damage and cardiovascular risk in adulthood, auscultatory monitoring of blood pressure (BP) is recommended during health care visits for all children 3 years and older and for younger children with certain high-risk features (Box 23-2). Automatic devices may be needed to measure BP in young infants. Elevated BP should be confirmed on repeat visits. The guidelines define hypertension as average systolic or diastolic BP of 95% or higher for gender, age, and height on three or more occasions. Prehypertension is defined as values of 90% or greater and less than 95%. For adolescents, BP greater than or equal to 120/80 mm Hg but less than 95% is defined as prehypertensive. Because of the inclusion of a diverse population, these guidelines and tables appear applicable to all ethnic groups (see eTables 23-1 and 23-2 online at www.expertconsult.com).


The approach to confirmed hypertension in children should be individualized and should consider variables such as comorbidities and family history. In overweight or obese children, the possibility of metabolic syndrome should be investigated. Lifestyle changes, including diet and exercise, may be sufficient for overweight children with stage 1 hypertension (BP at 95% to 99% plus 5 mm Hg). Children with stage 2 hypertension (BP >99% plus 5 mm Hg) and those with end-organ damage likely require medical therapy (National High Blood Pressure Education Program Working Group, 2004).


Measuring Physical Parameters of Growth


Key Points


Weight, length, and head circumference are the most useful routine measurements in infants. Total body length in children up to age 2 is obtained most accurately by placing them in the recumbent position and measuring from crown to heel. The child’s head is placed perpendicular to the surface touching a fixed plate, the hips and knees are fully extended, and the soles of the feet are placed against a sliding board. Older children should have their shoeless standing height measured with a stadiometer with their heels and back touching the wall. Regardless of age, the head should be positioned so that the outer canthus of the eye is aligned with the external auditory canal and perpendicular to the measuring surface (Halac and Zimmerman, 2004). Children should ideally be weighed on the same scale at each visit. Infants should preferably be weighed nude; older children may wear light clothing but not shoes. Height and weight are then plotted on age- and gender-appropriate growth charts developed by the National Center for Health Statistics (NCHS) (see eFig. 23-1, A-H, and Web Resources).


Body mass index (BMI) is a reliable indicator of body fatness for most children and teenagers that is age and gender specific. A BMI less than the 5th percentile for age is underweight, from the 5th to 85th percentile is healthy weight, from the 85th up to 95th percentile is overweight, and the 95th percentile or greater is considered obese (CDC, 2009). BMI charts are also available from the same website.


Head circumference reflects the growth of the cranium and its contents. It should be determined and recorded at all routine physical examinations during the first 2 years of life. This also may be done as part of the initial examination at any age. A nonstretchable measuring tape (usually paper or flexible plastic) is used to obtain the greatest circumference encompassing the occipital, parietal, and frontal prominences. A small head circumference (microcephaly) may be familial; caused by craniosynostosis, congenital viral infections, fetal drug syndromes, or underlying structural abnormalities; or secondary to trauma, infection, or dysmorphic syndromes. A large head circumference (macrocephaly) most often is caused by hydrocephalus, but it may be familial, caused by intracranial bleeding or masses or thickening of the skull, or associated with fragile X syndrome and other conditions (Green, 1986).


Proper Use and Interpretation of Growth Charts


The growth charts shown in eFigure 23-1 online were revised by NCHS (2000) from surveys of generally well-nourished children representing a cross section of ethnic and economic groups in the United States. These graphs provide a normal range of weight and length or height for a given chronologic age. Recumbent length is recorded on the chart for children from birth to 36 months, and standing height is recorded on the chart for children from 2 to 18 years. Premature infants should have their chronologic age adjusted according to their degree of prematurity up to age 2 years, because most catch-up growth is complete by this time. Although a height or weight above the 95th percentile or below the 5th percentile should alert the physician to a possible problem, these can represent the outer fringe of the normal range.


Linear growth in infants has been shown to occur in incremental bursts rather than continuously (Lampl et al., 1992). A growth curve constructed by a series of heights and weights taken over time allows the physician to compare current growth with the child’s previous pattern. The linear growth velocity, or rate of gain in height, decreases from 25 cm per year during the first year of life to a prepubertal rate of 5 to 6 cm/yr by age 6 or 7 years (Miller and Zimmerman, 2004). The rate accelerates during puberty. A child whose growth curve parallels the normal curve regardless of the child’s absolute percentile has a normal rate of growth for that particular child. In comparison, a child whose height or weight crosses multiple percentile lines or whose linear growth rate drops below 4 cm/yr requires further evaluation for nutritional, psychosocial, or organic problems that could impede or accelerate growth (Lipsky and Horner, 1988). Children with genetic short stature have normal length and weight at birth, but their growth percentiles decline within the first 2 to 3 years of life as they reach their genetic potential (Halac and Zimmerman, 2004).


Although careful measuring and plotting of growth parameters is the most accurate method by which to follow a child’s physical growth, approximate growth guidelines are helpful to the physician in remembering and forming an overall impression of the child’s progress (Table 23-1).


Table 23-1 Approximate Growth Guidelines for Children


Age Length or Height (ht) Weight (wt)
Newborn 50 cm (20 inches) average 3.4 kg (7.5 pounds) average
Newborn to 3 months 1 kg/month (1 oz/day) average wt gain
3-12 months

12 months 75 cm (30 in) average Triples birth weight
12-24 months Increases by >10 cm/yr 0.25 kg/month
>5 years >5 cm (2 in)/yr until adolescent growth spurt 2.3 kg (5 lb)/yr until adolescent growth spurt
2-12 years

Ht (in) = [Age (yr) × 2.5] + 30 (e.g., 4-year-old = 40 inches)


Puberty 8-14 cm/yr  

Modified from Needleman RD. The first year. In Behrman RE, Kliegman RM, Jenson HB (eds). Nelson Textbook of Pediatrics, 17th ed. Philadelphia, Saunders, 2004, p 31.


Familial Short Stature and Constitutional Growth Delay


Each child has a different rate of maturation, or what Boas termed “tempo of growth” (Tanner, 1986). Persons with short stature are more than 2 standard deviations (SD) below the mean in height and constitute approximately 2.5% of children (Miller and Zimmerman, 2004). If a child’s growth falls outside the range of normal, it is useful to obtain a bone-age radiograph, usually of the left hand and wrist, and compare it to age-specific standards. Children must be at least 2 years of age to reliably identify epiphyseal ossification centers. Box 23-3 lists some causes of retarded or accelerated bone age. Calculation of mean predicted adult height is also useful in determining whether a child is fulfilling her or his genetic potential. The mean predicted adult height is calculated as follows (Rogol, 2004):


image


Children and adolescents of short stature whose bone age is delayed relative to their chronologic age have more growth potential than do children with a skeletal age appropriate for their chronologic age. If an organic cause of short stature has been excluded, children with delayed bone age are likely to have constitutional growth delay. The majority of these children are boys who were of normal length and weight at birth. Their growth rate decelerates during the first 2 years of life and subsequently returns to normal. The children then follow a lower percentile on the growth curve until the onset of their pubertal growth spurt and development, which often occurs later than their peers. There is usually a family history of delayed growth and development (Bareille and Stanhope, 1998). The bone age of these children equals their height age, which is the age at which their height plots on the 50th percentile of the growth chart.


Children with familial short stature usually have parents or close relatives who are short. They often have normal birth weight and length, but their growth rate declines during the first 2 to 3 years of life. Their growth curve subsequently parallels the normal curve but falls below the fifth percentile (Bareille et al., 1998). Their bone age is approximately equal to their chronologic age but less than their height age. These children usually enter puberty at the appropriate age. The U.S. Food and Drug Administration (FDA) has approved the use of recombinant growth hormone for the treatment of idiopathic short stature. This can result in an increase of predicted height of more than 7 cm (Miller and Zimmerman, 2004). Because of potential side effects and the high cost, treatment should be undertaken in consultation with a specialist in pediatric growth disorders.


Pubertal Growth and Development


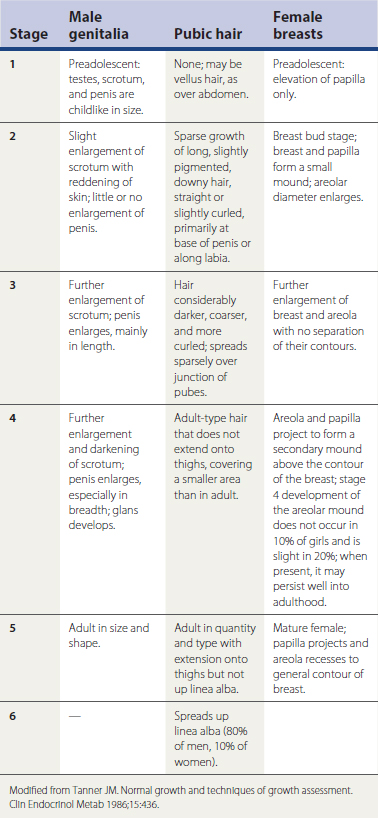
All children grow at a different tempo, with some maturing earlier than others and some later. This difference is most apparent during puberty. The NCHS growth charts now extend to age 20 years. Tanner and Davies (1985) took the earlier NCHS data and constructed height and weight velocity curves for American boys and girls that account for those groups who mature earlier and later. These charts also allow for notation of the various stages of puberty described by Tanner (1986) (Table 23-2).


The onset of puberty generally occurs at age 9 in American girls, with the peak height velocity occurring at age 11.5 years (range, 9.7 to 13.5 years for early to late maturers). American boys have onset of puberty at age 11 and peak height velocity at 13.5 years (range, 11.7 to 15.3 years) (Tanner and Davies, 1985). Because boys have two additional years of prepubertal growth and a peak height velocity greater than that of girls, their ultimate height is usually taller. Head, hands, and feet are first to reach their adult size, followed by leg length, trunk length (which accounts for much of the spurt), and body breadth. Pubertal boys develop greater shoulder breadth than do pubertal girls, who develop wider hips. Adolescents can be reassured that their bodies eventually will become more proportionate with their hands and feet. Boys ultimately gain greater muscle size and strength than do girls, while losing limb fat. This results from their increased secretion of testosterone, which also increases red cell mass and hemoglobin (Tanner, 1986).


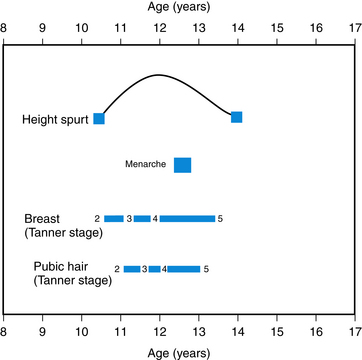
The adolescent growth spurt in skeletal and body dimensions is associated closely with the development of the reproductive system. Although the onset and rate of maturation vary according to the individual, the sequence is usually the same within genders (Figs. 23-1 and 23-2). Girls who demonstrate signs of puberty before 7 to 8 years of age and boys who show signs before 9 years should be evaluated for precocious puberty. Conversely, girls who do not show signs of puberty by age 13 and boys by age 14 should be evaluated for pubertal delay (Plotnick, 1999).


The first sign of puberty in boys is an increase in growth of the testes and scrotum, with reddening and wrinkling of the scrotal skin. Pubic hair appears within 6 months, followed by phallic enlargement in 12 to 18 months and peak height velocity 2 to 2.5 years after testicular enlargement (Copeland, 1986). Axillary hair usually appears 2 years after the beginning of pubic hair growth (stage 4 pubic hair), but there is considerable variability. Some boys may have enlargement of the breasts midway through adolescence. Following the attainment of peak height velocity, boys develop mature spermatozoa, full facial hair, and voice change. However, breaking of the voice is a late and often gradual process.


In girls, the breast bud is the first sign of puberty, and the pubertal growth spurt typically occurs concurrently, peaking at stage 3 breast and pubic hair. The uterus and vagina develop simultaneously with the breast, but menarche usually does not occur until stage 4 breast and pubic hair. Although the peak height velocity has been passed, girls may grow an average of 6 cm more after menarche. Early cycles may be irregular and anovulatory, but early sterility should never be presupposed (Tanner, 1986).


Screening Healthy Children


Key Points


Preventive care services for children often include screening for health conditions in which early detection and early treatment can prevent or ameliorate more serious disease in the future. Screening tests should detect most persons with the condition (sensitivity) while excluding most persons who do not have the condition (specificity) in a cost-effective manner. In an inner-city Medicaid population, high continuity of care in infancy was associated with improved screening for anemia, lead, and tuberculosis (Flores et al., 2008).


Hearing and Vision Screening


Early detection and intervention for hearing and vision deficits are important for maximal long-term functioning. Without appropriate opportunities to learn language, children with significant hearing deficits fall behind peers in terms of communication, cognition, reading, and social-emotional development, with long-term effects on educational attainment and adult employment (AAP Joint Committee on Infant Hearing, 2007). It is now recommended that all infants be screened for hearing loss by 1 month of age, regardless of risk factors. Those who do not pass the screening should have a complete audiologic evaluation by 3 months of age, and those with confirmed hearing loss should receive appropriate treatment by 6 months to ensure optimal outcome. Regardless of the outcome of newborn screening, ongoing surveillance of hearing status is recommended. Developmental delays and other risk factors (Box 23-4), particularly in language, as well as the presence of parental concern about hearing, should prompt referral for a complete audiologic evaluation, even if the newborn screen was normal and there are no risk factors for hearing impairment (Hagan et al., 2008). Gradations of hearing loss are presented in Table 23-3.


Table 23-3 Hearing Loss Scale


Hearing impairment Hearing threshold (dB)
None 10-25
Mild 26-40
Moderate 41-55
Moderate to severe 56-70
Severe 71-90
Profound >91

Eyesight evaluation is a recommended part of routine health maintenance examinations in children beginning in the newborn period. In young children (<3 years) the evaluation, besides the actual eye examination, is somewhat subjective and based on parental history. Children with risk factors, such as prematurity, family history of retinoblastoma or glaucoma, or significant developmental delays or neurologic difficulties, should be referred to an experienced pediatric ophthalmologist. More formal testing of visual acuity should begin at age 3 years, using standardized systems such as the Allen Cards, which have easily recognized pictures (AAP Committee on Practice and Ambulatory Medicine, 2003). Normal visual acuity is in the 20/30 to 20/40 range for children 3 to 4 years old, but increases to 20/20 by early school age. Eye-specific screening should be attempted in an effort to detect amblyopia (more than one line difference on the chart) (SOR: B). The suspicion of amblyopia or strabismus requires further evaluation to prevent long-term visual loss (AAP Committee on Practice and Ambulatory Medicine, 1996). Routine screening should be done at least through early school age, at puberty and whenever there are other signs, such as squinting or complaints of inability to see the board at school (Hagan et al., 2008).


Screening for Lead Toxicity


Lead is neurotoxic and affects both intellectual and behavioral function, even below the 10 μg/dL level established by the U.S. Centers for Disease Control and Prevention (CDC) and World Health Organization (WHO) (Canfield et al., 2003). Federal Medicaid law has required lead screening of young children eligible for Medicaid at ages 12 months and 24 months, and for children ages 36 to 72 months not previously tested. However, 1999−2004 NHANES data demonstrate that the percentage of children with blood lead levels of 10 μg/dL or higher had decreased to 3.4% for black and 1.2% for white children age 1 to 5 years. The USPSTF finds insufficient evidence to recommend for or against screening asymptomatic children 1 to 5 years old who are at increased risk. The CDC recommends targeted screening of specific groups of children, except in areas where universal screening is still recommended because of a prevalence of elevated lead levels. Specific state information can be obtained at http://www.cdc.gov/nceh/lead. Children considered at risk who require screening include (1) those suspected by a parent or health care provider to be at risk for exposure; (2) those with a sibling or frequent playmate with an elevated blood lead level; (3) those with a parent or caregiver who works professionally or recreationally with lead; (4) a household member uses traditional folk or ethnic remedies or cosmetics; or (5) family designated at increased risk for lead exposure by the health department because of local risk factors for lead exposure, such as residing in a high-risk zip code (Wengrovitz and Brown, 2009).


Nutrition


Key Points


Infancy through Adolescence


Proper physical growth and appropriate cognitive development depend on adequate nutrition. Infants and young children with severe iron deficiency anemia were found to have significantly lower verbal and full-scale IQ scores and lower achievement test scores in arithmetic and writing than non-iron-deficient infants, even 10 years after treatment (Lozoff et al., 2000). An increase in behavioral problems was also reported, although this could not be directly linked to the preceding iron deficiency. In the Third National Health and Nutrition Examination Survey (NHANES III, 1988–1994), 7.2% of 12- to 16-year-old girls had iron deficiency, but only 1.5% demonstrated anemia (Halterman et al., 2001). Adolescent iron-deficient girls scored significantly lower math scores compared with non-iron-deficient girls. Vitamin D deficiency and insufficiency in children and adolescents has been reported worldwide, including North America (Wagner and Greer, 2008). Mealtime also represents a time for social interaction within the family unit, whether this is the bonding of mother and child during breastfeeding or discussion of the day’s events during dinnertime.


Although malnutrition is still a problem in the United States, inappropriate nutrition, especially calorie-nutrient imbalance leading to overweight and obesity, has become commonplace. Recent NHANES studies demonstrate that the prevalence of overweight (BMI ≥95%) in girls 2 to 19 years old increased from 13.8% in 1999–2000 to 16% in 2003–2004, and the prevalence of overweight in boys 2 to 19 years old increased from 14% to 18.2% (Ogden et al., 2006). Increased pediatric BMI is associated with high blood pressure, sleep apnea, asthma, polycystic ovarian syndrome, type 2 diabetes, gastroesophageal reflux, and orthopedic problems (Benson et al., 2009). A nationwide survey of more than 6000 children and adolescents found that at least 30% consumed “fast food” on a typical day. These children consumed more total fat, total carbohydrate, more added sugars and sugar-sweetened beverages, less milk, and fewer fruits and nonstarchy vegetables than children who did not eat fast food (Bowman, 2004). The odds of having a BMI of 85th percentile or higher was more than four times that for 10- to 15-year-old children viewing more than 5 hours of television per day compared with those watching for 0 to 2 hours (Gortmaker et al., 1996). A survey of low-income preschool children in New York State found that children with a TV set in their bedroom watched 4.8 hours more TV/video than those without a bedroom TV. In this group the prevalence of child overweight (BMI >85%) was associated with an odds ratio of 1.06 for each additional hour per day of TV/video viewed (Dennison et al., 2002). Frequent television viewing can lead to decreased activity, excessive snacking on high-calorie junk foods, and subsequent obesity (Dietz and Gortmaker, 1985). In contrast, dieting in pursuit of the media’s representation of the ideal woman can lead to eating disorders, such as bulimia or anorexia. The CDC has proposed 24 strategies to prevent obesity in the United States, including increasing the availability of healthier food and beverage choices, restricting the availability of less healthy foods and beverages in public service areas, and increasing the amount of physical activity in schools (Khan et al., 2009).


Infants and Toddlers


Infants require approximately 120 kcal/kg/day to meet basal metabolic requirements and the energy demands of growth and activity during the first 6 months of life. Low-birth-weight (LBW) newborns may require 130 to 150 cal/kg/day for catch-up growth (Klish, 2009). Weight gain should be 25 to 30 g/day during the first 3 months of life, decrease to 15 to 20 g/day between 3 and 6 months of age, and decrease to 10 to 15 g/day between 6 and 12 months (AAP, 2009). Energy requirements are increased by greater physical activity, stress imposed by disease processes (e.g., cystic fibrosis), or symptoms (e.g., fever). Fever can increase the fluid requirements of infants younger than 6 months beyond the usual 130 to 190 mL/kg/day (Barness and Curran, 1996).


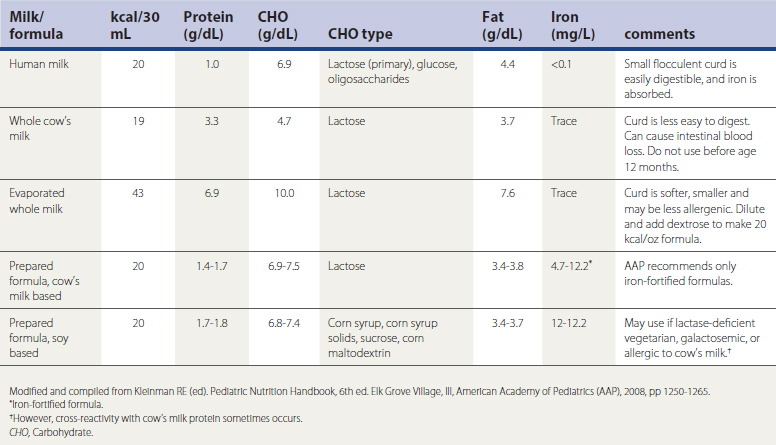
The composition of human milk varies by time, day, and maternal nutrition and from woman to woman. Infant formulas contain about 50% more protein than human milk and, like breast milk, provide 40% to 50% of energy as fat (Table 23-4). Beginning at 2 years of age, fat calories should decrease to approximately 30% of total energy consumption, with less than 10% of calories from saturated fat, and dietary cholesterol less than 300 mg/day (AAP, 2009).


The ideal food for full-term infants during the first 12 months of life is human milk. Oliver Wendell Holmes once noted, “A pair of substantial mammary glands has the advantage over the two hemispheres of the most learned professor’s brain in the art of compounding a nutritious fluid for infants” (Cone, 1979, p. 138). Human milk is fresh, readily available at the proper temperature, and generally free of contaminating bacteria. Its acid-resistant whey proteins include secretory immunoglobulin A (sIgA), α-lactalbumin, and lactoferrin, a whey protein that transports iron and inhibits the growth of a range of organisms in the intestine. The protein in human milk consists predominantly of whey proteins that are of higher nutritional quality and digested and absorbed more easily than cow’s milk proteins (AAP, 2009).


Commercial cow’s milk and soy-based formulas must contain higher levels of protein to compensate for their lower quality (see Table 23-4). However, they are quite acceptable for mothers who are unable to nurse their infants or for parents who wish to bottle-feed their children. Soy formulas are recommended for infants with hereditary lactase deficiency or galactosemia and may be tried in infants intolerant to cow’s milk, but soy formula should not be used in preterm infants. Because some infants allergic to cow’s milk protein will develop an allergy to soy protein, it is advisable to use an extensively hydrolyzed protein formula in cases of true milk allergy or malabsorption. These are lactose free and may contain medium-chain triglycerides to improve fat absorption (AAP, 2009).


Human breast milk or iron-fortified infant formula is recommended for the first 12 months of life. Cow’s milk is not suitable for infants because the higher intake of protein, sodium, potassium, and chloride increases renal solute load. In addition, the lower concentrations of iron, zinc, essential fatty acids, vitamin E, and other micronutrients can result in deficiencies. Significant intestinal blood loss can occur in infants younger than 12 months of age receiving cow’s milk. Very-low-fat milks lack adequate calories for growth despite promoting excessive volume ingestion. Breastfed full-term infants seldom develop iron deficiency anemia before 4 to 6 months of age because the iron present in breast milk is well absorbed. Iron-fortified infant cereal or meats are then good sources of the 1 mg/kg/day of elemental iron required by full-term infants. All preterm or LBW infants should receive at least 2 mg/kg/day of elemental iron from 2 weeks until 12 months of age (AAP, 2009). Parents should be warned that iron is toxic in excessive amounts, and appropriate precautions should be taken.


Children 6 months to 3 years old who do not drink fluoridated water or other beverages may be given 0.25 mg/day of supplemental fluoride. Human milk contains only small amounts of biologically active vitamin D, and rickets has been reported in breastfed infants, infants with darker skin pigmentation, and even older children with minimal exposure to sunlight. Consequently, all breastfed infants, partially breastfed, non-breastfed infants, and older children ingesting less than 1000 mL/day of vitamin D–fortified formula or milk should receive 400 IU/day of supplemental vitamin D daily beginning within the first few days of life until the infant or child is ingesting 1000 mL/day of vitamin D–fortified formula or milk (AAP, 2009). Higher doses of vitamin D may be required in children with chronic fat malabsorption. Vitamin B12 supplementation should be given to breastfed infants whose mothers are strict vegetarians.


Both WHO and AAP promote exclusive breastfeeding for the first 6 months of life. However safe, nutritious solid foods may be introduced between 4 and 6 months of age, when the infant is developmentally ready. The order of introduction of solid foods is generally not critical; however, single-ingredient foods should be tried for 1 week at a time to observe for possible allergic reactions before introducing another food or mixtures of foods. Single-grain infant cereals such as rice (which lacks gluten) are usually well tolerated and provide a source of fortified iron. Homemade infant foods should not have added salt or sugar. Honey is associated with infant botulism and should not be given to infants younger than 1 year. Teething biscuits or finely chopped foods may be given by 8 to 10 months of age. However, foods such as popcorn, nuts, or rounded candies should not be offered to infants or toddlers because of the risks of choking, aspiration, and even death. Potentially hazardous foods such as hot dogs and grapes must be cut into small pieces, and the caregiver should always be present during mealtime. Children should be weaned from the bottle to a “sippy cup” by 12 to 15 months of age and bedtime bottles discouraged because they are associated with dental caries (AAP, 2009).


A toddler’s food intake may be quite variable from day to day or even meal to meal. Because young children cannot choose a well-balanced diet, parents must provide nutritious, safe, developmentally appropriate foods at regular meals and snacks. Children should be sitting in a designated area for mealtime, without distractions such as television (AAP, 2009). Small portions of food should be offered to preschool children, allowing the child to determine how much he or she will eat and offering more as necessary. Excessive portion sizes can contribute to obesity later in life. Guidelines about types and quantities of foods from the basic food groups are available from the U.S. Department of Agriculture (USDA) MyPyramid website (www.mypyramid.gov), which provides recommendations on the amount of grain products, vegetables, fruits, and milk products based on the person’s age, gender, and activity level.


Parents should be counseled that toddlers and preschool children are often picky eaters but generally grow well despite this. Parents need to guide children in their selection of food by offering a variety of nutritious items such as fruits and vegetables, keeping in mind that it can require 8 to 10 exposures to a new food before a child accepts it (AAP, 2009). Mealtime should not turn into a battleground because forcing a child to clean the plate can lead to specific food dislikes or promote obesity in later life. Snacking or eating while watching television should be discouraged, and physical activity should be encouraged.


Healthy children eating a varied diet usually do not require a multivitamin supplement. Children who do not eat dairy products, meat, or eggs require supplemental vitamin B12 and are at risk for vitamin D deficiency, especially if they lack adequate sunlight exposure or have darkly pigmented skin. Children following strict vegetarian diets often have low intakes of iron and calcium that can require supplementation. They often have a low intake of zinc that may be obtained from zinc-fortified infant and adult cereals. The recommended fiber intake is 19 g/day for children 1 to 3 years old and 25 g/day for those 4 to 8 years old. Excessive fiber consumption may decrease the intake of energy-dense foods and inhibit the absorption of some minerals (AAP, 2009).


Children with malabsorption or hemolytic anemia can require additional folic acid. Parents who insist on using a vitamin supplement without any obvious deficiency on the part of the child should be counseled to use a preparation that does not exceed the dietary reference intakes (DRIs) established by the Institute of Medicine and the National Academy of Sciences. In particular, vitamins A and D can produce toxicity if given in excessive doses.

Stay updated, free articles. Join our Telegram channel

Oct 3, 2016 | Posted by in MANUAL THERAPIST | Comments Off on Growth and Development

Full access? Get Clinical Tree

Get Clinical Tree app for offline access