Chapter 13 Fluoroscopic Analysis of Total Knee Replacement
Principles of Fluoroscopy
The number of studies that use fluoroscopy to evaluate in vivo kinematics of normal or implanted joints has dramatically increased in the past decade.*
Kinematic studies involving total knee arthroplasty (TKA) have also been conducted under in vitro conditions using cadavers,20 noninvasive in vivo conditions using gait laboratory systems,5,24 more invasive in vivo conditions using roentgen stereophotogrammetric analysis (RSA),29 and quasidynamic magnetic resonance imaging (MRI) testing.28 Unfortunately, mechanical actuators used to simulate muscles in cadaveric studies do not result in vivo motion. MRI testing is done in a quasidynamic state, which does not fully represent what is happening during dynamic daily activity. Video analysis using markers attached to the skin, similar to what is found in gait laboratory systems, is the most popular form of kinematic analysis because the method is noninvasive and effective in determining in-plane rotations, and can determine kinematics of the whole body. However, soft tissue artifact, the movement of skin markers relative to the bone, induces significant out of plane rotational and translational errors.2,23 These out of plane rotations and translations are the measurements that must be precise when evaluating knee kinematics.
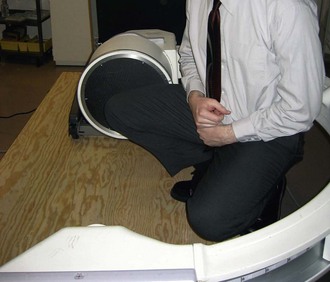
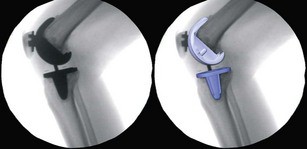
During a fluoroscopic study, the subject is asked to perform a weight-bearing or non–weight-bearing dynamic task while the subject’s joint is under fluoroscopic surveillance (Fig. 13-1). The fluoroscopy video allows for two-dimensional visualization of the joint during this activity (Fig. 13-2). The nature of x-ray images is such that objects closer to the radiation source appear larger than those more distant from the source. This phenomenon allows for measurement of out of plane translation and orientations, even in implant components with symmetrical geometry, because the portion farther away from the radiation source will appear smaller in the silhouette than the portion nearer the source. By matching a three-dimensional computer-aided design (CAD) model of the implant component to the silhouette on the fluoroscopy image, three-dimensional in vivo kinematics can be extracted from a two-dimensional image.
Radiographic Image Prediction
The use of fluoroscopy began with two-dimensional attempts at evaluating in-plane motion and evolved into three-dimensional techniques that recover accurate three-dimensional kinematics. Initial attempts at extracting three-dimensional kinematics used library-matching techniques,9,25 but the current state of the art extracts three-dimensional kinematic data by using a computer-automated, iterative, model-fitting technique.29,37,38
To find the orientation of an implanted TKA component from an x-ray image, the fluoroscopic space is modeled within the computer. The fluoroscope intensifier is modeled by projecting the fluoroscopic image of the joint onto a plane. A virtual camera models the radiation source and allows the user to view the fluoroscopic space within a graphic user interface by setting the camera field of view (FOV) equal to that of the fluoroscopic source FOV. The patient’s implanted components are replaced with the corresponding CAD models, which are virtually placed into the space between the camera and the image projection (see Fig. 13-2).
Viewing the CAD models from the fluoroscope perspective is important for two reasons. It provides an image of the CAD model superimposed (overlaid) on the x-ray image (see Fig. 13-2). This allows the user to supervise the pose estimation process. It also provides a synthetic x-ray image of the component models, consisting only of the component’s shadows (or silhouettes). This image is a prediction of what the x-ray image of the modeled component’s current three-dimensional position would look like. This is updated as the pose of the component models are adjusted and is used by the automated fitting algorithm.
Modeling Methods
To overcome limitations of earlier matching methods, which struggled with noisy or occluded images, an automated interactive kinematic analysis system was developed.37,38 This method is faster and removes human error inherent in manual techniques by using a computerized algorithm to match models with implant silhouettes. The algorithm uses an optimization method known as simulated annealing, an energy minimization routine, to maximize the correlation value. The computer quickly and accurately determines the correct positions and orientations of the TKA implants.
An unbiased error analysis comparison was initially conducted with the same operator using three methods, an early matching technique known as template matching, a manual matching technique, and the current automated matching technique. This was repeated with multiple operators using the three methods. The error analysis determined that the automated model-fitting process outperformed the manual and template-matching methods.37,38 Additionally, the automated method showed higher reproducibility than the manual method—manual (1.1 mm in translation, 0.7 degrees in rotation) and automated (0.2 mm in translation, 0.2 degrees in rotation)—and was faster than the manual method in total time (P = .2) and user time (P = .005).
This automated model-fitting technique accurately determines femoral component rotations and translations relative to the tibial component in three dimensions. Once patients have performed activities while under fluoroscopic surveillance, the video images, recorded at frame rates of 30 or 60 Hz, are digitally captured for use in the computer. Specific frames from the video are imported to the model-fitting software as digital images after some image processing. Within the software, which models the fluoroscopic space as discussed earlier, the user places the femoral component model over the femoral silhouette on the image and runs the automatic fitting software. This is repeated for the tibial component. Both component CAD models are now in the same pose within the virtual fluoroscopic space as the patient’s implanted components within the real-world fluoroscopic space (see Fig. 13-2). The movements of the femur, including femorotibial contact positions, relative to the tibia are calculated. Analyzing subsequent fluoroscopic images yields three-dimensional in vivo kinematic data throughout the weight-bearing activity (Fig. 13-3). The relative process error was determined through an extensive error analysis using a fresh cadaver. Fixed points on a metal tibial and femoral component were defined by drilling indentations into the components. Experimentally finding the positions of these indentations determined the position of the femur relative to the tibia. The automated fitting technique was applied to fluoroscopic video taken of the implanted cadaver and compared with the experimentally obtained orientation of the components. The error was less than 0.5 mm in translation and 0.5 degrees in rotation for all trials.37 The use of higher definition fluoroscopy units will increase the accuracy of the fluoroscopic analysis. The development of tools such as automatic sequential fitting, which fits every frame from a fluoroscopy video at the touch of a button, and mobile fluoroscopy, which is a robot programmed to follow a patient automatically around a room, keeping the joint under fluoroscopic surveillance, will only increase and improve our knowledge of how normal and artificial joints perform in vivo.
Clinical Applications of Fluoroscopy
The automated fitting approach discussed has been used to determine the kinematics of almost 2500 knees, including fixed posterior cruciate–retaining (PCRF), mobile-bearing posterior cruciate–retaining (PCRM), fixed posterior cruciate–substituting (PSF), mobile-bearing posterior cruciate–sacrificing (PCSM), mobile-bearing posterior cruciate–substituting (PSM), fixed anterior cruciate–retaining (ACRF; see Fig. 13-3), bicruciate-stabilizing fixed-bearing (BCSF) TKA and, although not discussed in this chapter but included in kinematic data tables, medial unicondylar knee arthroplasty (MED UKA) and lateral unicondylar knee arthroplasty (LAT UKA). Included in this summary are analyses during stance phase of gait and deep knee bend activity (weight-bearing flexion; Table 13-1). We have routinely analyzed each implant for anteroposterior (AP) femorotibial translation, axial rotation (AR), and incidence of femoral condylar lift-off. We have also determined the AP motions of normal and anterior cruciate ligament–deficient (ACLD) nonimplanted knees using our three-dimensional model-fitting technique by creating three-dimensional models of the bones using computed tomography (CT) scans.37,38
Table 13-1 Distribution of Total Knee Arthroplasty Type for Analysis of Stance Phase of Gait and Deep Knee Bend*
| Knee Type, Procedure | ACTIVITY | |
|---|---|---|
| Gait | DKB | |
| Normal | 10 | 104 |
| ACLD | 5 | 5 |
| PCRF TKA | 83 | 343 |
| PSF TKA | 74 | 457 |
| ACRF TKA | 15 | 34 |
| BCSF TKA | 0 | 95 |
| PCRM TKA | 10 | 107 |
| PCSM TKA | 35 | 76 |
| PSM TKA | 44 | 341 |
| LAT UKA | 7 | 3 |
| MED UKA | 68 | 65 |
| All TKAs | 261 | 1453 |
| Total | 351 | 1630 |
Anteroposterior Translation
Stance Phase of Gait
We have found that from heel strike to toe-off, 9 of 10 subjects having a normal knee experienced posterior motion of their lateral femoral condyle, whereas the medial condyle translated posteriorly in 5 of 10 knees (Table 13-2). The average total condylar motion from heel strike (0% of stance phase) to toe-off (100% of stance phase) was −5.8 mm (4.3 to −23.1 mm; standard deviation [SD], 8.1) and −0.4 mm (10.6 to −19.5 mm; SD, 6.6) for the lateral and medial condyles, respectively. As the direction of knee flexion angle changed from extension to flexion, the lateral condyle translated in the posterior direction. When the angle changed from flexion into extension, the lateral condyle translated anteriorly. Patients who received an ACRF TKA experienced somewhat differing AP kinematic patterns when compared with those patients having a normal knee. Eight of 15 patients (53%) experienced posterior motion of their lateral condyle from heel strike to toe-off, whereas 11 of 15 patients (73%) exhibited posterior motion of their medial condyle. The average condylar motion (from heel strike to toe-off) was −3.7 mm (5.7 to −23.1 mm; SD, 7.4) and −1.6 mm (18.2 to −19.5 mm; SD, 7.7), for the lateral and medial condyles, respectively (see Table 13-2).
Table 13-2 Summary of Anteroposterior Translation for 351 Implanted and Nonimplanted Knees During Stance Phase of Gait
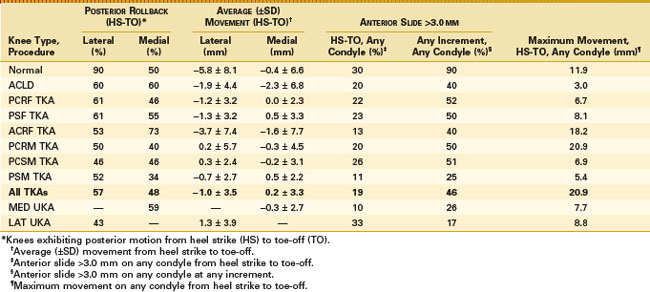
Patients having a PCRF TKA experienced, on average, posterior translation of their lateral femoral condyle from heel strike to toe-off, but less than in the normal knee or ACRF TKA groups (see Table 13-2). Only 51 of 83 patients (61%) experienced posterior motion of their lateral condyle and 38 of 83 patients (46%) had posterior motion of their medial condyle. On average, the lateral condyles had only −1.2 mm (3.5 to −5.9 mm; SD, 3.2) of posterior motion and 0.0 mm (3.3 to −3.2 mm; SD, 2.3) of medial condylar motion from heel strike to toe-off. From heel strike to toe-off, 18 of 83 patients (22%) experienced more than 3 mm of paradoxical anterior translation of either condyle and 52% of patients experienced more than 3 mm at any increment of stance phase. Patients having a PSF TKA experienced similar motion patterns to patients having a posterior cruciate ligament (PCL)–retaining fixed-bearing TKA. Only 45 of 74 patients (61%) experienced posterior motion of the lateral femoral condyle from heel strike to toe-off and 41 of 74 patients (55%) had posterior motion of the medial condyle. On average, the lateral femoral condyle translated posteriorly −1.3 mm (3.5 to −6.4 mm; SD, 3.2) and the medial condyle translated anteriorly 0.5 mm (4.0 to −5.5 mm; SD, 3.3) from heel strike to toe-off. From heel strike to toe-off, 17 of 74 (23%) of the patients experienced more than 3 mm of anterior femoral translation of either condyle and 37 of 74 (50%) patients experienced more than 3 mm at any increment of stance phase.
Only one PCRM TKA was analyzed during the stance phase of gait that allows the polyethylene to translate and rotate (see Table 13-2). Only 5 of 10 patients (50%) and 4 of 10 patients (40%) experienced posterior motion of the lateral or medial condyle, respectively. On average, from heel strike to toe-off, the lateral condyle translated in an anterior direction 0.2 mm (15.0 to −5.3 mm; SD, 5.7) and the medial condyle translated posteriorly −0.3 mm (5.1 to −11.9; SD, 4.5). From heel strike to toe-off, 2 of 10 (20%) patients experienced more than 3 mm of paradoxical anterior femoral translation of either condyle and 5 of 10 patients (50%) experienced more than 3 mm at any increment of stance phase. The maximum amount of paradoxical anterior femoral translation was 20.9 mm, but could be attributable to femorotibial rotation rather than pure translation. On average, 23 of 44 patients (52%) having a PCSM TKA experienced posterior motion of the lateral condyle and 15 of 44 patients (29%) had posterior motion of the medial condyle. On average, from heel strike to toe-off, the lateral condyle translated in the posterior direction −0.7 mm (2.7 to −4.2 mm; SD, 2.7) and the medial condyle translated anteriorly 0.5 mm (4.2 to −2.1 mm; SD, 2.2). Five of 44 patients (11%) experienced more than 3 mm of paradoxical anterior femoral translation of either condyle and 11 of 44 patients (25%) experienced more than 3 mm at any increment of stance phase. On average, patients having a PCSM TKA experienced similar kinematic patterns to the patients who received a posterior stabilized mobile-bearing TKA. Only 16 of 35 patients (46%) experienced posterior motion of the lateral condyle and 16 of 35 patients (46%) had posterior motion of the medial condyle. On average, from heel strike to toe-off, the lateral condyle translated 0.3 mm (5.7 to−2.7 mm; SD, 2.4) in the anterior direction and the medial condyle translated −0.2 mm posteriorly (4.3 to −5.1 mm; SD, 3.1). Nine of 35 patients (26%) experienced more than 3 mm of paradoxical anterior femoral translation of either condyle and 18 of 35 patients (51%) experienced more than 3 mm at any increment of stance phase.
A summary comparison of each study group revealed some interesting findings during the stance phase of gait (see Table 13-2). Patients having a normal knee experienced the highest incidence (90%) and magnitude (−5.8 mm) of posterior motion of the lateral femoral condyle. The kinematic patterns for the fixed- and mobile-bearing posterior stabilized TKA groups were similar, as were the kinematic patterns for the various mobile-bearing designs (PCL-retaining mobile-bearing, posterior stabilized mobile-bearing, and posterior cruciate–sacrificing mobile-bearing). On average, for all TKAs during the stance phase of gait, only 149 of 261 patients (57%) had posterior motion of their lateral condyle and 125 of 261 patients (48%) experienced posterior motion of the medial condyle. On average, the lateral condyle translated posteriorly by −1.0 mm (SD, 3.5) and the medial condyle translated anteriorly 0.2 mm (SD, 3.3). Although it was expected that those knees with intact anterior and posterior cruciate ligaments (normal knees and ACL-retaining TKA groups) would demonstrate less variability in kinematic data, the opposite was observed, but this could also be attributed to bone size and each subject’s specific gait motion.
Deep Knee Bend
All 104 (100%) subjects with a normal knee analyzed under fluoroscopic surveillance while performing a weight-bearing deep knee bend (DKB) experienced posterior motion of the lateral condyle from full extension to 90 degrees of knee flexion, whereas 102 of 104 subjects (98%) experienced posterior motion of the medial condyle (Table 13-3). On average, the lateral condylar motion was −16.4 mm (SD, 6.8) and medial condylar motion was −8.9 mm (SD, 6.0) in the posterior direction. All but 2 subjects (2%) experienced posterior motion of both condyles from full extension to maximum flexion, but 15 of 104 subjects (15%) had more than 3 mm of medial condyle anterior translation during any increment of knee flexion. All lateral femoral condyles experienced only posterior motion. Thirty-one of 34 patients (91%) having an ACRF TKA experienced posterior motion of their lateral condyle and 30 of 34 patients (88%) had posterior motion of their medial condyle. The average amount of lateral condylar movement was −10.4 mm (SD, 5.0) and the medial condylar motion was −5.6 mm (SD, 5.1) in the posterior direction (Table 13-4). Two of 34 patients (6%) experienced paradoxical anterior femoral motion of their medial condyle more than 3 mm from full extension to 90 degrees of knee flexion and 11 of 34 patients (32%) experienced more than 3 mm of medial condyle anterior translation during any increment of knee flexion. Similar to the normal knee, the vast majority of lateral femoral condyles demonstrated only posterior motion.
Table 13-3 Summary of Anteroposterior Translation for 1630 Implanted and Nonimplanted Knees During Deep Knee Bend
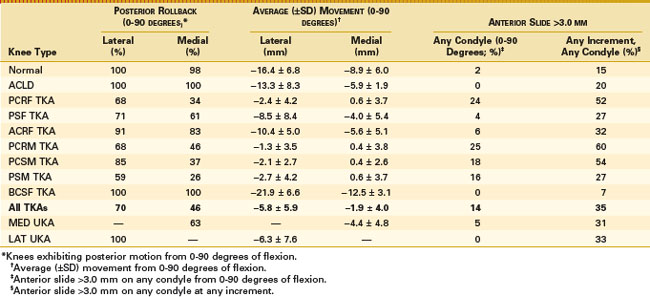
Table 13-4 Summary of Axial Rotation for 351 Implanted and Nonimplanted Knees During Stance Phase Of Gait
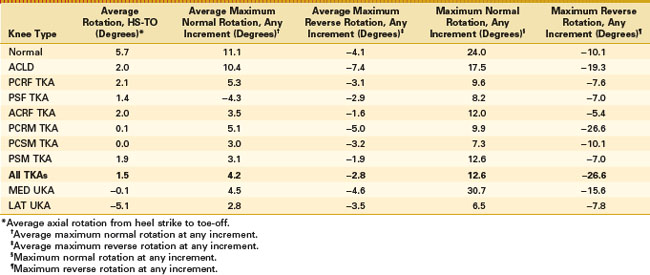
Unlike the subjects with a normal knee or an ACRF TKA, only 233 of 343 patients (68%) having a PCRF TKA experienced posterior motion of their lateral condyle and even fewer, 117 of 343 (34%), had posterior motion of their medial condyle (see Table 13-3). On average, from full extension to 90 degrees of flexion, patients experienced only −2.4 mm of (SD, 4.2) posterior motion of the lateral condyle, whereas the medial condylar motion was 0.6 mm (SD, 3.7) anteriorly. From full extension to 90 degrees of knee flexion, 82 of 343 subjects (24%) experienced more than 3 mm of anterior translation and 178 of 343 subjects (52%) experienced an anterior femoral translation more than 3 mm of either the medial or lateral femoral condyle over any flexion increment. Although this group of subjects achieved variable kinematic patterns, there was a distinct difference between subjects having an asymmetrical condylar TKA compared with those having a symmetrical condylar TKA. In one study, 20 of 20 subjects having a PCRF TKA with asymmetrical condyles achieved posterior femoral rollback of their lateral condyle.34
Patients having a PSF TKA experienced a higher incidence and magnitude of posterior condylar motion, but less in magnitude when compared with the normal knee (see Table 13-3). From full extension to 90 degrees of knee flexion, 320 of 457 patients (71%) having a posterior-stabilized fixed-bearing TKA experienced posterior motion of their lateral condyle and 279 of 457 (61%) had posterior motion of their medial condyle. On average, the lateral condylar motion was −8.5 mm (SD, 8.4) and medial condylar motion was −4.0 mm (SD, 5.4) in the posterior direction. From full extension to 90 degrees of knee flexion, only 18 of 457 subjects (4%) experienced more than 3 mm of anterior femoral translation and 123 of 457 subjects (27%) had an anterior translation more than 3 mm at any flexion increment of either the medial or lateral femoral condyle.
Ninety-five BCSF TKAs were also analyzed while undergoing a DKB. All 95 (100%) experienced posterior motion of both condyles. The lateral and medial condyles experienced, on average, −21.9 mm (SD, 6.6) and −12.5 mm (SD, 3.1) of posterior motion, respectively, from full extension to 90 degrees of flexion. None (0%) of the TKA experienced anterior motion from full extension to 90 degrees of flexion and only 7 of the 95 BCSF TKAs analyzed experienced anterior motion more than 3 mm between any two increments of flexion. This TKA experienced the most posterior translation of either condyle for any TKA (see Table 13-3).
Patients having a PCL-retaining mobile-bearing TKA experienced kinematic trends similar to those of patients with the PCL-retaining fixed-bearing TKA (see Table 13-3). Only 73 of 107 patients (68%) experienced posterior motion of their lateral condyle and 49 of 107 (46%) had posterior motion of the medial condyle. On average, from full extension to 90 degrees of flexion, the lateral condyle moved −1.3 mm (SD, 3.5) posteriorly and the medial condyle moved 0.4 mm (SD, 3.8) anteriorly. Twenty-two of 107 patients (25%) experienced more than 3 mm of anterior translation and 64 of 107 patients (60%) experienced anterior femoral translation more than 3 mm at any flexion increment of either the medial or lateral femoral condyle.
Patients having a PCSM TKA experienced kinematic trends very similar to those of patients implanted with the PSF TKA (see Table 13-3). From full extension to 90 degrees of knee flexion, 290 of 341 patients (85%) experienced posterior motion of their lateral condyle and 169 of 341 patients (26%) had posterior motion of their medial condyle. On average, the amount of posterior motion was −2.7 mm (SD, 4.2) for the lateral condyle and 0.6 mm (SD, 3.7) anterior motion for the medial condyle. From full extension to 90 degrees of knee flexion, 53 of 341 TKA patients (16%) experienced more than 3 mm of anterior translation and 92 of 341 TKA patients (27%) experienced anterior femoral translation more than 3 mm at any flexion increment of either the medial or lateral femoral condyle.
Sixty-five of 76 patients (85%) having a PCSM TKA experienced posterior motion of their lateral condyle and 28 of 76 (37%) exhibited posterior motion of their medial condyle (see Table 13-3). The average amount of motion was −2.1 mm (SD, 2.7) in the posterior direction for the lateral condyle and 0.4 mm (SD, 2.6) in the anterior direction for the medial condyle. From full extension to 90 degrees of knee flexion, 14 of 76 patients (18%) experienced more than 3 mm of anterior translation, and 41 of 76 patients (54%) had an anterior slide more than 3 mm at any flexion increment.
Stay updated, free articles. Join our Telegram channel

Full access? Get Clinical Tree


