Evaluation of the medical literature is an essential task of the pediatric orthopaedic surgeon in order to evaluate the efficacy of treatments, to stay abreast of new technology, and to provide optimal patient care. However, this task can be daunting as the clinician is inundated with medical information from scientific journals, scientific meetings, the lay press, industry, and even the Internet. Critical evaluation of the medical literature is vital to assess which studies are scientifically sound and sufficiently compelling to change practice from those that are methodologically flawed or biased. A working understanding of clinical epidemiology and biostatistics is necessary for critical evaluation of the medical literature.
This chapter provides an overview of the concepts of study design, hypothesis testing, measures of effect, diagnostic performance, evidence-based medicine (EBM), outcomes assessment, and biostatistics. Examples from the orthopaedic literature and a glossary of terminology (terms italicized throughout the text) are provided.
STUDY DESIGN
Clinical research study design has evolved from cataloguing vital statistics from birth and death records in the 1600s, to correlational studies associating cholera with water contamination, to case-control studies linking smoking with lung cancer, to prospective cohort studies such as the Framingham Heart Study, and to the randomized clinical trial (RCT) for the polio vaccine (1).
The EBM and patient-derived outcomes assessment movements burst onto the scene of clinical medicine in the 1980s and 1990s as a result of contemporaneous medical, societal, and economic influences. Pioneers, such as Sackett and Feinstein, emphasized levels of evidence and patient-centered outcomes assessment (2, 3, 4, 5, 6, 7, 8, 9 and 10). Work by Wennberg and colleagues revealed large small-area variations in clinical practice, with some patients 30 times more likely to undergo an operative procedure than other patients with identical symptoms merely because of their geographic location (11, 12, 13, 14, 15 and 16). Further critical research suggested that up to 40% of some surgical procedures might be inappropriate and that up to 85% of common medical treatments were not rigorously validated (17, 18 and 19). Meanwhile, the costs of health care were rapidly rising to over 2 billion dollars per day, increasing from 5.2% of the gross domestic product in 1960 to 16.6% in 2008 (20). Health maintenance organizations and managed care emerged. In addition, increasing federal, state, and consumer oversight were brought to bear on the practice of clinical medicine. These forces have led to an increased focus on the effectiveness of clinical care and the design of clinical research studies.
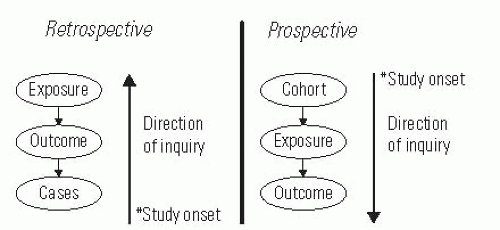
In observational studies, researchers observe patient groups without allocation of the intervention, whereas in experimental studies, researchers allocate the treatment. Experimental studies involving humans are called trials. Research studies may be retrospective, meaning that the direction of inquiry is backward from the cases and that the events of interest transpired before the onset of the study, or they may be prospective, meaning that the direction of inquiry is forward from the cohort inception and that the events of interest transpire after the onset of the study (Fig. 5-1). Cross-sectional studies are used to survey one point in time. Longitudinal studies follow the same patients over multiple points in time.
All research studies are susceptible to invalid conclusions due to bias, confounding, and chance. Bias is the nonrandom systematic error in the design or conduct of a study. Bias usually is not intentional; however, it is pervasive and insidious. Forms of bias can corrupt a study at any phase, including patient selection (selection and membership bias), study performance (performance and information bias), patient follow-up (nonresponder and transfer bias), and outcome determination (detection, recall, acceptability, and interviewer bias). Frequent biases in the orthopaedic literature include selection bias when unlike groups are being compared, nonresponder bias in studies with low follow-up rates, and interviewer bias when the investigator is determining outcome. A confounder is a variable having independent associations with both the independent (predictor) and dependent (outcome) variables, thus potentially distorting their relationship. For example, an association between knee laxity and anterior cruciate ligament injury may be confounded by female sex since females may have greater knee laxity and a higher risk of anterior cruciate ligament injury. Frequent confounders in clinical research include gender, age, socioeconomic status, and comorbidities. As discussed below in the section on hypothesis testing, chance may lead to invalid conclusions based on the probability of type I and type II errors, which are related to P values and power.
FIGURE 5-1. Prospective versus retrospective study design defined based on the direction of inquiry and the onset of the study.
The adverse effects of bias, confounding, and chance can be minimized by study design and statistical analysis. Prospective studies minimize bias associated with patient selection, quality of information, trying to recall preoperative status, and nonresponders. Randomization minimizes selection bias and equally distributes confounders. Blinding can further decrease bias, and matching can decrease confounding. Confounders can sometimes be controlled post hoc with use of stratified analysis or multivariable methods. The effects of chance can be minimized by an adequate sample size based on power calculations and use of appropriate levels of significance in hypothesis testing. The ability of study design to optimize validity while minimizing bias, confounding, and chance is recognized by the adoption of hierarchical levels of evidence on the basis of study design (Table 5-1).
Observational study designs include case series, case-control studies, cross-sectional surveys, and cohort studies. A case series is a retrospective, descriptive account of a group of patients with interesting characteristics or a series of patients who have undergone an intervention. A case series of one patient is a case report. Case series are easy to construct and can provide a forum for the presentation of interesting or unusual observations. However, case series are often anecdotal, are subject to many possible biases, lack a hypothesis, and are difficult to compare with other series. Thus, case series are usually viewed as a means of generating hypotheses for further studies but are not viewed as conclusive. A case-control study is one in which the investigator identifies patients with an outcome of interest (cases) and patients without the outcome (controls) and then compares the two groups in terms of possible risk factors. The effects in a case-control study are frequently reported with use of the odds ratio. Case-control studies are efficient (particularly for the evaluation of unusual conditions or outcomes) and are relatively easy to perform. However, an appropriate control group may be difficult to identify, and preexisting high-quality medical records are essential. Moreover, case-control studies are susceptible to multiple biases, particularly selection and detection bias based on the identification of cases and controls. Cross-sectional surveys are often used to determine the prevalence of disease or to identify coexisting associations in patients with a particular condition at one particular point in time. Prevalence of a condition is the number of individuals with the condition divided by the total number of individuals at one point in time. Incidence, in contradistinction, refers to the number of individuals with the condition divided by the total number of individuals over a defined time period. Thus, prevalence data are usually obtained from a cross-sectional survey and are a proportion, whereas incidence data are usually obtained from a prospective cohort study and contain a time value in the denominator. Surveys are also frequently performed to determine preferences and treatment patterns. Because cross-sectional studies represent a snapshot in time, they may be misleading if the research question involves the disease process over time. Surveys also present unique challenges in terms of adequate response rate, representative samples, and acceptability bias. A traditional cohort study is one in which a population of interest is identified and followed prospectively in order to determine outcomes and associations with risk factors. Retrospective cohort studies, or historical cohort studies, can also be performed in which cohort members are identified based on records and the follow-up period occurs entirely or partly in the past. Cohort studies are optimal for studying the incidence, course, and risk factors of a disease because they are longitudinal, meaning that a group of subjects is followed over time. The effects in a cohort study are frequently reported in terms of relative risk. Because traditional cohort studies are prospective, they can optimize follow-up and data quality and can minimize bias associated with selection, information, and measurement. In addition, they have the correct time sequence to provide strong evidence regarding associations. However, these studies are costly, are logistically demanding, often require long time periods for completion, and are inefficient for the assessment of unusual outcomes or diseases.
Experimental study designs may involve the use of concurrent controls, sequential controls (cross-over trials), or historical controls. The randomized clinical trial (RCT) with concurrent controls is the so-called gold standard of clinical evidence as it provides the most valid conclusions (internal validity) by minimizing the effects of bias and confounding. A rigorous randomization with enough patients is the best means of avoiding confounding. The performance of an RCT involves the construction of a protocol document that explicitly establishes eligibility criteria, sample size, informed consent, randomization, stopping rules, blinding, measurement, monitoring of compliance, assessment of safety, and data analysis. Because allocation is random, selection bias is minimized and confounders (known and unknown) are theoretically equally distributed between groups. Blinding minimizes performance, detection, interviewer, and acceptability bias. Blinding may be practiced at four levels: participants, investigators applying the intervention, outcome assessors, and analysts. Intention-to-treat analysis minimizes nonresponder and transfer bias, while sample-size determination ensures adequate power. The intention-to-treat principle states that all patients should be analyzed within the treatment group to which they were randomized in order to preserve the goals of randomization. Although the RCT is the epitome of clinical research designs, the disadvantages of RCTs include their expense, logistics, and time to completion. Accrual of patients and acceptance by clinicians may be problematic. With rapidly evolving technology, a new technique may become rapidly well accepted, making an existing RCT obsolete or a potential RCT difficult to accept. Ethically, RCTs require clinical equipoise (equality of treatment options in the clinician’s judgment) for enrollment, interim stopping rules to avoid harm and evaluate adverse events, and truly informed consent. Finally, while RCTs have excellent internal validity, some have questioned their generalizability (external validity) because the practice pattern and the population of patients enrolled in an RCT may be overly constrained and nonrepresentative.
TABLE 5-1 Levels of Evidence for Primary Research Question Used by theJournal of Bone and Joint Surgery
Levels of Evidence for Primary Research Question
Types of Studies
Therapeutic Studies—Investigating the Results of Treatment
Prognostic Studies— Investigating the Outcome of Disease
DiagnosticStudies—Investigating aDiagnostic Test
Economic and Decision Analyses—Developing an Economic or Decision Model
1 1. All patients were enrolled at the same point in their disease course (inception cohort) with greater than or equal to 80% follow-up of enrolled patients.
2 2. A study of results from two or more previous studies.
3 3. Patients were compared with a control group of patients treated at the same time and institution.
4 4. The study was initiated after treatment was performed.
5 5. Patients with a particular outcome (“cases” with, e.g., a failed total arthroplasty) were compared with those who did not have the outcome (“controls” with, e.g., a total hip arthroplasty that did not fail).
Ethical considerations are intrinsic to the design and conduct of clinical research studies. Informed consent is of paramount importance, and it is the focus of much of the activity of Institutional Review Boards. Investigators should be familiar with the Nuremberg Code and the Declaration of Helsinki as they pertain to ethical issues of risks and benefits, protection of privacy, and respect for autonomy (21, 22).
HYPOTHESIS TESTING
The purpose of hypothesis testing is to permit generalizations from a sample to the population from which it came. Hypothesis testing confirms or refutes the assertion that the observed findings did not occur by chance alone but rather occurred because of a true association between variables. By default, the null hypothesis of a study asserts that there is no significant association between variables, whereas the alternative hypothesis asserts that there is a significant association. If the findings of a study are not significant, we cannot reject the null hypothesis, whereas if the findings are significant, we can reject the null hypothesis and accept the alternative hypothesis.
Thus, all research studies that are based on a sample make an inference about the truth in the overall population. By constructing a 2 × 2 table of the possible outcomes of a study (Table 5-2), we can see that the inference of a study is correct if a significant association is not found when there is no true association or if a significant association is found when there is a true association. However, a study can have two types of errors. A type I or alpha (α) error occurs when a significant association is found when there is no true association (resulting in a “false-positive” study that rejects a true null hypothesis). A type II or beta (β) error wrongly concludes that there is no significant association (resulting in a “false-negative” study that rejects a true alternative hypothesis).
TABLE 5-2 Hypothesis Testing
Truth
Experiment
No association
Association
No association
Correct
Type II (β) error
Association
Type I (α) error
Correct
P value: probability of type I (α) error
Power: 1 — probability of type II (β) error
The alpha level refers to the probability of the type I (α) error. By convention, the alpha level of significance is set at 0.05, which means we accept the finding of a significant association if there is less than a one in twenty chance that the observed association was due to chance alone. Thus, the P value, which is calculated from a statistical test, is a measure of the strength of evidence from the data in favor of the null hypothesis. If the P value is less than the alpha level, then the evidence against the null hypothesis is strong enough to reject it and conclude that the result is statistically significant. P values frequently are used in clinical research and are given great importance by journals and readers; however, there is a strong movement in biostatistics to de-emphasize P values because a significance level of P < 0.05 is arbitrary, a strict cutoff point can be misleading (there is little difference between P = 0.049 and P = 0.051, yet only the former is considered “significant”), the P value gives no information about the strength of the association, and the P value may be statistically significant without the results being clinically important. Alternatives to the traditional reliance on P values include the use of variable alpha levels of significance based on the consequences of the type I error and the reporting of P values without using the term “significant.” Use of 95% confidence intervals in lieu of P values has gained acceptance as these intervals convey information regarding the significance of findings (95% confidence intervals do not overlap if they are significantly different), the magnitude of differences, and the precision of measurement (indicated by the range of the 95% confidence interval).
Power is the probability of finding a significant association if one truly exists and is defined as 1—the probability of type II (β) error. By convention, acceptable power is set at ≥80%, which means there is ≤20% chance that the study will demonstrate no significant association when there is a true association. In practice, when a study demonstrates a significant association, the potential error of concern is the type I (α) error as expressed by the P value. However, when a study demonstrates no significant association, the potential error of concern is the type II (β) error as expressed by power. That is, in a study that demonstrates no significant effect, there may truly be no significant effect, or there may actually be a significant effect, but the study was underpowered because the sample size may have been too small or the measurements may have been too imprecise. Thus, in a study that demonstrates no significant effect, the power of the study should be reported. The calculations for power analyses differ depending on the statistical methods utilized for analysis; however, four elements are involved in a power analysis: α, β, effect size, and sample size (n). Effect size is the difference that you want to be able to detect with the given α and β. It is based on a clinical sense about how large a difference would be clinically meaningful. Effect sizes are often defined in dimensionless terms, based on a difference in mean values divided by the pooled standard deviation for a comparison of two groups. Low sample sizes, small effect sizes, and large variance decrease the power of a study. An understanding of power issues is important in clinical research to minimize resources when planning a study and to ensure the validity of a study. Sample size calculations are performed when planning a study. Typically, power is set at 80%, alpha is set at 0.05, the effect size and variance are estimated from pilot data or the literature, and the equation is solved for the necessary sample size. The calculation of power after the study has been completed, post-hoc power analysis, is controversial and is not recommended.
Only gold members can continue reading. Log In or Register to continue