Fig. 29.1
Top: on-water hiking on a laser dinghy boat. Bottom: simulated hiking on a laser bench (simulator) in the laboratory
What makes dinghy hiking a different form of physical activity from what predominates in almost every other sport is the persistent near-isometric contraction of the quadriceps muscles sustained at approximately 40–50 % of quadriceps’ maximal voluntary contraction [1, 2]. Hence the quasi-isometric nature of hiking could potentially limit blood flow and thus oxygen availability to quadriceps muscles because of the high intramuscular pressure [3], thereby compromising hiking performance [4, 5].
Earlier studies [5] indicated a progressive decrease in O2 availability to the quadriceps muscles during hiking, evidenced by progressively decreasing tissue O2 saturation assessed by near-infrared spectroscopy (NIRS). Reduced O2 saturation during muscular activity could simply reflect the balance between muscle oxygen delivery and demand [6], and thus, the reduction in quadriceps muscle oxygenation reported during hiking [5] could be attributable either to restricted tissue oxygen delivery, increased tissue oxygen demand, or both. Accordingly, the major challenge when studying the limiting factors to hiking performance is whether reduced quadriceps muscle O2 saturation is due to blood flow restriction. In this context, determination of the extent to which blood flow to quadriceps muscles is limited during hiking has recently been feasible by the employment of NIRS technology in combination with the light absorbing tracer indocyanine green dye (ICG). This is a relatively new and minimally invasive technique for measuring muscle blood flow during hiking.
29.2 Measurement of Quadriceps Muscle Blood Flow by NIRS
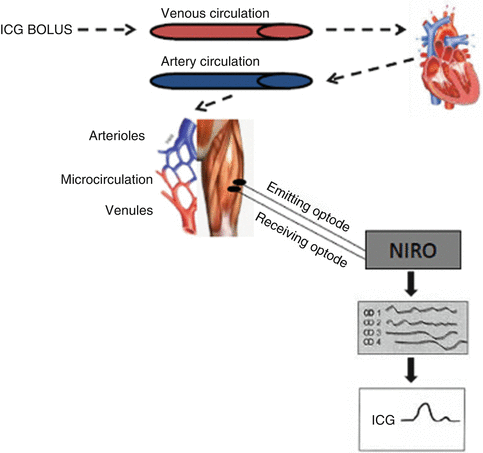
Approximately a decade ago, a technique combining NIRS with ICG was developed to measure muscle blood flow by applying the Fick’s principle [7]. Indocyanine green dye is a water-soluble tricarbocyanine, light absorbing dye with a peak absorption in human blood in the NIR range of 800 nm. It has been used routinely for measuring cardiac output, as well as limb blood flow with use of photodensitometry. After intravascular injection, ICG is predominantly bound to albumin and circulates to the right heart and lungs and emerges into the arterial circulation. Arterial blood withdrawn by a pump, and the ICG is recorded by photodensitometry, whereas downstream in the tissue microcirculation, ICG accumulation is detected by measuring light attenuation with NIRS (Fig. 29.2).


Fig. 29.2
Schematic representation of the NIRS measurements of indocyanine green (ICG) in tissue after a venous bolus infusion. From top left, an ICG bolus is injected into the venous circulation; it passes through the heart and lungs and into the arterial circulation and microcirculation. The NIRS optodes positioned over the tissue detect the ICG at several wavelengths, and, by use of specific extinction coefficients in a matrix operation, the ICG curve is isolated. The circles represent the vessels from which the NIRS is detected
Muscle blood flow measurement requires arterial cannulation and continues withdrawal of blood through a photodensitometer for several seconds after injection. Furthermore, one needs to consider that arterial cannulation is associated with the potential risks of bleeding, vascular perforation, vascular insufficiency, and injury to adjusted nerves. Considering the above situation and the fact that the equipment for constant rate blood withdrawal and measurements of ICG may not be available, the NIRS-ICG technique is not feasible in all conditions. For the above reasons, an alternative algorithm has been proposed to calculate tissue perfusion from the NIRS data, namely, the blood flow index (BFI) [8].
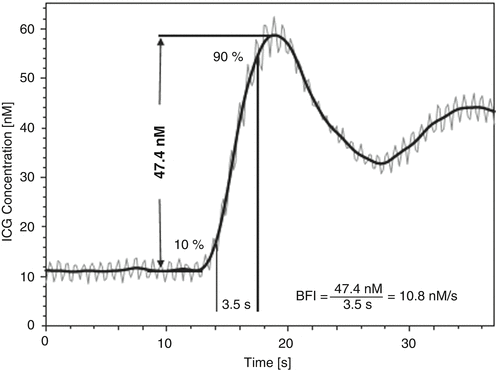
Specifically, the BFI is calculated by dividing the ICG peak concentration by the rise time from 10 to 90 % of peak (Fig. 29.3) [8].


Fig. 29.3
Typical example of quadriceps muscle indocyanine green (ICG) concentration curve recorded by near-infrared spectroscopy (NIRS) during exercise at 30 % limit of tolerance. The original tracing (gray line) appears with marked oscillations (at a frequency of 84/min; 1.4 Hz) owing to muscle contraction and relaxation during cycling. Low-pass filtering with a cutoff frequency of 0.5 Hz produced the smoothed curve (black line) that was used for blood flow index (BFI) calculation. Data points at 10 and 90 % of ICG concentration peak are indicated, and an example of BFI calculation is given
In addition, the BFI is derived only from the transcutaneously measured NIRS-ICG curve and not from the arterial ICG curve. Thus, the only invasive component of this technique is venous cannulation for bolus injection of the ICG tracer. For that reason, the BFI is a relative measure of blood flow, as absolute flow cannot be determined unless arterial ICG concentration is measured. BFI has traditionally been used for the assessment of cerebral blood flow [9]. Recently, this method has been validated in human’s locomotor and respiratory muscles [8]. Furthermore, in a retrospective analysis, Habazettl and colleagues [8] compared BFI values within the vastus lateralis against absolute muscle blood flow determined using NIRS-ICG technique during cycling exercise at different intensities. The results indicated a very good agreement between BFI and NIRS-ICG technique measured both in respiratory and quadriceps muscles [8].
Stay updated, free articles. Join our Telegram channel

Full access? Get Clinical Tree


