Fig. 1
Radiographs (anteroposterior, lateral, and axial patella) of the right knee showing the cruciate-retaining fixed-bearing TKR. The patella has not been resurfaced. A patella baja position relative to the femur can be seen
Questions
1.
What are your next steps in diagnostics?
2.
What is your treatment proposal?
SPECT/CT was performed to precisely localize the pain generator and to accurately determine the TKR component orientation with regard to standardized frames of references in 3D CT.
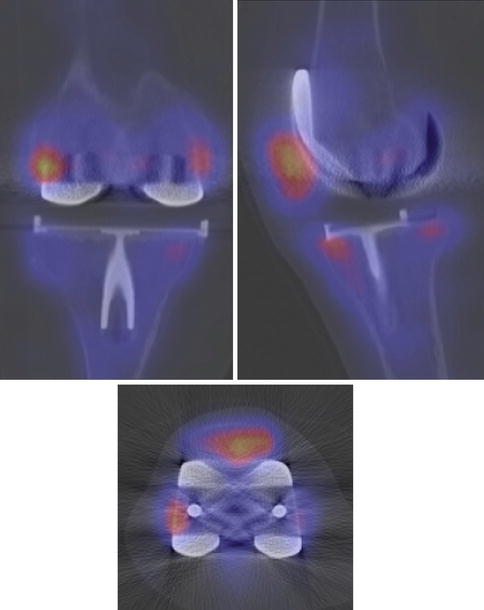
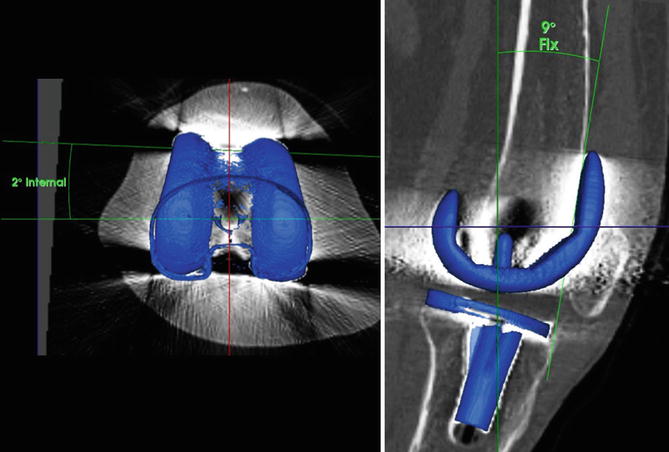
SPECT/CT (Fig. 2) showed markedly increased tracer activity in the distal patellar pole and the entire retropatellar surface. This corresponded well with the patient’s symptoms. Infection and loosening of the components were excluded. Measurements of the component position were obtained on 3D reconstructed CT scans with standardized frames of references using customized software (Orthoexpert v1.15©, OrthoImagingSolutions Ltd., London, UK). The femoral component was 9° flexed and with 2° slightly internally rotated (Fig. 3).


Fig. 2
SPECT/CT images of the right knee showed a markedly increased tracer activity at the whole patella indicating a hyperpressure and stress reaction

Fig. 3
Measurements of the right femoral TKR component position using a customized and validated software
Questions
1.
How do you explain the pain?
2.
What is your treatment proposal?
The decision was made to perform an open arthrolysis, secondary patellar resurfacing, and a proximalization of the tibial tubercle.
Questions
1.
When would you perform an open arthrolysis?
2.
Would you combine it with a secondary patellar resurfacing?
3.
What is a good indication for a proximalization of the tibial tubercle?
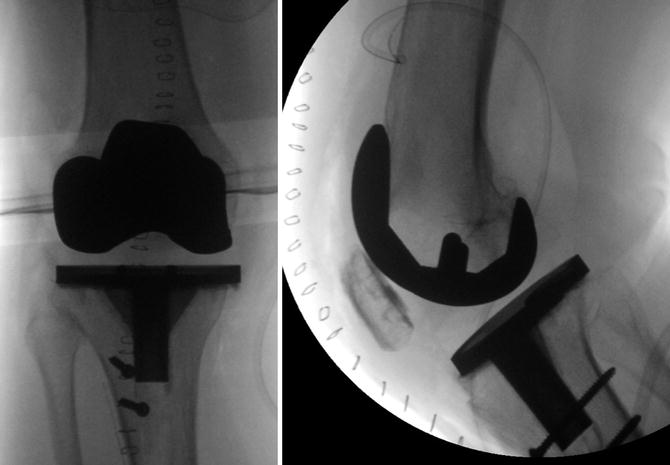
At revision surgery a strongly fibrotic knee joint with hypertrophic synovial membrane was found. The different soft tissue layers were released. At 60° flexion the distal patellar pole came into direct conflict with the polyethylene inlay. After closure of the arthrotomy, a tension-free flexion of 110° with a well-centered patella was achieved (Fig. 4).


Fig. 4
Intraoperative fluoroscopy (anteroposterior, lateral in flexion) of the right knee showed the postoperative situation after tibial tubercle osteotomy and secondary patellar resurfacing
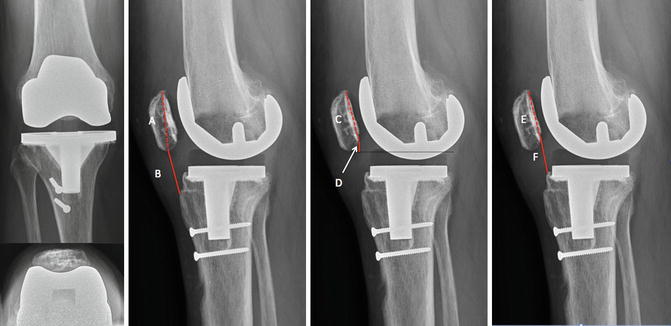
Three months after surgery, the patient presented with an improved ROM of 100°/0°/0°. Conventional radiographs showed a proximalized patella and a well-consolidated tibial tubercle osteotomy (Fig. 5).


Fig. 5
Radiographs (anteroposterior, lateral, and axial patella) of the right knee after correction surgery. The application of the IS (B/A), BP (D/C), and CD (F/E) ratios is demonstrated in the lateral views. After surgery measured ratios in extended knee position views were still pathologic (IS = 0.71, BP = 0.29 and CD = 0.7), but the distance between PE inlay and patellar lower pole was enlarged. These three methods allow the surgeon to quantify the patellar position and facilitate the decision-making process for optimal treatment. However, it was reported that there is a poor correlation between radiographic abnormalities and patellofemoral pain [5]. As patellofemoral disorders are a great diagnostic challenge, the use of SPECT/CT offers additional benefit of combining metabolic and anatomical information [6]. Therefore, SPECT/CT could be used for precise location of relevant disorders and is helpful in the establishment of a correct treatment, as experienced in the presented case
Discussion Points
Diagnostic Approach to Patellofemoral Problems
Three methods, which are based on lateral radiographs of the preferably 30° flexed knee joint, are most commonly used to characterize the patellar position relative to the femur: The Insall-Salvati ratio (IS) was determined as the division of the patellar tendon length, measured from tibial tubercle to patellar apex and of the largest longitudinal diameter of the patella [7]. Patella baja was considered to be represented by ratios less than 0.80 (Fig. 5). Blackburne and Peel [8] introduced the Blackburne-Peel ratio (BP), which measures the patellar height as the ratio between the distance from the most inferior point of the patellar articular surface to a tangent on the tibial plateau to patellar articular length. A BP ratio of less than 0.54 was reported to indicate patella baja (Fig. 5). Thirdly, the Caton-Deschamps index (CD), which was introduced by Caton and Deschamps [9], compares the distance between the lower border of the articular surface of the patella and the anterosuperior border of the tibia with the length of the patellar articular cartilage. A ratio less than 0.8 is considered to represent patella baja.
Stay updated, free articles. Join our Telegram channel

Full access? Get Clinical Tree


