Bone Tumors of the Foot and Ankle


Bone Tumors of the Foot and Ankle


Lawrence S. Osher

Bryan D. Caldwell

Hilaree B. Milliron


Bone tumors are those conditions of the skeletal system that are neoplastic or could be mistaken for a neoplastic condition on the basis of radiographic or pathologic evidence (1). In the mid-1920s, Codman published the first articles of the registry of bone sarcoma. These articles described radiographic characteristics associated with specific bone tumors. Many of the early principles, such as evaluation of the bone-tumor interface and the presence of triangular periosteal reactions (Codman triangle), have stood the test of time and are still relied on to assess these osseous lesions (2,3). With the routine use of ancillary imaging modalities such as computed tomography (CT) and magnetic resonance imaging (MRI) in the evaluation of musculoskeletal lesions, in many instances the approach to bone tumors and tumor-like lesions will entail use of advanced imaging studies. Among their advantages, both of these modalities offer sectional imaging and have improved contrast resolution versus plain-film imaging. Nevertheless, CT, MR, radionuclide, positron emission tomography (18FDG-PET), and ultrasonic scanning are indeed “ancillary” considerations. That is to say, for a suspected primary bone tumor, the plain-film radiograph is still the screening and/or first imaging modality of choice.

Clearly, CT and MRI are now routinely ordered by practitioners, many times intuitively, although sometimes as a “reflex.” However, for grossly benign-appearing lesions with plain-film studies, CT or MRI may not be necessary unless surgical intervention is contemplated and/or greater anatomic detail is required (4). With respect to this latter point, CT imaging does indeed enjoy some “natural” indications when it comes to pedal imaging. Lesions located in bones with complex anatomic shapes and overlappings (e.g., the tarsal bones) typically require cross-sectional imaging to fully clarify their osseous extent and soft tissue involvement. In addition, many pedal lesions are statistically of smaller size than their counterparts in the extremity long bones. As a logical extension of plain-film radiographic imaging, CT scanning is generally superior in demonstrating intracortical lesions, subtle cortical disruptions and/or erosive changes, the extent of internal lysis (especially in tarsal bones), and the presence of intralesional calcification(s). Moreover, CT scanning is no longer limited in its ability to provide high-quality sagittal plane reconstructions of the foot. Newer developments such as multichannel, multidetector, and spiral/helical scanning technology now allow for clear reformatted sagittal plane pedal images as well as volumetric data acquisition, which can facilitate three-dimensional reconstruction.

Unlike CT scanning, MR imaging is not based upon differential x-ray beam attenuation within matter and provides cross-sectional imaging, but with markedly superior contrast resolution. This is especially useful in determining the extent of bone tumors and the degree of soft tissue involvement. This information, in turn, is often vital for overall tumor staging (e.g., Enneking system, covered elsewhere in this text), which ultimately helps guide appropriate therapy and surgical management. MRI is, indeed, the modality most typically used for staging lesions of the extremities (4,5,6 and 7).

As noted before, CT or MRI may not be necessary for benign-appearing lesions unless surgery is anticipated or greater anatomic detail is required (4). Conversely, when routine radiographic findings are indeterminate or the lesion has a more aggressive appearance and/or is considered potentially malignant, ancillary imaging studies are typically required. Although radionuclide imaging is a consideration in this scenario, because of MRI’s improved anatomic detail and sensitivity, it is now generally preferred over radionuclide studies. Most notably, MRI is sensitive to the early hematogenous dissemination of a tumor to bone marrow before reactions in adjacent bone are detectable on 99mTc bone scans. In other words, MRI’s sensitivity to subtle changes in marrow exceeds bone scanning in the detection of osseous metastases.

Although there is significant lack of meta-analyses in the current literature with respect to indications for adjunctive imaging for suspected bone tumors, there is some direction available. According to the most recent (2008) American College of Radiology Appropriateness Criteria, which is dedicated to providing evidence-based guidelines to practitioners, in the scenario of a suspected primary bone tumor, MRI is most highly ranked (i.e., most appropriate or indicated) when (a) radiographic findings are suspicious for malignant characteristics or (b) when persistent symptoms exist with negative radiographs. Conversely, both MRI and CT score low as appropriate studies when radiographic features are definitely benign. In addition, CT scanning is preferred over MRI for imaging of suspected osteoid osteoma (4).

To be sure, there are instances where MR imaging can lead the practitioner to the most probable diagnosis (e.g., lipoma). Unfortunately, however, most bone (and soft tissue) tumors present with nonspecific MR features, thereby limiting its usefulness as a stand-alone study. However, when combined with plain-film radiographic imaging, its overall diagnostic accuracy can significantly improve. As an example, Mahnken et al (8) found that conventional radiography and MRI each demonstrated a sensitivity of 76.4% and 77.8% with a specificity of 55.0% and 66.7%, respectively. With their combined use, the sensitivity and specificity increased to 82.6% and 70%, respectively.

In light of the foregoing discussion, it should be apparent that, despite an array of impressive technologic imaging options, one must keep a proper perspective regarding their roles. In the scenario of a suspected bone tumor, the initial evaluation of the plain-film radiograph most often provides the information critical to correct interpretation and therefore integral to the process of formulating a working diagnosis and treatment plan. The practitioner is challenged to evaluate and/or classify (a) the pattern of osseous lysis, (b) contour and shape, (c) likely epicenter/location, (d) periosteal reaction, and (e) presence or absence of tumor matrix. These findings,
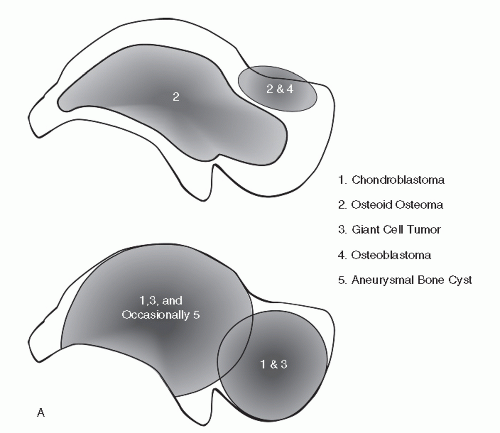
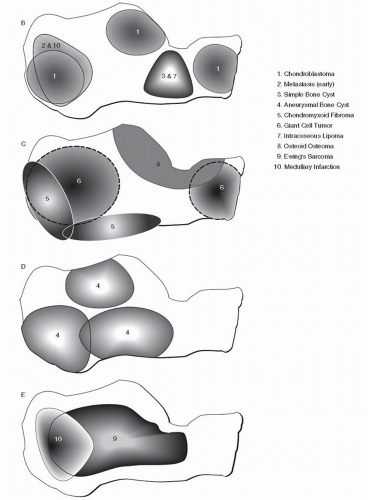
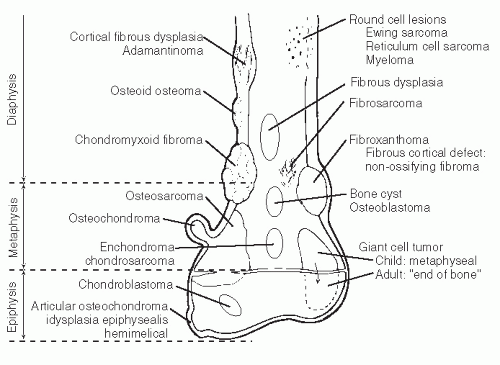
when weighed against pertinent clinical/epidemiologic data and behavioral trends, can afford the practitioner the ability to indeed arrive at a most likely diagnosis. However, there is nothing easy about this, and without a radiologic foundation rooted in the basics of delineating benign from malignant osseous lesions, all will be for naught. If there are some pragmatic aids or “revelations” in the plain-film radiographic interpretation of the foot and ankle bone tumors, they most likely lie with the development of preferential location maps of specific bone tumors for several major pedal bones, specifically the talus and calcaneus (Fig. 93.1) (9,10). This data can then be weighed along with demographics and specific radiographic features to help arrive at a most probable diagnosis. Identifying trends for bone tumors of the phalanges, metatarsals, and midfoot bones has proven to be problematic. With respect to the phalanges and metatarsals, the early appearance of the lesion is often not encountered and the epicenter is uncertain. With respect to the midfoot bones, the exceedingly rare occurrence of virtually all bone tumors in the lesser tarsal bones currently does not facilitate reliable mapping of these bones.


INCIDENCE

Primary osseous neoplasia has the greatest propensity to occur at the end of long bones. This is apparently the result of increased cellular activity, growth, and remodeling. The knee is the site most commonly affected. Tumors of the foot and ankle comprise a small percentage of musculoskeletal oncologic lesions. Dahlin’s study of 8,542 bone tumors revealed only 286 (3.4%) in the foot and ankle (11). Murari et al reviewed all bone tumors at the Armed Forces Institute of Pathology from 1970 to 1986 and found 255 cases of primary osseous neoplasia that affected the foot. This study revealed only 42 (16.5%) malignant lesions; 213 (83.5%) were benign (12).


APPROACH

Although primary bone tumors of the foot and ankle are rare, the possibility of neoplasm establishes a need for a systematic approach to radiographic evaluation of osseous lesions. In a patient with a neoplastic process, the clinical examination (history and physical) is often nonspecific. Thus, the accuracy and completeness of the initial radiographic evaluation are important steps in the overall management of this patient. Precise identification of a bone tumor is often an unrealistic goal. More to the point, one is challenged to formulate an appropriate differential diagnostic list, from which bone tumors may be ranked most likely to least probable based upon considerations presented in the remainder of this section. Perhaps most importantly, estimation of malignant potential can be extrapolated from the same analysis. For those lesions with predominantly benign-appearing features, serial radiographs at regular intervals should be employed to monitor any changes and are generally not necessary after 2 years without progression or clinical change. Any suspicion of malignancy mandates further workup.

The literature abounds with articles, chapters, and texts written on assessing bone tumors (13,14,15,16,17,18,19,20,21,22,23,24,25,26,27,28,29,30,31,32,33,34,35,36,37,38,39,40 and 41). The intent of this chapter is to provide the reader with a disciplined approach to a possible bone tumor of the foot and ankle. The first part of this chapter focuses on evaluation of specific radiographic parameters such as periosteal reactions and matrix patterns. This is followed by descriptions of specific bone tumors. An understanding of fundamental radiographic principles coupled with basic

knowledge of specific tumors will increase the accuracy of the initial differential diagnosis.


Figure 93.1 A: Preferential locations of bone tumors located in the talus.


Figure 93.1 (Continued) B-E: Preferential locations of bone tumors located in the calcaneus. (Illustration by Joan Lannoch, OCPM Graphics.)

A classification system may be helpful to avoid overlooking any possible diagnosis. The following classification system, modified from Moser and Madewell (25), divides all bone tumors into six categories (Table 93.1). Each category represents the benign and malignant varieties of a specific tissue type. Discussion of every neoplastic variant that affects the foot and ankle would be cumbersome; this text is confined to entities that occur in the foot and ankle on a more frequent basis.


PRIMARY VERSUS SECONDARY NEOPLASIA

Metastatic osseous lesions occur more frequently than primary bone tumors, and they are the most commonly encountered type of malignant bone tumor (42,43,44,45 and 46). For example, 1991 projections of the number of primary bone tumors of the entire skeletal system was 2,000 compared with an estimated 1,100,000 cases of primary extraskeletal cancer for the same year (47). Of these 1,100,000 extraskeletal tumors, 20% to 30% metastasized to bone. In 1,000 cases of biopsy-proven cancer, Abrams et al (48) found that metastases involved bone 27% of the time. Other studies have reported similar incidences of osseous metastasis ranging between 20% and 30% (45,46,49,50 and 51). Therefore, the potential incidence of secondary bone tumors is greater than that of primary bone tumors. However, metastatic disease distal to the knee and elbow occurs relatively infrequently (45,52,53).

Despite the rare occurrence of osseous metastasis to the foot and ankle, the physician must consider the possibility of an extrapedal or extraosseous primary source when a suspicious lesion is identified on plain film. The reported percentage of peripheral metastasis to the bones of the forearm, hand, leg, and foot ranges from 1.5% to 7% (42,54). In 1982, Zindrick et al (55) reviewed the world literature and found 72 cases of histologically proven osseous metastasis to the foot. Other large studies have produced small numbers of pedal and ankle metastases; 4 of 41,833 cases of metastases at the Henry Ford Hospital involved the foot (56), whereas only 10 of 75,000 osseous metastatic cases at the Mayo Clinic manifested at the foot or ankle (50). As a caveat, these numbers may be somewhat low in that standard skeletal surveys may not include the feet, and early rectilinear (whole-body) radionuclide scans were notoriously poor in pedal imaging (48,51). Nevertheless, it is safe to say that metastases to the foot or ankle are rare.


TABLE 93.1 Primary Bone Tumors


Osseous


Benign: enostosis, osteoid osteoma, and osteoblastoma


Malignant: osteosarcoma


Cartilaginous


Benign: enchondroma, osteochondroma, juxtacortical chondroma, chondroblastoma, and CMF


Malignant: chondrosarcoma


Fibrocystic


Benign: fibroxanthoma (nonossifying fibroma), fibrous dysplasia, and bone cyst


Malignant: fibrosarcoma


Marrow tissue


Benign: intraosseous lipoma


Malignant: Ewing sarcoma and multiple myeloma


Vascular


Benign: hemangioma and glomus tumor


Malignant: angiosarcoma


Miscellaneous


ABC, adamantinoma, GCT, and eosinophilic granuloma


Adapted from Moser RP, Madewell JE. An approach to primary bone tumors. Radiol Clin North Am 1987;25:1049-1093.


Wilner defined skeletal metastatic disease as “secondary growths that have separated from the primary neoplasm and have developed as a result of the multiplication of detached transported tumor fragments” (44). Metastatic disease is the result of a complex process. Springfield divided this process into the following steps (57):


  • Cellular separation from primary tumor


  • Transportation to distant site (capillary or lymphatic route)


  • Deposition at a distant site after adherence to capillary endothelium and exit from the vessel


  • Establishment of supporting blood supply

Analysis of this process gives some insight into the limited involvement of metastatic disease to the foot and ankle.

Transportation of tumor emboli is accomplished by three mechanisms: direct extension, lymphatic spread, or hematogenous dissemination (44,45 and 46). The most important mechanism to understand is the hematogenous pathway, which involves both arterial and venous routes. Pulmonary metastases travel from a primary lung tumor through the pulmonary vein and then into the left atrium, thereby entering the arterial circulation. This is important with respect to the foot and ankle because the majority of acrometastases originate from the lung (44,52,58,59). The venous route of dissemination is dominated by the vertebral venous system, which was first described by Batson (60). This valveless system surrounds the spinal column and possesses interconnections with the body wall, pelvis, skull, upper extremity, and lower extremity (44). Lacking unidirectional valves, this plexus is susceptible to intra-abdominal or caval pressure changes, and this allows for retrograde flow of caval blood into Batson venous plexus. Therefore, this represents an important vehicle for the spread of malignant disease. However, Batson venous plexus only involves the proximal half of the lower extremity and does not provide metastatic access to the foot and ankle. This limitation may partially explain the infrequent involvement of the foot and ankle in metastatic disease (45,46).

The location of skeletal metastases is largely influenced by the distribution and the anatomy of red marrow within the osseous system (43,44,45 and 46,61). With advancing age, red marrow is converted to yellow marrow in a distal to proximal fashion. This process begins before birth, and by 25 years of age, evidence of red marrow remains only in the following osseous structures: vertebrae, sternum, ribs, pelvis, skull, proximal shafts of femora and humeri, and possibly, to a small degree, os calcis (61,62). The bones containing red marrow are the preferential sites of metastatic disease and account for up to 90% of cases (43). The remaining 10% of metastases probably originate in unconverted nests of red marrow cells surrounded by yellow marrow. Vascular anatomy predisposes the red marrow to metastasis as compared with yellow marrow. The red marrow vasculature is sinusoidal and possesses spaces or gaps between endothelial cells; these features are not seen in yellow marrow.
Thus, pooling or congestion of blood occurs in the red marrow, with an anatomic space for metastatic cellular dissemination (45,46).


Figure 93.2 A,B: Metastatic squamous cell carcinoma of the distal tibia. Purely osteolytic permeative destruction is noted involving the distal diaphysis and metaphysis. Note permeation into the posterior tibial cortex. Type III growth rate assignment should be made. A pathologic fracture is apparent involving the anterior cortex. (Courtesy of Norman Ende, MD.)

Clinically, osseous metastases most commonly originate from a primary lung, breast, or prostate source, whereas the most common primary sites of foot and ankle metastases are the lung, kidney, and colon (49,50 and 51,55,63). Skeletal metastasis predominately affects middle-aged and elderly patients. Pain is the most common presenting clinical feature, most typically secondary to pathologic fracture. Forefoot dactylitis or nonspecific rearfoot pain may be the initial presentation of an occult extrapedal primary malignant tumor. In a report combining three separate articles, 18 of 54 cases of extrapedal neoplasia initially presented as metastases to the foot or ankle (49,50 and 51). Acral involvement of metastatic disease usually points to a grave prognosis because it is a reflection of widespread metastasis.

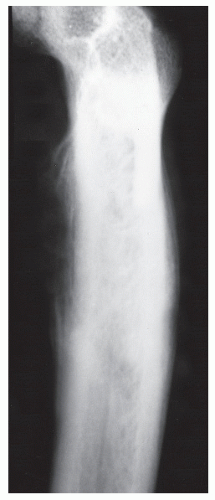
The radiographic picture can span the entire spectrum of pure lysis (renal, thyroid, lung, non-Hodgkin lymphoma, and breast) to almost pure medullary sclerosis (prostatic, Hodgkin lymphoma, occasionally breast); mixed lytic-sclerotic patterns can be seen in some cases (breast, pulmonary). Peripheral metastases usually present as permeative or “motheaten” lytic lesions. A paucity of periosteal reaction is typical (44,45 and 46,49,50 and 51,53,55,63,64). Conversely, the initial presentation may occasionally reveal a focal, lytic lesion with a 
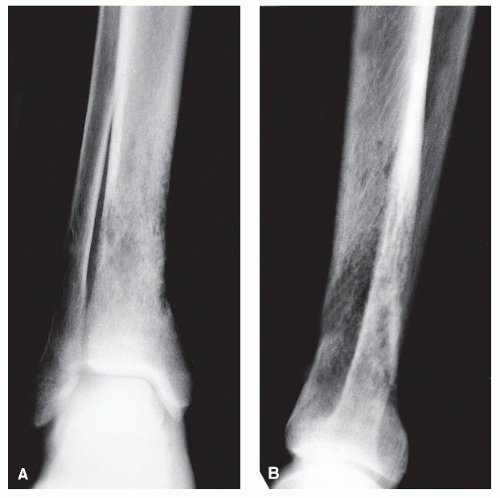
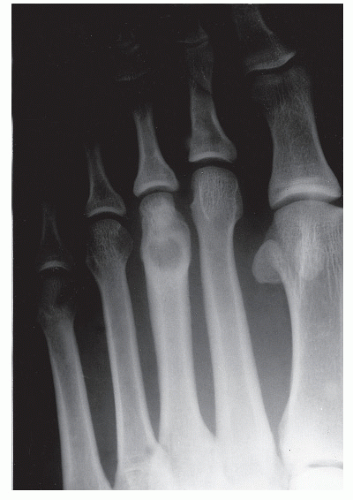
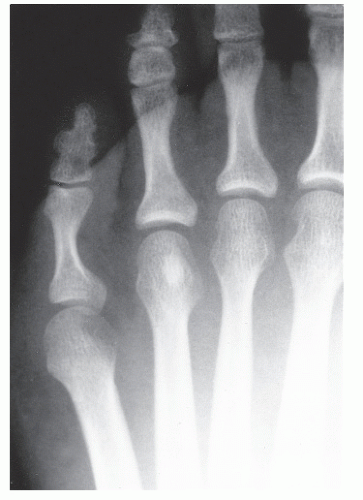
defined zone of transition between normal bone and tumor. Progressively, however, the zone of transition becomes indistinct, and the lysis involves widespread areas of one or many bones. Metastatic disease affecting the foot and ankle usually spares the joint and leaves behind a thin rim of subchondral bone; in this respect, metastatic disease may resemble chronic granulomatous infection involving the periarticular region. In this regard, one must be wary of the general differential diagnosis of the lesions that commonly involve both sides of the joint, that is, arthritis, infection, metastasis, and multiple myeloma (65) (Fig. 93.2).

MR Imaging: Metastatic seeding in the bone marrow generally results in either focal or diffuse areas of decreased signal intensity (SI) of marrow fat with T1W images, high SI with fatsuppressed images (e.g., STIR), and variably intermediate or high marrow SI with T2W images, depending on the particular tumor.

In several studies, MRI has actually been shown to be more sensitive than 99mTc bone scanning in detecting bone metastases (66,67 and 68). Although several studies have promoted the use of whole body MRI as an alternative to bone scanning in evaluating the entire skeleton for metastatic disease (66,67,69), it is generally considered impractical by most—in no small part secondary to prolonged scan times and cost.


PLAIN-FILM EVALUATION—THE ESSENTIALS

The radiographic image is fundamentally a series of gray-scale tones resulting from the density or thickness differences of biologic tissues (although the atomic number of the given tissue is significant at extremely low kilovolt settings). Regions of increased density, mass, or thickness locally result in greater relative x-ray beam attenuation, which then ultimately corresponds to a locally whiter or (clearer) film image. Decreased density, mass, or thickness leads to darkening of the plain-film image. Contrast, therefore, represents the magnitude of these differences in film density (overall gray tone) across a boundary or edge. Most bone tumor imaging depends on adequate or accentuated contrast differences between the lesion and surrounding bone or soft tissue.


A basic understanding of the mechanical properties of bone is necessary to anticipate or recognize a disease and its resultant osseous responses. This is reflected in Wolff law, which states that the functional demands placed on bone control skeletal morphology. External forces create internal strains that govern local bone remodeling (65). In response to strains generated within bone (either from external stress or from internal defect), the skeleton adapts, by bone remodeling, and attempts to provide structural support for functional demands. This structural support is radiographically manifested as trabeculae oriented perpendicular to the plane of the applied external force, thus neutralizing the external force. Trabeculae also hypertrophy or thicken in response to increased load and thereby become radiographically “whiter” or sclerotic.

Most radiographic changes accompanying osseous tumors result from the body’s response to the presence of tumor and not from the tumor itself. This response and subsequent osseous reaction occur at the cellular level. Increased tumor activity activates bone remodeling. This activation occurs secondary to local hyperemia or pressure from an enlarging mass (18). Bone remodeling begins with osteoclastic resorption, which produces osteolysis, radiographically apparent as darkened, osteopenia, or lysis. 
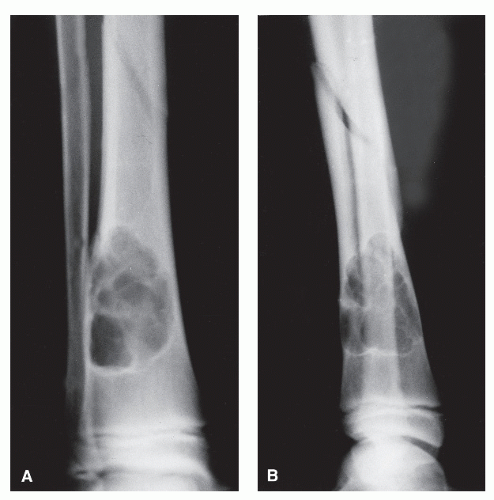
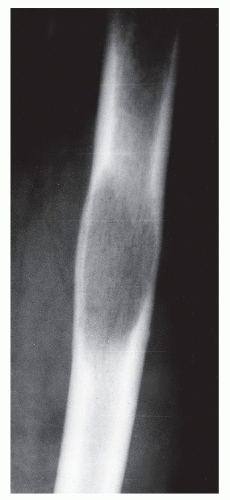
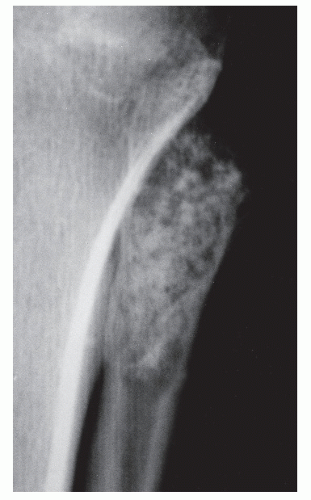
The mass of bone in this specific cross-sectional area of lysis is decreased, and increased stress is placed on bone adjacent to lysis. Bone continues to remodel around this internal defect as osseous matrix is laid down and is mineralized to resolve this stress. Thus, the repair or remodeling process is directly proportional to the biologic activity of the tumor or cohesiveness of tumor cells. Slow tumor activity allows for complete osseous remodeling, which produces a so-called benign radiographic appearance, that is, the sclerotic reactive rim surrounding a zone of geographic lysis (Ia lesion) (Fig. 93.3). Therefore, it is also chronologically evident that the essential element in disease is considered to be the reaction of the individual. Under optimal conditions, at least 10 days must elapse before radiographic evidence of osseous cellular activity can be demonstrated (12,15,25,33). This activity may, however, be appreciated in 5 to 7 days in children.

Contrast is the essential radiographic component to visualizing a bone tumor. Even though remodeling may be occurring, it is well known that other parameters must be in accord before lytic or proliferative changes are radiographically evident. According to Madewell et al, “the perception of osteolysis on plain radiographs depends on the structure of bone (cancellous vs. cortical), the quantity of bone loss, and the amount of adjacent host bone available for contrast” (18). Inherent bone stock in a particular region must generally be sufficient to delineate contrast at the bone-tumor interface. Underlying osteopenia, for example, can significantly diminish the contrast between the bone and tumor. Even when the underlying bone “stock” is normal, the inherent characteristics of the type of involved bone, that is, cancellous versus cortical, affect the appearance of an osseous lesion. The apparent radiographic difference between cortical and cancellous bone is directly related to the degree of “porosity” or nonmineralized tissue (70). Cancellous bone is a richly vascularized, “porous” lattice of mineralized matrix evinced radiographically as a honeycomb of trabeculae housed in a thin, solid cortical shell. In the foot, cancellous bone comprises the tarsal bones as well as the ends of long or tubular bones. This lattice entails a much larger surface area when compared with cortical bone.


Figure 93.3 A: Brodie abscess of the navicular. A rounded geographic lesion with well-defined sclerotic internal margination is noted in the central navicular. The sclerotic “rind” is thick and has a poorly delineated external interface or periphery. B: The sclerotic margins are best appreciated on the CT scans.


In contradistinction, cortical bone has an increased ratio of mineralized matrix to surface area and displays decreased porosity when compared with cancellous bone (71,72). Specifically, the nonmineralized “porous” portion of cortical bone ranges from 5% to 30%, whereas the “porosity” of cancellous bone may encompass between 30% and 90% (70). Furthermore, there is a slight increase in the density of matrix mineralization within cortical bone. Thus, the “porosity” and, to a lesser degree, the density account for the visibly compact nature of cortical bone when compared with cancellous bone (73).

One may therefore correctly surmise that the detection of osteolysis is easier in cortical bone than it is in cancellous bone (15,74). The background density of cortical bone affords greater contrast at the interface between normal bone and the tumor. This is clearly evident when one compares a lesion found in the corticodiaphysis and a lesion found in the medullary diaphysis. The cortical lesion is seen with multiple oblique views to the lesion, whereas the medullary lesion may not be detected at all with conventional radiographs (15).

Subtle changes may be seen before overtly apparent focal lysis in areas of cancellous bone. In the metaphysis and epiphysis, a change in trabecular orientation of cancellous bone may subsequently manifest as osteolysis because this is indicative of bone remodeling (23,74). In bone that is not osteopenic, an area of fading trabecular density may be the precursor to frank osteolysis. Two subtle findings in the medullary canal may correlate with cellular activity: lack of clarity (haziness) at the corticomedullary junction and endosteal scalloping of cortical side of the corticomedullary junction (13).

Recognition and evaluation of specific radiographic features are the foundation of formulating a differential diagnosis and estimating malignant potential. These can be divided into two stages. The first stage focuses on the assessment of basic anatomic characteristics of the lesion; this includes size, shape, and position within bone. However, a simple knowledge of anatomic tendencies may prove to be integral in reaching a final diagnosis. The second phase of the radiographic approach involves evaluating the osseous response to the tumor. Estimation of growth rate, appraisal of periosteal reactions, and appreciation of matrix patterns are critical steps in establishing a malignant or benign nature of a specific lesion. Although each is an indirect measure of biologic activity, collectively they can be extremely reliable when evaluated properly and placed into clinical perspective. Finally, important clinical data such as age and sex of the patient help the radiologist to generate a list of most likely diagnoses. Edeiken et al (41) stated that, in their experience, the correct diagnosis of a specific malignant bone tumor can be made from age alone approximately 80% of the time (Table 93.2).

Evaluation of simple characteristics such as size, shape, and position within bone initially may be overlooked or even omitted. Malignant tumors are usually larger than benign tumors. Benign tumors rarely expand to a diameter greater than 6 cm, whereas malignant tumors usually grow beyond 6 cm and often grow to more than 10 cm in diameter. Despite these general considerations, it is certainly possible for a slow-growing benign lesion to surpass 6 cm in diameter before radiographic detection. Likewise, early detection of a malignant process may occur before it reaches 6 cm in diameter. Thus, the size of a lesion is not a highly reliable sign by itself, but it can be an important consideration when reviewing the entire diagnostic picture (1,14,15).

Accurate assessment of the shape of a lesion may be difficult with plain films alone. A CT scan or MRI may be needed to appreciate the morphology of a specific tumor fully. Shape is not a reliable parameter to assess the nature of a lesion. However, a constant shape without sharp changes in contour is more characteristic of a benign process (16). In general, incipient lesions and those arising in irregular tarsal or epiphyseal bone tend to be round, whereas the oval shape predominates in those bones that display longitudinal growth through maturation (20).


TABLE 93.2 Bone Tumors: Age Distribution in Percentage


Peak Incidence (age range in years)


Benign tumors and tumorous conditions


Osteoma


15-45


Osteoid osteoma


10-20


Benign osteoblastoma


10-30


Osteochondroma


10-30


Enchondroma


25-40


Central chondroma


10-40


Chondroblastoma


10-20


CMF


10-30


Nonosteogenic fibroma


10-20


Desmoplastic fibroma


10-30


Lipoma


30-50


Neurilemoma


10-30


Hemangioma


40-50


GCT


20-40


Simple bone cyst


5-20


ABC


10-30


Primary malignant tumors


Osteogenic sarcoma


10-20


Parosteal osteosarcoma


20-40


Chondrosarcoma


30-60


Fibrosarcoma


30-40


Malignant GCT


30-50


Adamantinoma


10-30


Hemangioendothelioma


30-40


Ewing sarcoma


10-20


Reticulum cell sarcoma


30-60


Myeloma


50-80


Chordoma


30-60


Other tumors


Leukemia


Acute


2-6


Chronic


40-70


Metastatic neuroblastoma


<4


Metastatic carcinoma


40-80


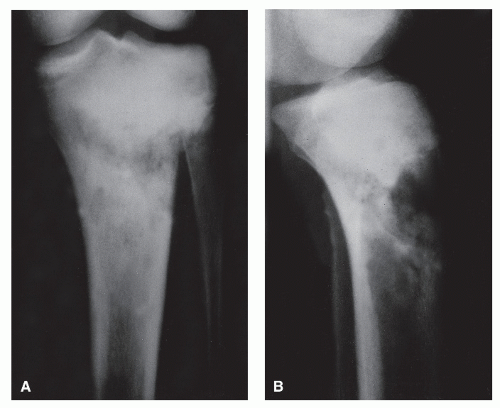
The anatomic position along the length of a bone can often give clues to the predominate cell type with respect to histogenetic lineage. Each section of bone, when considered longitudinally, has one or possibly a few predominate cell types with an inherent cellular activity. The diaphysis has an intermediate cellular activity and is composed of primarily round cells. Progressing away from the diaphysis, normal cellular activity increases. The metadiaphysis consists of primarily fibrous tissue internally, whereas externally, periosteal cellular activity predominates at the metaphyseal flare. The metaphysis possesses the highest cellular activity and is composed of osseous and cartilaginous cell types. The epiphysis demonstrates the least activity and displays an osteoclastic nature. “In general, a particular
tumor of a given cell type usually arises in that field where the homologous normal cells are most active” (
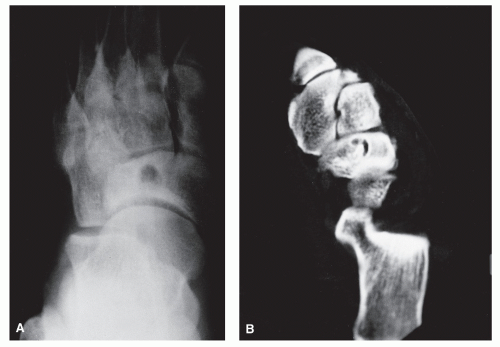
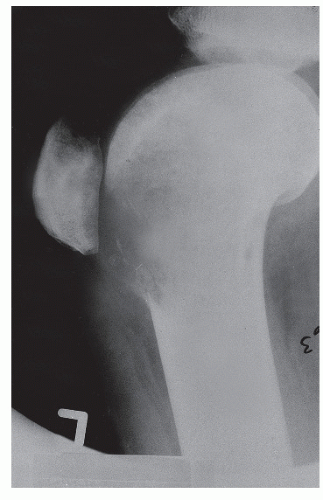
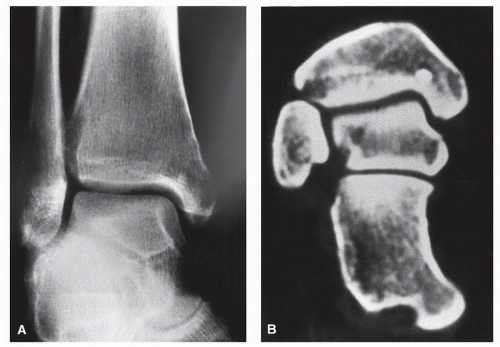
75). For example, during enchondral bone formation, osteoclasts resorb calcified cartilage. Before physeal closure, a giant cell tumor (GCT) (osteoclastoma) is most likely to occur where osteoclasts are most active: the zone of calcified cartilage. After closure of the physis, excessive bone remodeling takes place at the site of the previous physis. The first step in bone remodeling is bone resorption or osteoclastic activity; thus, a GCT may be seen at the metaphysis, the metaepiphysis, or the epiphysis once the physis is closed (75) (Fig. 93.4).


Figure 93.4 Composite diagram illustrating frequent sites of bone tumors. The diagram depicts the end of a long bone, which has been divided into the epiphysis, metaphysis, and diaphysis. The typical sites of common primary bone tumors are labeled. (Redrawn from Radiol Clin North Am 1981;19(4).)


PATTERNS OF RADIOGRAPHIC DESTRUCTION

Three radiographic patterns of osseous destruction can generally be appreciated when evaluating lytic processes: geographic, moth-eaten, and permeative patterns. The accurate recognition of one of these patterns not only helps to identify the lesion or to generate differential diagnoses but also reflects the aggressiveness of the lesion (21,76,77 and 78). In many respects, the inferences derived from an analysis of the overall radiographic silhouette of a given bone tumor parallel those one can draw (with respect to benign vs. malignant) when studying skin tumor “silhouettes” with low-power microscopic histologic examination (79).


GEOGRAPHIC (TYPE I) DESTRUCTION

Large solitary or occasionally multiple large osteolytic defects occur within the bone. The caliber of each zone of geographic destruction usually measures 1.0 cm or greater in diameter (13). These lesions are typically slow growing with well-defined internal margins. However, both internal and external margins are routinely “graded” when geographic destruction of bone is present, thereby defining the radiologic “capsule” or “rind.” A fading outer margin is commonly associated with inflammatory disorders of bone such as osteomyelitis, Brodie abscess, and eosinophilic granuloma (18). As long as the internal margin is sharply defined, correlation between the radiologic and histologic boundaries of these lesions is good. Geographic lesions are further subdivided based on their specific margin types, which are associated with differing growth rate assignments or grades (see the discussion on grading later) (Fig. 93.5).


MOTH-EATEN (TYPE II) DESTRUCTION

Multiple small holes of internal lysis of varying size, typically ranging from 2 to 5 mm in diameter, are noted. This pattern of destruction can usually be appreciated in both cortical and cancellous bone. However, if the process is incipient or if preexisting osteoporosis is present, moth-eaten destruction can be difficult to detect in cancellous bone. In cortical bone, type II destruction typically begins on the endosteal surface and erodes outward to produce cortical destruction (18). This pattern is typically associated with rapidly growing lesions and with widened zones of transition (Fig. 93.6).


PERMEATIVE (TYPE III) DESTRUCTION

Type III destruction represents the most aggressive of the osseous destructive patterns and is seen in malignant diseases such as metastasis, Ewing sarcoma, mesenchymal cell malignancies, and leukemia. However, it may also be seen in aggressive, nonmalignant processes such as hematogenous osteomyelitis (Fig. 93.7). In permeative destruction, virtually countless numbers of extremely small-caliber (usually 1.0 mm or less) oval to elongated linear holes of destruction impart a “streak-like” character to an underlying long bony cortex. Best visualized in cortical bone, these streaks of internal destruction literally percolate or infiltrate the cortex. This most often does not result in overt cortical erosion. Bulging of the cortex is also less likely. There is a certain similarity of radiographic features of permeative internal lysis to those of rapidly forming osteopenic conditions (e.g., reflex dystrophy) where activated osteocytic resorption manifests as lucent “tunneling” within the diaphyseal cortex. From a pragmatic perspective, individual locules of destruction are rarely
measured for size outside of the pathology lab. The authors have adopted a simple approach: With moth-eaten destruction, individual holes of internal lysis are discernable from a distance with plain-film studies. In contradistinction, when viewing permeative bone destruction at a distance, only the additive effect can be discerned, that is, overall rarefaction or “graying” of the diaphyseal cortex. Within the intramedullary canal, permeative lytic lesions tend to become invisible (21,76).


Figure 93.5 Anteroposterior (A) and lateral (B) radiographs of a large nonossifying fibroma of the distal tibia in a child. A mildly expansile oval geographic lesion eccentrically located within the tibia presents with well-defined thinly sclerotic margins and a Ia growth rate. The outer margins appear scalloped, and the lesion displays the characteristic multiloculated, bubbly or “grape-like” appearance. A spiral oblique pathologic fracture is noted emanating from the superolateral aspect of the lesion. The risk of pathologic fracture is increased in lesions that involve more than 50% of the width of the affected bone.


GRADING OR GROWTH RATE MARGINS

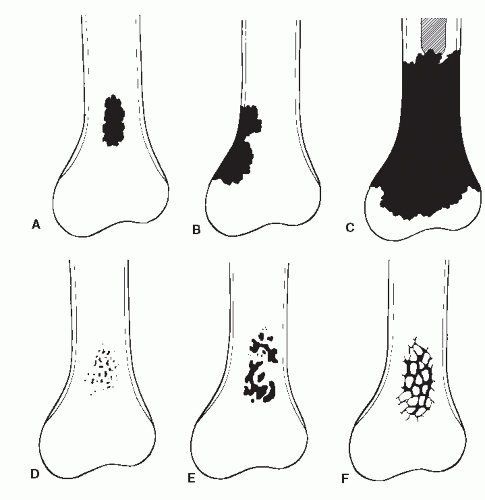
The manner in which bone loss presents on plain-film radiographs over time correlates to the rate of growth of the specific lesion. Bony destruction is analyzed and placed into five separate grades: Ia, Ib, Ic, II, and III. These number grades are not exactly analogous to the aforementioned numeric assignments to the type of destruction. Rather, they are meant
to correlate with a specific lesion’s probability of being benign or malignant. Grade Ia is latent or the most benign, whereas grade III has the most malignant characteristics. The analysis is based primarily on the pattern of destruction—geographic, moth-eaten, or permeative, but other factors such as the presence of a sclerotic rim surrounding the lesion, the degree of cortical integrity, the presence of a soft tissue mass, and the appearance of an expanding cortical shell also aid in placing a lesion into an appropriate grade.


Figure 93.6 Osteosarcoma of the proximal tibia. Homogenous cloud-like ossific matrix diffusely involving the proximal tibial metaphysis. Underlying moth-eaten destruction can be discerned in the interval traversing the distal metaphysis, where no matrix is apparent. This is an example of a type III growth rate. (Courtesy of Norman Ende, MD.)


Figure 93.7 Permeative destruction of the middiaphysis of the tibia. Extremely small, multiple areas (<1.0 mm) of internal bony lysis can be seen permeating into the posterior cortex, with partial erosion of the cortex. Some larger zones of moth-eaten destruction can be seen centrally. This lesion does appear to have arisen in a preexisting zone of geographic destruction and therefore should be assigned a type III growth. The lesion proved to be a reticulum cell sarcoma. (Courtesy of Norman Ende, MD.)

Space-occupying lesions of bone become radiographically evident as the contrast across their margin increases. Intact trabeculae of cancellous bone adjacent to the edge of the lesion heighten contrast. Imaging of lesions that are solely intramedullary within the diaphysis therefore becomes problematic because of the lack of marginal cancellous bone (18,80). Indeed, proliferative changes such as a rim of sclerosis or increases in trabecular texture are seen earlier and more easily in the metaphyseal and epiphyseal cancellous bone. However, the proliferative response of the periosteum is appreciated better in the cortical bone of the diaphysis. The final grade is ultimately a representation of the cellular activity for a specific instance in time. Sequential grades of the same lesion over time will give insight into the growth rate of that particular tumor. The role of the initial grade is to direct the subsequent management, that is, serial radiographic evaluation or surgical biopsy for histologic analysis.

The margin depicts the interface between the tumor and the adjacent host bone. In benign processes, the margin is typically distinct. Slow-growing processes can produce complete osteolysis (no remaining trabeculae surrounded by tumor) within a given area of bone with narrow zones of transition between tumor and host bone. The end result is a geographic area of osteolysis with a well-demarcated peripheral edge. If growth is slow enough, proliferative adaptation of the surrounding bone will take place and will produce a rind or rim of sclerosis. This rind of sclerosis, the most reliable sign of indolence, is benign to the ninety-eighth percentile (13). As the margin becomes less distinct, one sees a broader zone of transition. An imperceptible margin with diffuse, infiltrative destruction points toward a fast-growing, malignant process. The five grades employed in radiologic growth rate assessment are described in the following paragraphs.


GRADE IA: GEOGRAPHIC DESTRUCTION WITH SCLEROTIC MARGIN

This is considered the slowest grade of growth rate and is most likely a benign process. The radiographic margin correlates with the actual histologic edge of the lesion. In neoplastic diseases, the outer edge of sclerosis is well defined and the inner border of sclerosis is poorly defined or “hazy,” whereas chronic infectious or inflammatory Ia lesions have fading or poorly defined outer sclerotic margins and sharply defined inner sclerotic aspects. The differential diagnosis includes bone cyst, fibroxanthoma, fibrous dysplasia, chondroblastoma, chondromyxoid fibroma (CMF), enchondroma, osteoblastoma, Brodie abscess, and eosinophilic granuloma (Fig. 93.8).


Figure 93.8 Geographic lesion of third metatarsal with a Ia growth rate. A bone tumor of the distal metaphysis of the third metatarsal appears as a solitary, rounded zone of lysis greater than 1.0 cm in diameter with sharply delineated, sclerotic internal margins. The nontrabeculated expansion of the cortex represents a newly formed continuous periosteal reaction with the underlying cortex resorbed.


Figure 93.9 Three examples of geographic lesions with Ib growth rates. A: Proximal femur. B: Femoral trochanter. C: Proximal tibial metaphysis. The lesions appear as solitary, large zones of geographic, sharply defined destruction but without reactive, sclerotic margins. (Courtesy of Norman Ende, MD.)


GRADE IB: GEOGRAPHIC DESTRUCTION WITHOUT SCLEROTIC MARGIN BUT WITH A NARROW (WELL-DEFINED) ZONE OF TRANSITION

Grade Ib growth rate suggests only slightly faster growth rate than Ia, but it is still a slow-growing lesion that is most likely benign. The radiographic margin correlates with the actual histologic edge of the lesion. Intramedullary Ib diaphyseal tumors, without significant cortical involvement, may appear almost invisible inasmuch as there is no cancellous bone to define their edge. In this case, only internal cortical scalloping may then suggest the presence of this lesion (18). GCTs are prototypical Ib lesions. The differential diagnosis of Ib lesions generally otherwise includes the previous Ia lesions (Fig. 93.9).


GRADE IC: GEOGRAPHIC DESTRUCTION WITH AN ILL-DEFINED MARGIN

Grade Ic lesions are more aggressive than Ib lesions and should be thought of as equivocal lesions, that is, not clearly benign. In these lesions, the destructive process probably extends beyond the radiographic margin (10,21) (Fig. 93.10).


GRADE II: COMBINATION OR CHANGING PATTERN WITHIN A SINGLE LESION

These lesions are often admixtures of geographic lysis and moth-eaten or permeative destruction. This pattern suggests a much more aggressive process than grade I lesions, and cortical integrity is often suspect. Grade II growth rates may be seen in association with malignancies such as fibrosarcoma and aggressive GCTs, osteomyelitis, and histiocytosis (10,21) (Fig. 93.11).


Figure 93.10 Telangiectatic osteolytic osteogenic sarcoma of the midshaft femur, with a mildly expansile geographic zone of destruction with poorly defined margination. Although the initial growth rate appears to be Ic, close inspection within this lesion suggests the presence of internal permeative destruction. Growth rate assignment is therefore Ic or II. (Courtesy of Norman Ende, MD.)


Figure 93.11 Fibrosarcoma of the knee. A lytic zone involves the distal anterior femoral metaphysis beneath the patella. The overall appearance suggests an eccentric geographic zone with poor margination. The proximal margin displays a moth-eaten “edge.” Therefore, a type II growth rate is best assigned. (Courtesy of Norman Ende, MD.)


GRADE III: OVERT MOTH-EATEN (GRADE IIIA) OR PERMEATIVE (GRADE IIIB) DESTRUCTION

These are the most aggressive lesions. They have no suggestion of a preexisting geographic lesion. Cortical integrity is commonly violated with an associated soft tissue mass in this grade.


PERIOSTEAL REACTIONS

Periosteal reactions are a general indicator of the biologic activity of a bone lesion (25). The radiographic data obtained in the evaluation of a periosteal reaction associated with a bone tumor can provide important information on whether the lesion is aggressive or not. Nevertheless, even though periosteal reactions are a reflection of the biologic activity of a bone lesion, it is generally a mistake to think that given morphologic features of a periosteal reaction are specific, pathognomonic, or diagnostic of any particular bone tumor. As an added caveat, even the more aggressive periosteal patterns have been occasionally noted with benign bone tumors. Therefore, it is accurate to think of classifying the periosteal reaction as a “puzzle piece” to be combined with other data such as type of destruction, margination, and growth rate assessment and matrix determination.

Much of the discussion in the following sections on the radiographic evaluation of periosteal reactions and matrix formation has been condensed from articles as well as our own experience in applying these classification principles to the radiographic analysis of periosteal reactions (19,25).

The periosteum is an overlying covering or sheath around bones that plays a role in bone turnover throughout development and life. It is specifically composed of an outer fibrous layer and an inner cellular cambium layer. The periosteum is joined to the underlying cortex by perpendicular collagenous strands known as Sharpey fibers (10,22,81). The periosteum around the normal adult long bone is relatively dormant and mainly fibrous, with minimal cellularity. However, during periods of rapid normal growth, response to injury, or some local or central pathologic stimuli, the periosteum can become thick, and the two layers can be distinctly separate. Nevertheless, Ragsdale et al suggested that the delineation of two distinct layers of the active periosteum is a convention that can be misleading because it obscures the probable likelihood that the plane between these layers is a transitional zone; the fibrous layer can be replenished from the surrounding parosteal soft tissues such as fascia, fat, and muscle (19,25). The earliest phase in this process is the progressive modulation of fibroblasts to active “preosteoblasts.” Ultimately, the transition of these cells to osteoid-secreting cells is made within the outer fibrous layer. Often, new bone formation around the cortex is noted in this fashion by parosteal soft tissue structures without the formation of the traditional “dual-layered” interface or periosteum (19,25).

Once the periosteum has been activated to produce new bone by some stimulus, a lag occurs in the time it takes for the appearance of mineralization on the radiograph. Even with vigorous periosteal activity, it can take from 10 to 21 days after the initiating stimulus for periosteal mineralization to be appreciated. Periosteal reactions become apparent earlier in younger people. The appearance of a periosteal reaction in a pathologic process is variable; it is rarely noted with tumors such as chondrosarcomas and fibrosarcomas, whereas it is typically present with Ewing sarcoma, osteosarcoma, and solitary metastasis (especially osteoblastic) (10,82). The periosteum is commonly elevated in infectious processes such as osteomyelitis and subperiosteal abscess by pus, by dilated periosteal vessels or edema, by passive hyperemia (10,19,83), or by tumor or hemorrhage (1,10,17,21,81).

The nomenclature of lesions affecting the bony surface can be confusing. In general, the lesions of juxtacortical origin can be divided into cortical, subperiosteal, periosteal, parosteal, and paraosseous lesions (84). Subperiosteal lesions separate the periosteum from the cortex and result in subperiosteal new bone formation. Often, these bony lesions leave the underlying cortex grossly intact, and they have entered the subperiosteal space by cortical “percolation” through Volkmann canals and haversian systems or, less commonly, by vascular penetration (diaphyseal vessels) (19). Periosteal lesions originate from the deep layer of the periosteum and are usually firmly attached to the cortex. As this type of tumor (e.g., periosteal chondroma) enlarges, the periosteum may locally be elevated. The “sunburst” periosteal reaction is probably an aggressive form of periosteal lesion (e.g., osteosarcoma) (84). Parosteal lesions originate from the outer fibrous layer of the periosteum, whereas paraosseous lesions originate from completely outside the periosteum and display a soft tissue cleavage plane separating the lesion from the periosteum and cortex (84).

With respect to the radiographic analysis of periosteal reactions of bone tumors, paradoxically, it is often the case that “nothing is so bad as something that does not look so bad.” For example, imposingly thick, homogeneous periosteal reactions often accompany slow-growing, benign lesions, whereas more
aggressive lesions have finely layered, wispy, spiculated, porous, or lace-like patterns. In the latter instance, lace-like periosteal reactions are particularly worrisome, inasmuch as they are easily confused with inflammatory soft tissue swelling on plain-film radiographs.

Morphologically, periosteal reactions are best evaluated with the classification system outlined by Ragsdale et al (19), whereby they are divided into three general categories: continuous, interrupted, and complex (19,25). Continuous periosteal reactions are then further subdivided based on whether the underlying cortex is intact or has been resorbed in association with the appearance of ballooning-type expansion (19,25).


CONTINUOUS PERIOSTEAL REACTIONS WITH THE UNDERLYING CORTEX DESTROYED

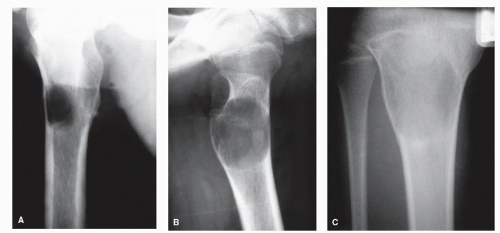
Bone is a rigid structure that has virtually no capacity to expand or “balloon.” For bone to display these structural alterations, significant endosteal resorption of the original cortex must have occurred at a rate greater than outer periosteal new bony “shell” formation around the bone tumor. Although this is typical of many geographic lesions (especially those arising within small or narrow tubular bones, e.g., phalanges, metatarsals and fibula), any sudden expansion of an existing benign bone lesion should be viewed as an aggressive change in its biologic growth rate and therefore may represent malignant degeneration. Uniform replacement of the original cortex usually results in smooth shell expansion. This is typical of tumors such as unicameral bone cysts, intraosseous lipomas, fibrous dysplasia, and chondroblastomas. Lobulated or trabeculated new periosteal cortical shells contain ridges and furrows that are apparent on the radiographs. These sclerotic “weaves,” which appear to be regularly or irregularly interspersed throughout the tumor, probably represent normal cortex that has remained relatively intact around areas of asymmetric or irregular tumor growth. Lobulated shells may develop trabeculated patterns. Although tumors such as GCTs, desmoplastic fibromas, and aneurysmal bone cysts (ABCs) may present with smooth cortical shell, they most typically are characterized by trabeculated cortical expansion. The trabeculation is fine in the case of ABCs and GCTs. Other tumors such as enchondromas, nonossifying fibromas, CMFs, and slow-growing malignant tumors may also present with trabeculations.


CONTINUOUS PERIOSTEAL REACTIONS WITH THE UNDERLYING CORTEX INTACT

Most of these patterns arise secondary to the subperiosteal presence of some pathologic process whereby the underlying cortex persists.


SINGLE LAMELLAR AND SOLID REACTIONS

Initially, a single layer of periosteal new bone may be apparent, with the underlying bony cortex grossly intact. At this time, the underlying lesion may or may not be aggressive, although most typically it is benign in nature. If a single layer homogenously thickens beyond 1.0 mm and remains continuous, it is then most appropriately labeled as a solid periosteal reaction. It must be noted that these reactions are nonspecific and may be seen locally in many benign processes such as infection, medullary infarction, consistent (nonepisodic) irradiation (85), trauma, as well as with malignant processes (1,19,85). Solid periosteal reactions can also arise from the thickening of a single layer or by slow formation of an overlying new layer of bone that binds with the original layer of bone. In either case, solid periosteal reactions are generally held to be the radiologic hallmarks of benign processes (41), and they are typically seen in conditions such as osteomyelitis, eosinophilic granuloma, bone abscess, myositis ossificans, healing fractures, and subperiosteal hematoma. The tendency is for the limited resolution of the plain-film radiograph to obscure the true nature of finely spiculated or lamellar periosteal reaction patterns and to produce an almost solid-appearing reaction.


MULTILAMELLAR REACTIONS

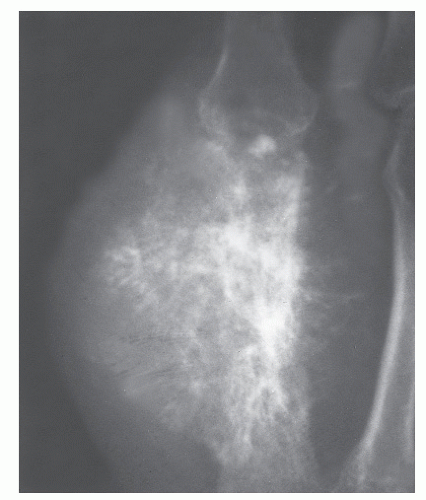
Unlike solid periosteal reaction formation, the single lamellar periosteal reaction may progress with the formation of a continuous multilamellar or “onion-skin” periosteal reaction composed of multiple layers of ossification clearly separated by radiolucent spaces of variable thickness. This periosteal reaction is thought to arise from the episodic formation of concentric “planes of ossification beyond the cortex,” probably the result of cyclic variation in subperiosteal tumor growth, that is, with repeated phases of rapid periosteal elevation. Lamellated periosteal patterns may be seen in both benign and malignant processes. Rapid or aggressive processes have a tendency to display thinner ossific planes and wider spaces and vice versa (10,19). The tendency is to overplay the association of multilamellar periosteal reactions with malignant processes. Although these reactions are commonly noted in association with Ewing sarcoma, they clearly are not pathognomonic for this tumor. In our own clinic, multilamellar periosteal reactions have occasionally been noted in association with such benign processes as osteomyelitis, histiocytosis, ABCs, and hypertrophic pulmonary osteoarthropathy, as well as with other malignant bone tumors such as osteogenic sarcoma and metastases (10,19) (Fig. 93.12).


PARALLEL, SPICULATED PERIOSTEAL REACTIONS

These patterns have also been described as “hair on end” patterns. Generally associated with rapidly aggressive processes (10,19,22), these periosteal patterns can be seen in malignant tumors such as Ewing sarcoma and occasionally osteosarcoma. However, these reactions are also seen in marrow disorders such as sickle cell anemia and thalassemia, as well as in certain inflammatory disorders such as syphilis and myositis (1,10,16,19,25). Two-dimensional radiographic projections obscure the finding that these are actually ossific walls of a honeycomb structure in the subperiosteal space. This is the result of osteoblasts that become oriented midway between vertically oriented periosteal blood vessels extending from the cortex to the periosteum (19,25).


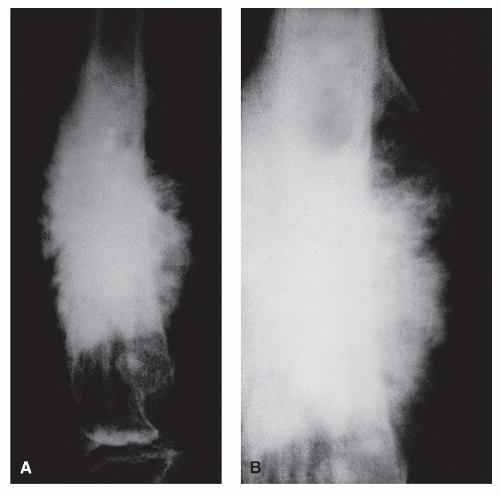
DIVERGENT, SPICULATED (SUNBURST) PERIOSTEAL REACTIONS

As the name implies, long perpendicular spicules of delicate subperiosteal new bone formation appear to emanate from a common center and diverge as they extend from the cortex to the periosteum. Although it is considered an aggressive pattern, the underlying cortex generally persists. Most suggestive of osteogenic sarcoma, sunburst periosteal reactions are not
pathognomonic for the underlying presence of this tumor because they have been occasionally noted in osteoblastic metastases from breast and prostatic carcinoma, actinomycotic osteomyelitis, and hemangioma (19,22). However, as Nelson pointed out, this association is extremely rare and is hardly ever seen in pyogenic osteomyelitis. As a variety of spiculated pattern, it is best classified as a complex type of reaction (Fig. 93.13).


Figure 93.12 Ewing sarcoma of the femur. Although the underlying destruction is almost invisible radiographically, multilaminate (“onionskin”) periosteal reactions are noted circumferentially involving the middiaphysis of this femur in an adolescent patient. Multilaminate Codman angles can be seen adjacent to the medial middiaphysis. This finding suggests extraosseous sarcomatous extension. (Courtesy of Norman Ende, MD.)


INTERRUPTED PERIOSTEAL REACTIONS

Any one of the aforementioned periosteal reactive patterns may be resorbed by a tumor and may thereby produce the appearance of an interrupted periosteal reaction. This strongly suggests that the bone tumor has become extraosseous, that is, in the surrounding soft tissues. Furthermore, when the periosteal reaction has been lysed or resorbed centrally or at its middle to form an interrupted “cuff” of new bone on either side of the primary focus, sarcoma is strongly suggested (19,86). A clearly defined extraosseous soft tissue mass associated with an underlying bony lesion is almost always caused by a neoplasm and is rarely the result of a bone infection (22).


BUTTRESS REACTIONS

Buttress reactions (periosteal “buttressing”) present as if they are interruptions of solid periosteal new bone formation and as such appear as solid triangular wedges of periosteal bone that form (or remain) at the lateral extraosseous margins of slowly enlarging bone lesions. These lesions are commonly associated with geographic destruction with a shell-type periosteal reaction or are otherwise of periosteal or parosteal origin. Solid periosteal buttresses are typically found in lesions such as CMF and juxtacortical chondroma, but not exclusively benign lesions. Sarcomas
have presented with radiographic findings of what appears to be a buttress periosteal reaction. Sometimes, magnification radiography or histologic examination reveals the appearance of an interrupted fine, multilaminate periosteal reaction forming the buttress. Occasionally, buttress reactions form by the resorption of a preexisting solid periosteal reaction and should be considered a sign of aggressive change in a previously benign process (19). An exception may be osteomyelitic cloaca formation.
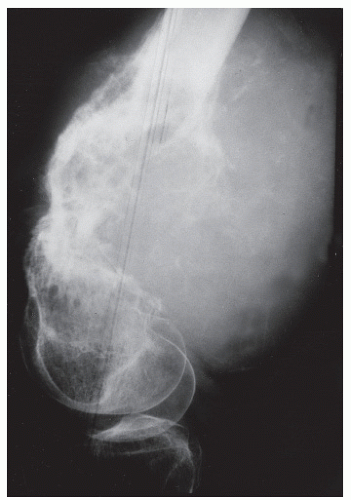


Figure 93.13 Osteosarcoma of the distal femur. A profoundly dense lesion with its epicenter over the distal femoral diametaphysis is apparent. Homogenous ivory-like ossific matrix production has completely obscured underlying osseous detail. However, a sunburst periosteal reaction is evident. Enlargement of the distal posterior femur reveals the presence of Codman angle proximal to sunburst periosteal reaction. (Courtesy of Norman Ende, MD.)


CODMAN ANGLE

These features are angular zones of periosteal bony formation at the edge of a lesion (3,17). In contradistinction to triangular buttress reactions, Codman angles are best referred to as angles because the base of the lesion is radiolucent (and only two sides of a triangle are noted). Although not pathognomonic for malignancy, the presence of a Codman angle generally suggests the presence of an aggressive malignant lesion that has broken out of the bone and into the surrounding soft tissue. This is especially true when multiple Codman triangles become radiographically manifest (10,87). Interrupted lamellated patterns may appear as buttress patterns when the layers are numerous and thin, and they are generally aggressive bone tumors. Eosinophilic granuloma in children is an exception. Interrupted spiculated periosteal reactions are most often associated with aggressive tumors of medullary origin, such as Ewing sarcoma, as well as with surface parosteal osteogenic sarcomas (Fig. 93.14).


COMPLEX PERIOSTEAL REACTIONS

Complex periosteal reactions are basically admixtures or variations of the aforementioned types. Generally, the more complex the periosteal reaction, the more aggressive it is likely to be. As stated before, the well-known sunburst divergent spiculated pattern is commonly a sign of malignant tumor osteoid production and not just a sign of periosteal reactivity. So-called lace-like periosteal reactions (resembling millinery or handkerchief lace), which have been associated with aggressive tumors such as Ewing sarcoma in children, are probably best included in this category. These reactions are of particular concern because their radiographic ossification pattern can be so fine as to mimic inflammatory soft tissue swelling on plain-film radiographs and may thereby suggest a lesion of lesser activity.


Figure 93.14 Aggressive lesion of the distal femur with marked destruction of the distal femoral diametaphysis. Marked underling moth-eaten destruction of bone can be seen extending toward the physeal area. Posterior Codman angle is obvious in association with a large posterior soft tissue mass. (Courtesy of Norman Ende, MD.)


MATRIX

The term matrix refers to the cellular, intercellular material elaborated by various mesenchymal cells and includes osteoid, chondroid, myxoid, and collagen fibers (19,25). The radiographic evaluation of matrix patterns can yield information that illuminates the true histologic identity of a matrix-producing tumor. Matrix-producing tumors are named for the products elaborated, such as chondrosarcoma and osteogenic sarcoma. Some tumors, such as osteochondroma and CMF, are named by their combined matrix products. Not all bone tumors elaborate a matrix. In fact, most bone tumors do not elaborate a matrix. In time, matrices of osteoid and chondroid almost invariably ossify or calcify when they are associated with a malignant bone tumor (41). Although many of the following patterns may be noted with either benign or malignant processes and are therefore not diagnostic of either, the resorption of a preexisting or long-standing matrix pattern within a given bone tumor should be viewed as a radiographic sign of aggressive change in its behavior (25) (Fig. 93.15).


CARTILAGINOUS MATRIX

Calcifying cartilaginous matrix patterns can be identified as punctate or stippled, flocculent, or curvilinear “ring and arc” osteosclerotic patterns within a given lesion. Generally, calcification of chondroid results in patterns that are patchy or inhomogeneous, especially when compared with ossific matrix patterns.

Stippled or punctate patterns are most commonly encountered within enchondromas and osteochondromas (10,19), and occasionally (~25%) they occur within chondroblastomas (19,88). These patterns are only rarely encountered with CMFs (89). The admixture of both stipples and floccules is seen in both benign and malignant cartilaginous bone tumors (19) (Fig. 93.16).


OSSIFIC MATRIX

As outlined by Sweet et al (20), three types of bone formation may be associated with bone tumors: (a) direct formation of osteoid or bone by neoplastic osteoblasts; (b) enchondral bone formation by activated normal cells, as seen in chondromas; and (c) reactive new bone formation by activated normal bone cells around the margins of slow-growing lesions or chronic processes. Reactive new bone formation has largely been discussed under internal margination.


Direct Formation

Once elaborated by neoplastic osteoblasts, mineralization of tumor osteoid is manifested radiographically by a homogeneous area of increased density. The degree to which ossification
occurs ranges from hazy to cloud-like, solid, or ivory-like. The degree to which the original trabeculae have been replaced by neoplastic matrix roughly correlates with radiographic density. Highly sclerotic osteogenic sarcomas typically replace most of the original bony trabeculae with mineralized matrix. Coarsely textured ossific patterns are seen with sarcomas that arise with a fibroblastic “background” (19), such as parosteal osteosarcoma. With parosteal osteosarcoma, ossification is denser and better organized in the center of the lesion. This is in contradistinction to myositis ossificans (21,46), in which organized peripheral ossification occurs with a relatively lucent center, thereby imparting an eggshell appearance to the lesion. Certain tumors, such as osteoblastoma, are typified by homogeneous ossific matrix formation in the center of a round or oval geographic lucency. The cytologically active peripheral margin largely remains radiographically lucent. Our experience suggests that this is also true with the plain-film radiographic appearance of medullary (cancellous) pedal osteoid osteomas (similar histologically to the osteoblastoma); that is, portions of the central nidus typically ossify with a lucent periphery. The surrounding normal bone then typically displays a sclerotic reactive interface that imparts a “bull’s-eye” appearance to the lesion.


Figure 93.15 Patterns of matrix mineralization. A-C: Relatively homogeneous mineralized (sclerotic) matrices, typical of mineralized tumor osteoid. A: Solid pattern of matrix mineralization. B: Cloud-like pattern of matrix mineralization. C: Ivory-like pattern of matrix mineralization. D-F: Discrete areas of mineralized (sclerotic) matrix typical of mineralized tumor cartilage. D: Stippled pattern of matrix mineralization. E: Flocculent pattern of matrix mineralization. F: Rings and arcs pattern of matrix mineralization. (Redrawn from Radiol Clin North Am 1981;19(4).)


Metaplastic Formation

The process of fibrous metaplasia of fibroblasts to bone-forming osteoblasts occurs. Most often apparent in fibrous tumors of bone, these can be difficult patterns to identify on conventional radiographic studies. Most often, fiber bone is formed, which histologically displays a randomly woven collagen pattern with polarized light microscopy. When numerous small trabeculae of woven bone are interspersed throughout the lesion, these myriad fine intramedullary radiographic densities less than 0.5 mm produce the so-called ground-glass matrix (1). Although sometimes coarsened, its appearance is primarily that of a poorly mineralized, hazy ossification pattern within the bony lesion. This pattern is strongly suggestive of fibrous dysplasia. Woven bone is rarely produced with sufficient density and uniform distribution throughout a fibrous lesion to give the radiographic appearance of solid sclerosis. However, large amounts of fiber bone laid down on preexisting spicules may, indeed, create the appearance of coalescent patches of sclerosis throughout these lesions. The radiologic appearance is not unlike the early intermediate stage “cotton-wool” new bone formation of the pagetic skull. Finally, healed fibrous lesions of bone (65), as well as brown tumors of hyperparathyroidism (85), may be associated with a zone of focal solid sclerosis.


Ischemic Injury

Ischemic injury or necrosis of marrow fat results in the development of a reactive interface between necrotic and viable tissues (19). Fat necrosis in bone typically results in the formation of densely hyalinized fibrous tissue at the peripheral reactive interface. Not only does dystrophic bone formation occur, but also the fibrous tissue can metaplastically modulate to form bone. The resulting linear or serpiginous nature of the otherwise flocculent intramedullary ossification pattern strongly suggests medullary infarction, especially when it courses near the endosteal surface of the inner cortex around the periphery of the pathologic zone (19,21). Dystrophic intralesional ossification, like that seen typically within intraosseous lipomas, is usually concentrated centrally within the lesion (19).


Figure 93.16 Enchondroma of the proximal fibula. An ovoid geographic lesion is noted involving the metaphysis and diametaphysis. A scalloped appearance of the inner cortex can be seen, and the distal margin is well defined but without reactive sclerosis. Punctate and flocculent internal matrix calcifications are noted throughout the lesion. (Courtesy of Norman Ende, MD.)


OSSEOUS TUMORS AND TUMOR-LIKE CONDITIONS


ENOSTOSIS

An enostosis is a discrete, intraosseous area of sclerosis commonly referred to as a bone island. Histologically, an enostosis consists of compact lamellar bone with haversian systems that represent a nest of cortical bone surrounded in cancellous intramedullary bone (90,91,92,93,94,95,96,97,98,99 and 100). The cause of bone island formation is unknown. Many investigators think that bone islands result from a developmental process because no link to disease or trauma has been substantiated in the literature (97,98).

A bone island can be seen in any bone, except the skull. There is a predilection for the femur, ribs, and pelvis. Two random studies noted that enostosis was found in the foot and ankle in 1 of 42 cases (9 metatarsal) and in 5 of 120 (all calcaneal) cases (97). Enostoses are seen in all age groups, but they most commonly affect adults. Most texts point to a male predominance (90,91), but other studies refute this by showing a female predominance (100), or no predominance (98).


Radiography.

Bone islands are oval or round, focal intramedullary osteosclerotic lesions involving cancellous bone. When oval or oblong, the enostosis is oriented parallel to the trabecular patterns of the surrounding bone. Round lesions tend to be located in either epiphyseal, apophyseal, or other bony locations not subject to significant longitudinal growth. This strongly suggests its origins in the immature skeleton. Usually, a bone island is an incidental finding on radiography. The diameter is usually 1 cm or less, but it has been reported to be as large as 7.5 cm (97). An enostosis exhibits benign features, appearing as a uniformly dense area of sclerosis. Although the contours of the lesions are generally smooth, close-up evaluation often proves that the margins of this area show a reticulated osseous pattern that blends with the surrounding spongy trabeculae. This creates the characteristic “brush-like” border (90,91,98) (Fig. 93.17). Osteolysis, periosteal reaction, or cortical involvement is absent. The lesion usually appears “cold” on radionuclide bone scan. These lesions are known to enlarge or decrease in size, and in these cases, bone scans have been positive. Differential diagnosis includes osteoblastic metastasis, osteosarcoma, osteoid osteoma, and osteopoikilosis.


Figure 93.17 Solitary enostosis of the fourth metatarsal head. A 1.0-cm focal osteosclerotic intramedullary condensation is located within cancellous bone. Even though the lesion appears well defined, close examination reveals a characteristic brush border.

Although the lesion is benign in its initial presentation, serial radiographs may be performed to rule out the possibility of a malignant process. Mirra recommended repeat plain films at 1-, 3-, 6-, and 12-month intervals. If the lesion is a bone island, it should not grow more than 25% in 6 months or more than 50% in 1 year. Growth exceeding one of these two parameters merits consideration for a bone biopsy (90).


OSTEOID OSTEOMA

Osteoid osteoma is a benign, bone-forming tumor that was first described by Jaffe as a neoplastic process in 1935 (101). All osteoid osteomas contain a nidus composed of osteoblastic mesenchymal tissue intermixed with immature bone and osteoid matrix. The nidus is highly vascular and contains small, unmyelinated nerve fibers. Controversy exists concerning the size of the nidus and the distinction between osteoid osteoma and osteoblastoma; complete discussion of this debate is lengthy and is not within the scope of this text. The nidus usually measures less than 1 cm in diameter, but it can be as large as 2 cm. We use a diameter of 2 cm as the dividing line between osteoid osteoma and osteoblastoma (90,101,102,103,104,105,106,107,108,109,110,111,112,113,114,115,116,117,118,119,120,121,122,123 and 124).


According to Dahlin (102), osteoid osteomas comprise 11% of benign bone tumors and 3% of all osseous neoplasia. Older children, adolescents, and young adults are affected more frequently; most studies show an age range of 5 to 25 years comprising 75% of osteoid osteoma studied. Male patients predominate over female patients throughout the literature, with a ratio ranging from 2:1 to 4:1. Osteoid osteoma has a predilection for the long bones of the appendicular skeleton, and it affects the tibia and femur most often. Occurrence in the foot and ankle is not infrequent (90,101,102,103,104,105,106,107,108,109,110,111,112,113,114,115,116,117,118,119,120,121,122,123,124,125,126,127,128,129,130,131,132,133,134,135,136,137,138,139,140,141,142,143,144,145,146 and 147).

Clinical presentation often provides the most information in the diagnosis of osteoid osteoma. However, the clinical signs and symptoms frequently precede radiographic evidence of tumor. Diagnosis of osteoid osteoma is usually made 6 months to 2 years after initial presentation to a physician. Symptoms may last up to 6 to 7 years before diagnosis is made. Difficulty in diagnosis of osteoid osteomas is especially seen with lesions that involve the foot and ankle. Although there are reported cases of painless osteoid osteomas, pain is the most striking and consistent clinical feature of osteoid osteoma (148,149). The pain is usually nocturnal and at times is severe enough to wake the patient. Early in the development of the lesion, the pain may be initiated by activity, but as time goes by, the pain becomes unremitting. Relief of this pain with salicylates is considered by many clinicians to be a diagnostic feature. The origin of the pain associated with osteoid osteomas is uncertain, but it may be related to local prostaglandin activity (103,150). In two studies, neural tissue was demonstrated at the fibrous zone surrounding the nidus and in the nidal matrix (151,152). Each study independently postulated that pain related to osteoid osteoma resulted from a pressure sensitivity of perinidal and nidal nerves. Makely reported increased levels of prostaglandins E2, I2, and F associated with osteoid osteomas (150). The vasodilatory effects of prostaglandins occurring in a confined space (surrounding sclerosis) that is innervated could account for the exquisite pain associated with osteoid osteomas (103).

Specific objective findings are predicated on the location and type of the osteoid osteoma. Patients with long-standing, undiagnosed osteoid osteomas of the lower extremity may initially present with an antalgic gait. This is often accompanied by bone tenderness and possibly muscle atrophy. A patient with an intra-articular osteoid osteoma may present with the same clinical picture as a patient with monoarticular arthritis. Painful, decreased range of motion with a joint effusion is seen in both entities. Osteoid osteomas that occur in the phalanges often present with dactylitis of the affected digit. If the lesion occurs in the distal phalanx, the affected nail plate may be two to three times as wide as neighboring nail plates (126,153), an effect caused by the increased hyperemia associated with the tumor.

The radiographic hallmark of an osteoid osteoma is the lucent nidus, which is usually oval or circular, with a regular or smooth contour. The nidus is usually lytic, and it may contain varying amounts of calcification. The nidus is usually small, measuring between 0.5 and 1.0 cm, with an upper range of 2.0 cm. The classic osteoid osteoma described by Jaffe as an “annular sequestrum” is seen as an opaque nidus with a circumferential perivascular zone of lucency surrounded by peripheral sclerosis.

The appearance of an osteoid osteoma is determined by the type of bone in which it is located. Osteoid osteomas are classified into three types as follows: cortical, cancellous, and subperiosteal-para-articular (104). In general, cortical osteoid osteomas are the most common, and subperiosteal-para-articular osteoid osteomas are the least common. In the supramalleolar skeleton, the cortical variety is seen most often. However, cancellous and subperiosteal-para-articular osteoid osteomas occur more frequently in the foot and ankle than cortical osteoid osteomas. This finding may be explained by two anatomic characteristics. First, the small bones of the foot and ankle have a greater ratio of cancellous to cortical bone as compared with the remainder of the appendicular skeleton. Second, the foot and ankle comprise 28 bones, thus decreasing the ratio of bone to articular surface; this enhances the possibility of subperiosteal-para-articular occurrence in the foot and ankle. Characteristics of the three types of osteoid osteomas are as follows.


Cortical Type

In the cortical type, the nidus is surrounded by fulminate cortical thickening or perinidal sclerosis. The nidus is usually lucent and may be centrally or eccentrically placed within surrounding sclerosis. The lucent nidus is often obliterated by cortical thickening because the greatest perifocal density lies adjacent to the nidus. To appreciate the lucent nidus, the practitioner may need to alter radiographic technique (increase the kilovolt peak). If this fails, a tomogram or CT scan may be needed. Peripheral sclerosis tapers away from the nidus and is thickest at the nidus (105,106,107,108 and 109,126,127). The degree of cortical thickening of peripheral sclerosis may depend on the functional demands of the particular bone and the location of the nidus within the bone. When this type of osteoid osteoma affects the foot and ankle, it usually occurs in the metatarsals or, less often, the phalanges. When it involves the small tubular bones of the foot, the entire bone may appear to be fusiformly expanded secondary to periosteal new bone formation (107,110).


Cancellous Type

In the cancellous type, the nidus may be lucent or opaque and is almost always centrally located within surrounding peripheral sclerosis. The periphery of the nidus may not have any increased density, but it usually possesses a faint sclerotic margin. The cancellous osteoid osteomas infrequently produce substantial peripheral sclerosis. Once again, this is proportional to the functional demands of the area involved. The greater tarsus, lesser tarsus, and phalanges have an increased ratio of cancellous to cortical bone as compared with the metatarsals or other long bones of the appendicular skeleton; therefore, cancellous osteoid osteomas are predisposed to the foot and ankle (126,128,129,154).


Subperiosteal-Para-Articular Type

The subperiosteal-para-articular type usually shows an irregular osteolysis of the involved cortex. One may note a slight cortical thickening, but usually the cortical density is unaffected. The nidus may present with central calcifications (104,126,129). When it is para-articular, there is no reactive periosteal reaction, owing to the lack of intracapsular periosteum (110,126). Pressure may cause resorption adjacent to the articular surface. Osteophyte formation, joint space narrowing, and regional osteopenia have also been associated with para-articular osteoid osteomas that may be interpreted as degenerative arthritis (106,129). These qualities make differentiation from
degenerative arthritis difficult (130,155). This type of osteoid osteoma most commonly affects the dorsal neck of the talus.

A predilection for osteoid osteomas to occur in the talus has been noted. In an exhaustive review of the literature by Jackson et al, osteoid osteomas occurred in the talus 29 times out of 860 cases. This accounted for 3.37% of all cases and placed talar involvement as the seventh most common site (112). Capanna et al reviewed 430 patients with osteoblastoma and osteoid osteomas; 68 benign osseous lesions were localized to the foot; 40 of 68 occurred in the talus. Of the 40 talar osteoblastomas and osteoid osteomas, 33 were osteoid osteomas, and 24 of these 33 were the subperiosteal-para-articular variety (113).

The imaging workup begins with plain radiographs. If the patient is seen early in the clinical history, radiographs may be negative. This is especially true of osteoid osteomas occurring in the foot and ankle. Sweet et al studied 100 osteoid osteomas and found strong evidence for the diagnosis of osteoid osteomas on initial radiographs in 75 cases. Eight of the remaining cases revealed normal plain-film studies (126). If plain-film studies are negative but the clinical presentation is similar to that of osteoid osteoma, a bone scan may be performed. Bone scans are extremely sensitive for the detection of osteoid osteomas; in only a few reported cases have negative bone scans been associated with osteoid osteomas (156,157). Some authors stated that bone scans are also specific for osteoid osteomas, which display a characteristic “double density” sign on the third phase of a bone scan (156). CT is the best modality for the complete evaluation of osteoid osteomas (158,159 and 160). CT scan may be performed after the lesion has been localized by plain-film studies or bone scan. If initial plain radiographs suggest an osteoid osteoma, the bone scan may be omitted and the clinician can proceed immediately with a CT scan. Standard tomography is usually sufficient for identification of the nidus, but CT is superior for surgical planning and precise localization. Threemillimeter cuts are typically performed because the nidus normally measures between 0.5 and 1.5 cm on. If only 5-mm cuts are used, one may miss or only partially capture the nidus, thus rendering the examination equivocal.


MR Imaging.

Newer therapeutic options such as percutaneous radiofrequency thermablation, and less commonly percutaneous laser photocoagulation, or ethanol injection, typically require fluoroscopy or fluoro-CT. There have been reports of the successful use of MRI in guiding therapy (161). Nevertheless, the accuracy of identifying the nidus with MRI has been controversial (162,163,164,165 and 166). Spouge and Thain (167) report excellent results with medullary/periarticular lesions. However, its role is largely considered ancillary to CT scanning in the diagnosis of osteoid osteoma. The accuracy of MR imaging is optimized with high-resolution MR imaging requiring small field of views and thin sections (161,168). Nonetheless, there are case reports in which the nidus has been completely missed largely because of low nidal SI on all pulse sequences or confusing associated soft tissue findings. The nidus is typically low to intermediate signal on T1-weighted images, enhances with contrast, and is high SI on T2-weighted sequences. However, as noted, occasionally the T2 SI remains low.

Perilesional marrow edema is frequent (up to 60% of patients, especially young), although significant reactive sclerosis will appear as a low-SI periphery. Intra- or juxta-articular lesions may result in joint effusion. Peripherally located lesions (with respect to the cortex) are statistically more likely to have associated soft tissue edema with MR imaging. (169).

Typical differentials include those lesions that can manifest with focal cortical thickening/proliferation or as a focal intramedullary osteosclerotic lesion. These include solitary enostosis (bone island), medullary infarct, osteoma, osteoblastoma, osteoblastic metastatic foci (e.g., lymphoma), stress fracture, and chronic osteomyelitis. Of primary concern is differentiating osteomyelitis (Brodie abscess) versus osteoid osteoma. Madewell et al (170) stated that careful evaluation of surfaces can give a clue to probable diagnosis. Osteoid osteoma presents a well-defined inner border and a poorly defined outer border, whereas osteomyelitis shows poor definition on the inside and good definition peripherally (170). This feature can be seen more clearly on CT. The hypothesis of Madewell et al was confirmed in a study by Mahboubi in which, on CT scan, the inner border of sequestrated osteomyelitis was shown to have an irregular inner border and eccentrically placed nidus. The inner border of osteoid osteoma was shown to be smooth with a concentric nidus (160) (Fig. 93.18).


OSTEOBLASTOMA

Osteoblastoma is a rare, benign tumor that can be highly vascular and produces an abundance of osteoid and primitive woven bone. Although lesions can be found with fair frequency in the long tubular bones, osteoblastomas have a decided predilection for the bones of the axial skeleton, with up to 40% of cases being located within the vertebral bodies (especially posterior elements). Osteoblastomas are generally divided into conventional-benign and aggressive-malignant types. Most of this discussion is focused on the benign variety. An osteoblastoma possesses a wide spectrum of presentation with respect to clinical, roentgenologic, histologic, and pathologic parameters. At one end of the spectrum, osteoblastoma can mimic osteoid osteoma so closely that the size (>1.5 to 2.0 cm) of the particular lesion becomes the most important distinguishing feature. Dahlin originally coined the term “giant osteoid osteoma,” underscoring the histologic parallels between the two lesions. Schajowicz considered osteoid osteoma and osteoblastoma a continuum of the same entity seen in different types of bone and at different stages of development. At the other end of the spectrum, osteoblastomas can mimic osteosarcoma. One must be cognizant of the fact that low-grade osteosarcomas can bear a remarkable similarity to osteoblastomas, both radiographically and histologically. This underscores the importance of bone biopsy in the patient with suspicious radiographic findings.

Osteoblastomas account for approximately 1.0% of all primary bone tumors and 3% of all benign bone tumors. Around 70% of the reported cases occur in patients less than 30 years of age; most of those patients present between the ages 10 and 20 years, with a range of 3 to 78 years. A 2:1 to 3:1 male-tofemale predominance exists throughout the literature. Between 30% and 40% of all osteoblastomas are seen in the spinal column. The long tubular bones are the second most commonly affected area, with the small bones of the hands and feet frequently involved (171,172,173,174,175,176,177,178,179,180,181,182,183,184,185,186,187,188,189,190,191,192,193,194,195 and 196). The distribution of osteoblastomas in the foot ranges from 6.4% to 13.5% (173). The bone most commonly affected is the talus.

The most common clinical complaint associated with an osteoblastoma is pain. The pain is usually localized to the affected area and is dull. This can mimic the pain seen in osteoid osteoma, but usually it is not as severe, is not nocturnal, and does not usually respond to salicylates. McLeod et al (180)
showed that only 13% of 123 osteoblastomas were more painful at night, and only 7% responded to aspirin. In a separate study by Kroon and Schurmans, only 7.5% of 94 patients indicated pain interfered with sleep, whereas “none complained of pain occurring predominantly at night.” No correlation between use of salicylates and relief of pain was found in this study (181). Swelling is also a common finding in osteoblastoma; this is especially true of osteoblastoma of the foot and ankle because there is little soft tissue to hide the expansion of the lesion. Disuse atrophy and an antalgic gait can be seen in patients with osteoblastoma of the foot and ankle.


Figure 93.18 A: Radiographs of a patient in her early 30s with complaints of anterior and medial ankle pain. Note the small radiodensity at the medial corner of the ankle joint. B: A CT scan more clearly delineates the osteoid osteoma.

Dahlin and Johnson (182) commented on areas of differentiation between osteoid osteoma and osteoblastoma and stated that osteoblastomas are larger, are more vascular, and have a greater tendency toward progression. This statement applies not only to the histologic and gross pathologic nature of osteoblastomas but also to the radiographic presentation of these two benign osseous entities. Osteoblastomas are larger, ranging from 2 to 12 cm, but rarely exceeding 6 cm in diameter (179). Histologically, osteoblastomas are more vascular, a feature that translates to a greater degree of lucency radiographically. Finally, osteoblastomas have a higher incidence of progression on serial plain radiographs; this is reflected in the different gradations of osteoblastoma: conventional and aggressive-malignant.

In tubular bones, osteoblastomas are found predominately in the diaphysis and less often at the metaphysis. Epiphyseal involvement is rare (180,181). McLeod et al found 76% diaphyseal involvement and 24% metaphyseal involvement, whereas Kroon and Schurmans showed the diaphyseal-to-metaphyseal ratio to be less than 58% to 42%, respectively. Osteoblastomas are usually geographic when they affect the tubular bones (183,184 and 185). Of the cases reported by McLeod et al, 83% displayed a distinct margin, whereas 24 of 26 (92%) of the tubular osteoblastomas reported by Kroon and Schurmans presented as well-defined lesions with a sclerotic rim.


Radiography.

Osteoblastomas can present as purely lytic, mixed lytic-blastic, or blastic lesions. Most often, however, they appear as expansile lytic or lytic-blastic lesions that are usually well demarcated (190,192). Osteoblastomas display great variability with respect to radiographic density. This variability can be seen when comparing different lesions or in different areas within the same lesion. The lytic zone frequently demonstrates a haphazard internal matrix pattern consisting of irregular flecks and patches of ossification (183,184). Kroon and Schurmans (181) stated that the ossification pattern is different in the foot and ankle than in the long bones of the appendicular skeleton, that is, the ossification is finer and shows a “more cystic or soap bubble appearance.” Greenspan has identified four distinctive types of osteoblastoma with plain-film imaging (197): (a) lesions identical to osteoid osteomas, but with a larger nidus/lytic zone and more prominent periosteal new bone formation; (b) blow-out expansile lesions mimicking ABC. Intralesional ossification may be the only distinguishing clue. This pattern is more likely in slender long/tubular bones and the vertebral bodies; (c) aggressive lesion, simulating malignancy; and (d) juxtacortical (periosteal) lesions. This is the rarest of the four radiographic subtypes. Juxtacortical osteoblastomas typically lack perifocal bony sclerosis but are surrounded by a thin shell of periosteal new bone. Therefore, in light of the foregoing, the radiographic spectrum of osteoblastoma is somewhat “pleomorphic.” Diaphyseal location, ossific flecks, and periosteal new bone overlay may be important clues to raise suspicion of osteoblastoma. On occasion, an osteoblastoma can even present with a lobulated contour, mimicking a cartilaginous lesion (198).

Cortical integrity must be evaluated thoroughly, often requiring multiple imaging modalities. In the study by McLeod et al, 20% of the cases displayed “definite cortical destruction,” and other studies have shown cortical destruction to be associated with a soft tissue extension (174,184). These observations usually point to a biologically active process (174); however,
throughout the literature, a characteristic finding is a thin delimiting periosteal reaction. This periosteal reaction is a solid, benign type that surrounds the soft tissue or tumor extension (183,184,185 and 186). This periosteal shell often is not fully appreciated on plain radiographs, and a CT scan is required to evaluate fully for possible malignant characteristics. Suspicious periosteal reactions may occur. In the study by Kroon and Schurmans, 2 of 26 cases in long tubular bones displayed a spiculated periosteal reaction. Mirra stated that a spiculated periosteal reaction signifies a malignant tumor in approximately 80% of the cases seen; thus, appropriate evaluation of the soft tissue extension is mandated.

In the foot, osteoblastomas are most commonly found occupying the dorsal talar neck. Kroon and Schurmans encountered 16 osteoblastomas in the talus, 10 of which were eccentric within the medulla of the talar neck. The remaining six were cortical-subperiosteal on the dorsal talar neck. Capanna et al (186) reviewed eight osteoblastomas of the talus; three were subperiosteal and five were medullary (four involving the talar neck and one affecting the posterior body); seven of eight affected the talar neck. In both studies, talar osteoblastomas were characterized as lytic lesions with an irregular internal ossification pattern when present. A faint endosteal sclerosis was usually present within the talar neck. Expansion into the soft tissues was common.


MR Imaging.

Osteoblastomas typically demonstrate low to intermediate SI on T1-weighted images and intermediate to high SI on T2-weighted images. These findings are nonspecific and typical of most bone tumors. As a frame of reference, most lesions are hyperintense relative to marrow on T2-weighted images. However, they can also manifest heterogeneous hypointensity relative to marrow on non-fat-suppressed T2-weighted images, presumably reflective of the ossific matrix of the lesion. Focal intralesional signal voids noted with all pulse sequences typically reflect mineralized matrix calcification or ossification. Perilesional sclerosis is low SI on all sequences.

As with chondroblastoma, osteoblastomas often display significant perilesional marrow and soft tissue inflammation, most notable on water-weighted pulse sequences. Lesions typically enhance after the intravenous administration of gadolinium-based contrast material.

In light of the foregoing, it is apparent that the strength of MR imaging of osteoblastomas is, as with CT scanning, in its ability to demonstrate the extent of soft tissue and bony involvement of the lesion.


OSTEOGENIC SARCOMA

Osteogenic sarcoma is a malignant bone tumor composed of a highly virulent stroma that produces osteoid or immature bone. It is generally classified with other mesenchymal cell tumors such as chondrosarcoma and fibrosarcoma. Osteogenic sarcoma is the second most common primary malignant bone tumor, with multiple myeloma leading the way. Osteosarcoma is, however, the most common primary malignant bone tumor of adolescents and young adults. It is nonetheless rare in the foot and ankle. Osteosarcomas are generally classified as either intramedullary (high-grade/conventional, telangiectatic, low-grade, small cell, gnathic tumors), surface (intracortical, parosteal, periosteal, intracortical, high-grade surface), and extraskeletal lesions. In addition, lesions can be either primary or secondary. Well-known causes of secondary malignant degeneration include chronic osteomyelitis, Paget disease, osteonecrosis (e.g., irradiation), and fibrous dysplasia (199). Approximately 75% of all lesions are of the conventional or high-grade intramedullary variety. The remainder of this section focuses on this most common variety.

Approximately 500 to 600 new cases of osteogenic sarcoma occur per year (200). This neoplasm predominately affects children, adolescents, and young adults. Indeed, conventional osteosarcoma occurs most often in the second and third decades, with some 75% of cases encountered in patients between the ages of 15 and 25 years. Not surprisingly, the incidence of osteosarcoma corresponds with the period in which peak osseous growth takes place. In fact, a correlation has been made between the height of an individual in any given age group and the occurrence of osteosarcoma (201). Male patients are affected more often than female patients. Early in the disease process, the most common clinical complaint is pain, which may or may not be accompanied with swelling. An enlarging mass, gross deformity, and decreased range of motion at a neighboring joint are common complaints late in the disease. The initial prognosis for these new cases has changed drastically over the past 15 years. Before the advent of adjuvant chemotherapy, 85% of patients diagnosed with osteogenic sarcoma died within 2 years. Retrospective studies done for this period show a poor prognosis. Five-year survival rates did not exceed 25%, and most studies gave a 5-year survival rate between 10% and 20% (202,203,204,205 and 206). High attrition rates result from an aggressive neoplasm that has a propensity for metastasis. The two most common sites of metastasis are the lungs and the skeletal system. Mirra stated that 85% of osteogenic sarcomas develop micrometastasis before the diagnosis of the primary osseous lesion. Initially, these micrometastases may not be detected on routine survey (chest radiograph, bone scan, and even CT scan) (207). In the review by McKenna et al (206) of 522 osteogenic sarcomas, 70% showed evidence of pulmonary metastasis, and most deaths were a result of respiratory compromise.

Although covered elsewhere, perioperative adjunctive chemotherapy has significantly improved long-term prognosis (207). Lane et al stated that multidrug chemotherapy regimens increased the 5-year survival rate to nearly 85% (200,208). Chemotherapy can eliminate metastatic foci and can reduce or totally prevent further metastasis from a primary source by limiting or actually decreasing the size of the primary lesion. Reducing the size of the primary lesion also increases the probability of successful reconstructive surgery. To maximize the benefits of chemotherapy, early diagnosis is essential. This places significant importance on subtle radiographic changes that may be consistent with osteogenic sarcoma. The literature has placed emphasis on findings that may suggest an aggressive process in the absence of significant osseous destruction (209).

The most common sites of occurrence are the distal femur, the proximal tibia, and the proximal humerus, in decreasing order. A review of major studies showed that osteosarcoma affects the knee region 53.1% (1,850 of 3,482) of the time (proximal fibula included). Only 2.9% (101 of 3,482) of these cases involved the foot and ankle, and when the foot and ankle were involved, it was largely because of ankle involvement: 74 of 101. Only 27 cases or less than 1% of 3,482 osteosarcomas involved the foot (201,203,204 and 205,210,211 and 212). Although the rate of occurrence in the foot is infrequent, the most common malignant tumor in this region is osteogenic sarcoma, especially in childhood (213). The calcaneus and the metatarsals are the
most common sites in osteosarcoma of the foot (214,215 and 216). The short tubular bones of the foot are rarely, if ever, affected. Mirra et al (216) failed to find any cases of phalangeal osteosarcoma in their review of 4,214 cases reported in the literature. Subsequently, Mirra et al (216) and Harrelson (217) reported isolated cases of phalangeal osteosarcoma.


Radiography.

Osteosarcomatous lesions can be purely osteolytic (~30% of cases), purely osteoblastic (~45% of cases), or a mixture of both. When lytic areas have not undergone neogenic ossification, moth-eaten or permeative destruction may be evident, as osteosarcomas usually display a type II or III tumor margin. In keeping with the aggressive growth rates of these high-grade tumors, lesions typically penetrate the cortex without producing cortical expansion or bulging. In addition, consistent with this rapid growth rate, lesions typically double in 20 to 30 days; tumors are usually large at the time of discovery (>6 cm) and exhibit many signs consistent with malignancy when first encountered (199). Unfortunately, the disease is usually discovered after significant structural alteration of bone has occurred. Lesions are most commonly centered in the metaphysis of long bones; however, involvement of flat bones may be equal to long bone involvement after the third decade (203,218). Extension into the diaphysis is not uncommon, whereas joint involvement is rare. Based upon the typical radiographic appearance, physeal cartilage has been considered a barrier in confining epiphyseal spread of the tumor. Nevertheless, once the physeal plate has fused, extension of the tumor into the epiphysis can occur (219). In fact, spread across the physis is now known to be considerably more common than previously believed. Pathologic evaluations have indicated that some 75% to 88% of metaphyseal osteosarcomas demonstrate epiphyseal extension through the cartilaginous physis (199,220,221). In many instances, these lesions are radiographically occult and only discernable with ancillary (e.g., MR) imaging. Isolated epiphyseal or diaphyseal lesions are rare (207).

The most striking feature may be a large amount of heterogeneous, osseous proliferation by osteoid-producing tumor cells. This common matrix pattern often obliterates or falsely decreases the observer’s appreciation for bone destruction. The picture of a uniformly dense lesion is commonly seen in the late stages of osteosarcoma (222,223,224 and 225). Subtle findings such as increased intramedullary density and small focal areas of destruction without margination may be early clues to osteosarcoma (209). As previously noted, osteosarcomas may also present as a purely osteolytic form or, most typically, as a combination of lysis and proliferation. Obvious cortical disruption associated with a soft tissue mass is not an uncommon finding. Soft tissue masses were visible in 41 of 47 cases of osteosarcoma in a review by Hudson et al. In 20 of these cases, dense, cloudy bone was contained within the soft tissue mass (226). Expansion of the cortex does not occur because the tumor rapidly permeates the cortex. This involvement produces Codman triangles and laminated and spiculated (sunburst pattern) periosteal reactions. Codman triangles are highly suggestive of osteosarcoma, but by no means pathognomonic; they may be associated with other malignant lesions such as Ewing sarcoma or benign entities such as acute osteomyelitis, ABC, and subperiosteal hemorrhage (207).

Codman triangle in the absence of any other radiographic findings should also be considered highly suggestive of osteosarcoma. In early osteosarcoma, classic findings such as soft tissue extension and cortical disruption are difficult to appreciate by plain radiography. Further radiologic investigation (bone scan, CT scan, or MRI) is helpful to assess the full extent of osseous disease completely and accurately, especially when subtle findings consistent with malignant disease are present.

Reports of primary osteosarcoma affecting the foot are scattered throughout the literature (227,228 and 229). Because of the rarity of osteosarcoma affecting the foot, no study has been published that specifically discusses the radiographic characteristics of pedal osteosarcoma. Because of the decreased size of the bones of the foot as compared with the tibia or femur, involvement of a pedal bone often affects the entire bone. This entails complete loss of the normal architecture of the osseous structure involved. The tubular bones of the foot are affected in a similar fashion with respect to the long bones of the entire body. Osteosarcoma of the tarsal bones, specifically the calcaneus, may not follow the same pattern of localization within the bone (215), but no description has been offered that differs significantly from classic osteosarcoma with regard to tumor margin, matrix production, soft tissue extension, cortical disruption, or periosteal involvement (Fig. 93.19).


MR Imaging.

The signal characteristics of osteosarcoma generally vary with the degree of matrix mineralization, and lesions typically are inhomogenous. Noncalcified portions of osteosarcomatous lesions demonstrate low to intermediate T1 SI versus low intensity for mineralized regions. With T2-weighted pulse sequences, mineralized portions demonstrate low SI as opposed to high SI for nonossified portions of the tumor. Soft tissue masses can be variably high SI. In addition, intralesional hemorrhage and necrosis are common. Foci of hemorrhage are
denoted by high SI with all MR pulse sequences, whereas focal areas of necrosis are low SI on T1-weighted images and often high SI on T2-weighted MR images.


Figure 93.19 Osteosarcoma of fifth metatarsal bone. The lesion appears to occupy the entire diaphysis and distal metaphysis and epiphysoid regions. The cortex is poorly defined in the diaphyseal zone and has probably been eroded. Circumferentially, a spiculated sunburst periosteal reaction is noted. Although the matrix appears flocculent toward the periphery of the lesion, it becomes much more globular to homogeneous toward the central axis of this lesion, a finding suggestive of an ossific matrix. Examination of the most proximal margin of this lesion suggests underlying moth-eaten destruction. (Courtesy of David Sartoris, MD.)

MRI is considered the most important imaging modality for accurate local staging and aiding in the determination of appropriate surgical management. To this end, assessing the tumor’s relationship to the anatomic compartment of origin and to adjacent compartments is critical. Individual bones, joints, and anatomic soft tissue spaces defined by normal (nonadventitial) fascia are all considered compartments (230). As a general statement, disease confined to its original compartment carries a better prognosis than disease that has spread beyond into other compartments (80,231,232). Conventional staging systems used for other solid tumors are rather inappropriate for skeletal tumors because these tumors rarely involve lymph nodes or spread regionally. Rather, the staging system of the Musculoskeletal Tumor Society has adopted the Enneking system of classification. Although covered in greater detail elsewhere in this textbook, Enneking classification is based on grade, extramedullary spread, and metastases. These features are probably most important for nonmalignant skeletal tumors. For lesions like osteosarcoma, the foremost question regarding staging is whether the tumor has metastasized. To quote Enneking, “How a specific procedure is accomplished is influenced by the anatomical setting of the lesion, and has to do with whether the lesion is confined within well-defined anatomical compartments or is diffusely infiltrating through defined adventitial planes and spaces. Although size is a factor in surgical planning, it is not the dominant one” (231). This is further elaborated upon in the section on bone tumor therapy.

In assessing the degree of intraosseous and extraosseous tumor involvement, the most accurate sequence for determining the extent of disease is the T1-weighted spin-echo sequence. As with osteomyelitis, STIR images significantly overestimate the extent of the lesion inasmuch as marrow hyperplasia and edema can show high SI similar to that of tumor. More specifically, MRI is instrumental in determining the longitudinal distance of bone containing tumor, the involvement of adjacent epiphyses, and the presence or absence of skip metastases (synchronous tumor foci occurring within the same bone that are anatomically separate from the primary lesion) (230). Patients with skip metastases are more likely to have distant metastases disease. With respect to epiphyseal extension, as noted before, MRI may be critical in making this determination. Both T1-weighted and STIR sequences are used in this regard, with STIR sequences more sensitive and T1 sequences more specific (230).


CARTILAGINOUS TUMORS

As a general overview to the radiologic approach of the cartilaginous tumors of bone, Giudici et al (233) noted that in an era when one marvels at the sophisticated cross-sectional imaging modalities available such as CT and MR imaging, the conventional radiograph obtained in at least two orthogonal plane directions remains the imaging modality best suited for “naming the cartilaginous tumor” or, for that matter, any bone tumor. Additionally, one cannot overemphasize the importance of serial imaging to make comparisons with older radiographs. Of paramount importance, the clinician should be wary of the appearance of any changing margins or matrix patterns. These may include a sclerotic margin evinced on an earlier radiograph that has since vanished or the disappearance of punctate, flocculent, or rings and arcs calcification. Although subtle, these changes are ominous and suggest more aggressive biologic activity such as malignant transformation or, less commonly, superimposed osteomyelitis (234). A lobular growth pattern is a classic histologic feature of all cartilaginous tumors (233,235), and this is occasionally noted as a marginal characteristic on the radiograph (especially when the tumor abuts the inner cortex). Intercellular cartilaginous matrix, when mineralized, is sufficiently characteristic morphologically to provide quick labeling of the lesion as probably cartilaginous. However, plain-film radiographic “look-alikes” include medullary infarction of bone, certain vascular tumors, and dystrophic calcinosis within lesions such as intraosseous lipoma.


CHONDROMA (INCLUDING ENCHONDROMA AND PERIOSTEAL/JUXTACORTICAL CHONDROMA)

Chondroma is a term reserved for any benign tumor comprised of normal-appearing, mature hyaline cartilage (236,237,238,239,240 and 241). It is thought to arise from a failure of normal endochondral ossification (241,242,243 and 244). When located in its usual central location within intramedullary bone, it is known as an enchondroma (245,246), whereas a periosteal or juxtacortical chondroma arises on the surface of a bone (238). Multiple enchondromatosis (Ollier disease) is a rare, noninherited dyschondroplasia marked by multiple chondromas distributed throughout the bones of the skeleton that frequently results in growth disturbances; when it is associated with soft tissue hemangiomas, and other subcutaneous and visceral tumors, the disease is termed Maffucci syndrome (244,247).

Chondromas comprise about 10% of benign bone lesions and less than 4% of all primary bone tumors (248). Enchondromas outnumber periosteal chondromas by more than three to one; these lesions occur less commonly than osteochondromas, but they are decidedly more common than chondroblastomas or CMFs within the small tubular bones (248,249,250 and 251). This tumor may be the most common solitary lesion affecting the phalanges, especially the hands (252). Moser reported that involvement of the phalanges of the hand exceeds that of the foot in a 6:1 ratio, and an even greater 9:1 ratio was noted when hand metacarpals and foot metatarsals were compared (250,251). Therefore, the frequency of pedal enchondromas is frequently overemphasized. For example, in the same approximate age range of enchondromas, GCTs are probably (at the very least) as frequently encountered when the pedal phalanges are involved or metatarsal bones are involved.

Even though enchondromas may occur at any age, more than half are seen in younger adults, with the peak incidence in the 30s (253,254,255 and 256). Multiple enchondromatosis tends to occur at a much earlier age and is frequently seen in childhood through adolescence; it may also be evident at birth (247). There does not appear to be a significant sex predilection reported for enchondromas, although male predominance is usually seen in Ollier disease and Maffucci syndrome (247,249).

Most chondromas occur as a solitary lesion (244,245 and 246); when multiple bones are affected, the term enchondromatosis is used (255,256,257,258 and 259). Chondromas occur almost entirely in bones of cartilaginous origin (240,246). The small tubular bones of the hands and feet are most commonly affected (260,261), followed by the long bones of the extremities and, occasionally, the ribs and pelvis (236,248). Most enchondromas are centrally located within the medullary canal (252,253) and generally originate from the
metaphyseal region; however, they can also be found in the diaphysis or metadiaphyseal area. These lesions do not appear to violate the physis but may, on very rare occasions, be situated solely in the epiphyses either before or after skeletal maturity (197,240,245,686,687). This statement excludes enchondromas of the short tubular bones of the hands and feet, which frequently occupy much of the bone. In addition, combining two separate studies (262,263), 36 of 41 parosteal chondromas were found in the metaphysis, with a proximal to distal ratio of 4:1 noted in one of the studies (262). Multiple enchondromatosis (Ollier disease) can affect both the small and large tubular bones, as well as the flat bones. The lesions are also generally located about the metaphyseal and metadiaphyseal areas (247). Early studies emphasized a tendency toward unilateral involvement, although more recent studies show that enchondromatosis is frequently bilateral, but with a strong predilection for one side of the body (i.e., an asymmetric distribution) (238,247).

The symptoms of enchondromas are generally mild and nonspecific. Most enchondromas are initially asymptomatic and are found incidentally during an unrelated examination (238,240). Insidious onset of pain and swelling are the most common presenting complaints (245,253). Pathologic fracture is not uncommon at presentation because the symptoms usually develop as a result of local trauma (257,261). An important consideration is the development of pain in a previously asymptomatic patient, in the absence of a fracture (238). In this case, pain is often the initial symptom of malignant transformation (239). Periosteal chondromas usually also present with a slow-growing firm mass, with or without local tenderness, accompanied by swelling at the site of the lesion (260,264). Juxta-articular lesions can cause pain with range of motion of the affected joint. Duration of symptoms to time of presentation for chondroma varies from months to as long as 15 years (259). In a study by Boriani et al (262), the duration of symptoms in 12 patients averaged 21 months, with a range of 10 to 60 months. Multiple enchondromatosis frequently presents with asymmetric shortening of the extremities, usually recognized at birth and confirmed by radiographs (247). Irregular, “knobby” swelling of the digits is also seen (238).

The microscopic appearance of enchondroma is characteristic: lobules of hyaline cartilage cells of varying cellularity predominate, with scattered calcifications seen at the periphery (253). Periosteal chondromas are generally more cellular than enchondromas. Cellularity is not useful in evaluating these lesions, particularly in the hands and feet, because chondromas often show atypia in these locations and yet are benign (264). Mirra et al (243) proposed tissue patterns as a reliable means of identification of chondromas. The enchondromatous pattern aids in the diagnosis of enchondromatous tissue and establishes the condition as benign. The definitive sign that the lesion is benign is the encasement pattern; this is the shell of reactive new bone that encompasses the cartilage nodules and forms the “island of cartilage” pattern (242). Enchondroma only rarely undergoes malignant degeneration into a chondrosarcoma (245). This is usually seen in a long tubular bone over a period of years (239,245). Histologically, the lesions of enchondromatosis are essentially identical to those of solitary enchondromas (238), although the cellular changes may be more bizarre (247). There is an increased tendency for malignant degeneration (264); up to 50% of patients with Ollier disease and 15% with Maffucci syndrome undergo sarcomatous change (236,244). Unlike the solitary enchondroma, even lesions in the small tubular bones may become malignant; this is particularly true in patients with Maffucci syndrome (238).

Only gold members can continue reading. Log In or Register to continue

Stay updated, free articles. Join our Telegram channel

Jul 26, 2016 | Posted by in MUSCULOSKELETAL MEDICINE | Comments Off on Bone Tumors of the Foot and Ankle

Full access? Get Clinical Tree

Get Clinical Tree app for offline access